
Abstract
Background
Limited data are available regarding the reproducibility of lactulose and fructose breath testing for clinical application in functional bowel disorders.
Objectives
The purpose of this study was to investigate the reproducibility of lactulose and fructose breath hydrogen testing and assess symptom response to fructose testing.
Methods
Results were analysed from 21 patients with functional bowel disorder with lactulose breath tests and 30 with fructose breath tests who completed another test >2 weeks later. Oro-caecal transit time, hydrogen responses, both qualitatively (positive/negative) and quantitatively (area under the curve (AUC) for hydrogen), were compared between tests. In another 36 patients, data scores for overall abdominal symptoms, abdominal pain, bloating, wind, nausea and fatigue were collected during the fructose test and compared to hydrogen responses.
Results
No correlations were found for lactulose AUC (linear regression, p = 0.58) or transit time (Spearman's p = 0.54) between tests. A significant proportion (30%) lost the presence of fructose malabsorption (p < 0.01). Hydrogen AUC for fructose did not correlate between tests, (r = 0.28, p = 0.17) independent of time between testing (p = 0.82). Whilst patients with fructose malabsorption were more likely to report symptoms than those without (56% vs 17%; p = 0.04), changes in symptom severity were not different (p > 0.05).
Conclusions
Routine use of lactulose and fructose breath tests in functional bowel disorder patients is not supported due to its poor reproducibility and low predictive value for symptom responses.
Introduction
There has been much discussion about the role of breath hydrogen and methane tests in guiding clinical decision-making for patients with functional bowel disorders. Breath tests are used to screen for the presence of carbohydrate malabsorption associated with the induction of gastrointestinal symptoms. The principle behind breath testing is that, following ingestion of a carbohydrate, any unabsorbed carbohydrate will travel to the large intestine and be fermented by colonic bacteria generating by-products of hydrogen and/or methane, which can then be measured in expired air. Controversy has emerged over the interpretation of these results and their clinical application.
The synthetic disaccharide, lactulose, cannot be digested in the small intestine and is completely malabsorbed, 1 hence is fermented in the large intestine. An individual's ability to produce hydrogen and/or methane following a lactulose load can be used as a positive control as a lack of response C1: in breath hydrogen during a lactulose test identifies individuals without hydrogen-producing microflora. 1 Therefore, it is frequently performed as a baseline test in the clinical setting to assist in the interpretation of subsequent breath tests. It is also commonly used to detect small intestinal bacterial overgrowth (SIBO) in functional bowel disorder patients using criteria such as early breath hydrogen rise and double peaks. 2 Additionally, its utility has recently been extended to predict symptomatic responses to antibiotic therapy, both in the absence or presence of SIBO. 3 The specificity and/or sensitivity of such markers are low. 4
The use of lactose breath hydrogen testing has received wide acceptance. 5 However, the same cannot be said for slowly absorbed short-chain carbohydrates, fructose, sorbitol and mannitol, despite their frequent application in clinical practice. 6 The rationale for performing these tests is to detect in an individual whether they malabsorb sugar in order to design appropriate dietary strategies. In this way, the presence of malabsorption of, for example, fructose would lead to its restriction, whereas complete absorption would negate such a need, particularly in the setting of other restrictions on a low fermentable oligosaccharide, disaccharide, monosaccharide and polyol (FODMAP) diet.7,8 An open-label study found that a positive breath test particularly to fructose predicted greater symptomatic response to a low FODMAP diet 8 and that breath testing results helped to understand the role of FODMAPs in symptom induction, contributing to dietary adherence.
There are, however, significant gaps in the interpretation of breath testing for clinical practice including criteria to define a positive test or dose of sugar used. For tests that lead to clinical decisions on the basis of a single study, there are limited data on the reproducibility of breath testing measures for lactulose and fructose, the two most commonly tested sugar substrates. 6 Hints that issues may be present have been suggested. A loss of fructose malabsorption has been observed in 29% of patients over 12 months in the control arm of an interventional study. 9 While the use of lactulose testing as a marker of oro-caecal transit time appeared to have good reproducibility in healthy volunteers using non-standard criteria for a positive test, 10 a recent study targeting those with short oro-caecal transit time had widely variable repeated values. 11
The current study aimed, therefore, to investigate the test-retest reproducibility of lactulose and fructose breath hydrogen testing, to identify factors related to variability and, in a cross-sectional design, to examine the association of gastrointestinal symptoms following ingestion of fructose and the presence of malabsorption within a single fructose breath test.
Materials and methods
Subjects
Results were obtained from patients enrolled in the control arm of prospective clinical trials, including a probiotic, bovine colostrum intervention and acute fructose challenge, conducted in the Departments of Gastroenterology at Box Hill or Alfred Hospitals, in which similar breath testing protocols were applied.11,12 In Cohort 1, breath hydrogen tests following lactulose and fructose were repeatedly performed with a placebo administered between tests in order to examine issues of reproducibility. The placebo consisted of a milk-based product without any probiotic (negligible lactose content < 1 g/serve) or bovine colostrum (all patients had a negative lactose breath test to this product). The influence of lactose on breath outcomes in this study had previously been excluded. To be included, an adequate breath hydrogen response to lactulose was required on the index test, defined as ≥10 ppm rise in hydrogen over baseline in two consecutive samples. 1 This cohort also included patients with a previous positive fructose breath test, denoted as a hydrogen rise ≥10 ppm over baseline in two consecutive samples following ingestion of fructose. In Cohort 2, detailed symptom assessment was made following a single fructose breath test in order to correlate symptom generation with fructose malabsorption. All patients had functional bowel disorders (Rome III criteria)13 and were aged between 16–70 years. Subjects were excluded if they were predominantly methane producers, had used antibiotics or probiotics for two weeks before testing, taken a colonoscopy preparation within four weeks prior to testing, were pregnant or breastfeeding, and had any other gastrointestinal disease or diabetes. All subjects had given written informed consent to participate in repeat testing and the respective study protocols had been approved by the Eastern Health Research and Ethics Committee (E57/1112, E61/0809) and the Alfred Human Ethics Research Committee (124/12). None of the participants received economic compensation for completing repeated testing.
Breath hydrogen testing protocols
For 24 h prior to testing, subjects consumed a diet low in fibre and FODMAPs. Subjects were asked to refrain from smoking and avoid vigorous exercise prior and during the collection period. Following an overnight fast, the test was performed using 15 g lactulose in 100 ml solution or 35 g fructose in 200 ml solution and collection of breath samples at baseline and at subsequent intervals of 15 or 20 min for up to 4 h. Breath hydrogen concentrations were analysed using gas chromatography (Quintron Instrument Co., USA). For lactulose, hydrogen-producing capacity was expressed qualitatively as ‘adequate’ (as defined above). Fructose malabsorption was determined by the presence of a significant rise in breath hydrogen (as defined above). Breath hydrogen production was quantitatively assessed by measuring area under the curve (AUC) for the duration of the test following both sugars. The time of first hydrogen rise of ≥10 ppm over the baseline breath hydrogen was also recorded.
Repeat lactulose and fructose tests were conducted after ≥2 weeks using similar procedures. The results of both tests were used to assess the primary end-point of the study – the test-retest reproducibility of breath testing responses to lactulose and fructose respectively. As a secondary end-point, the relationship between changes in hydrogen response to fructose between tests was examined with ‘short term’ being arbitrarily defined as if the intervals were ≤8 weeks, and ‘long term’ when the interval was >8 weeks. Additionally, the duration between tests were also analysed to examine the influence of time on variability of test results.
Symptom data
For Cohort 2, symptom data were collected for participants completing a single fructose breath test. Symptom diaries were completed on the day prior to the breath test whilst consuming the pre-test diet (baseline symptoms) and immediately following the completion of the breath test. Participants rated their overall abdominal symptoms, abdominal pain, bloating, wind, nausea and fatigue using a four-point Likert scale and a validated 100 mm visual analogue scale (VAS). 14 A change of ≥ 20 mm on VAS for overall symptoms was considered to be a clinically significant response to fructose, as applied in a similar food re-challenge study. 15 On the four-point Likert scale, a composite score was calculated which was the sum of intensities of abdominal pain, bloating, wind, nausea and lethargy with a score ≥25% from baseline considered a positive symptom response.
Statistical analysis
Data were analysed using IBM SPSS version 20 (SPSS Inc., Chicago, USA). Summary data were expressed as mean and 95% confidence intervals (CIs) or for non-parametric data, as median and inter-quartile range (IQR). The Pearson chi-squared test (χ 2 ) and Fisher's exact test were used for categorical data. Test-retest reproducibility of breath responses between the index and repeat test were analysed using a Spearman's correlation test and a linear regression model. Changes in symptomatology were analysed in relation to breath hydrogen responses to fructose in two ways. Firstly, using paired t-test for baseline vs test-day symptoms. Secondly, comparing test-day symptoms adjusted for baseline between those with a positive vs negative fructose breath test via unpaired t-test and, for categorical symptom data, using the Mann–Whitney test. A p-value ≤ 0.05 was considered statistically significant, except where adjustment was made to the critical p-value to account for multiple comparisons using Bonferroni's correction.
Results
Patients
Baseline demographics of participants in the two cohorts studied
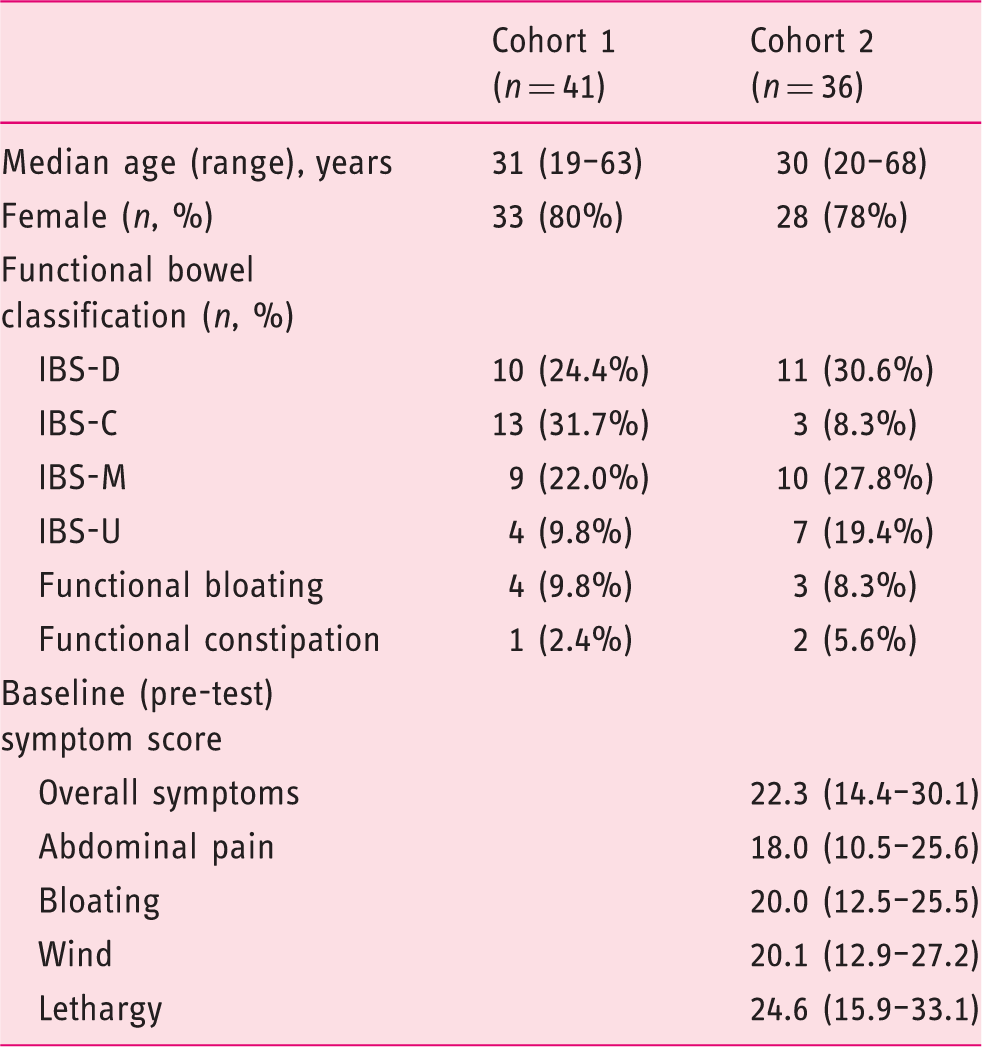
IBS: irri le bowel syndrome; IBS-C: IBS constipation-predominant; IBS-D: IBS diarrhoea-predominant; IBS-M: IBS with mixed bowel habits; IBS-U: IBS unsubtyped.
Lactulose breath testing
A total of 21 patients had adequate breath hydrogen responses on the index test. Of these, one (4%) no longer produced adequate hydrogen upon re-testing. During baseline, 6/21 (29%) patients also produced significant quantities of methane (≥15 ppm over baseline) whilst only three (14%) patients retained this response on re-test. Mean 4 h hydrogen AUC was similar at index test (4911 (3448–6374) ppm) vs re-test (4262 (3046–5477) ppm, 4 h). However, a marked difference was observed for paired results where the change in AUC from index to re-test varied from 8.5–343.7%. By regression analysis, hydrogen AUC between the two tests were not significantly correlated (Figure 1(a)).
The relationship of breath hydrogen area under the curve (AUC) between two separate testing periods (a) after 15 g lactulose; and (b) after 35 g fructose. Neither analysis showed statistically significant relationships (linear regression, (a) r = 0.13; p = 0.58; and (b) r = 0.28; p = 0.17).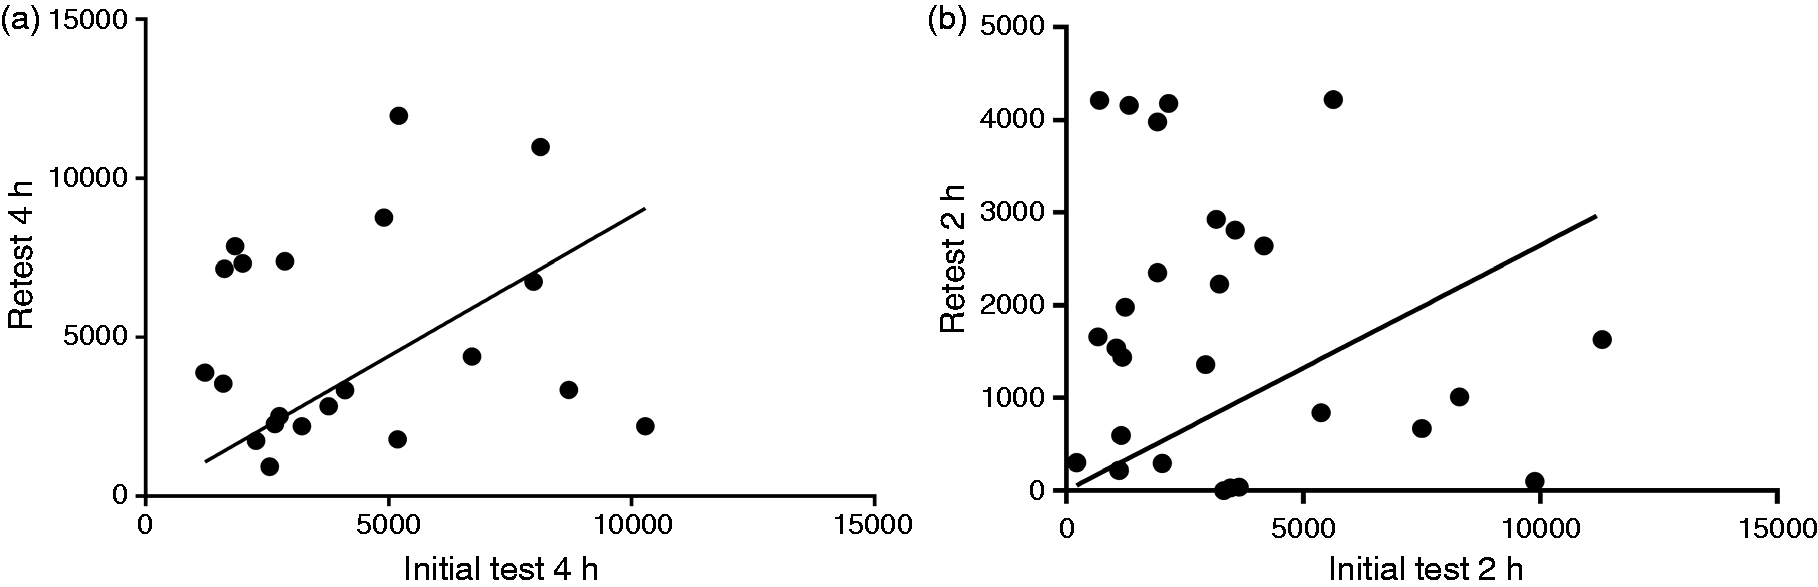
Median time of first hydrogen rise at initial testing was 75 (40–90) min. On re-test there was ≥ 50% change in nine (43%) patients. No correlation was seen in time of first rise between the two tests (r=0.14, p=0.54; Spearman's correlation). The change in the time of first rise after lactulose between repeated tests was inversely correlated with the change in hydrogen AUC (Figure 2(a)).
Comparison of the change in oro-cecal transit time with the change breath hydrogen production (shown as area under the curve (AUC)) after (a) 15 g lactulose or (b) 35 g fructose. A decrease in oro-caecal transit time (OCTT) was significantly correlated with increased hydrogen production (Spearman's r=–0.41; p = 0.09 for lactulose; r=–0.47, p = 0.05 for fructose).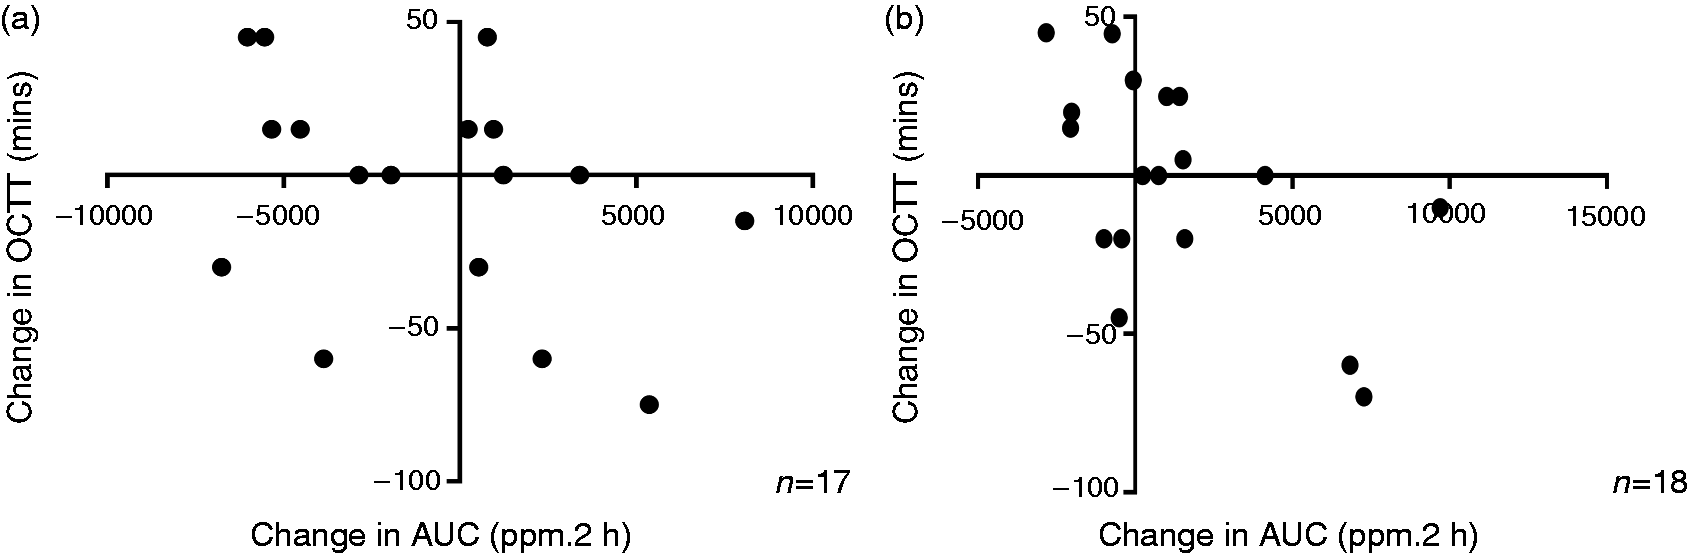
The median peak hydrogen level after lactulose ingestion was 30 (24-43) ppm on the index test and this increased by 50% (15 (–34–15) ppm) upon re-test. Peak breath hydrogen levels were not significantly correlated between the index and re-test (r = 0.07, p = 0.77; Spearman's).
Fructose breath testing
Of 30 subjects with positive tests for fructose malabsorption, nine (30%) lost their positive response upon retest over 2 h (p = 0.0006; Fisher's exact). When analysis was restricted to data from 3 h of testing, the results remained statistically significant with fructose malabsorption being lost in 8/30 (27%) participants (p = 0.005). For the subgroup of patients who completed lactulose and a subsequent fructose breath test (n = 17), the time of first rise after lactulose was not different between those with retained (75 (45–97) min) or lost (60 (45–75) min) a positive fructose response (p = 0.64, Mann–Whitney) on re-test.
Figure 1(b) shows the relationship for hydrogen AUC between index and re-test for 26 subjects with complete data at 2 h. Median hydrogen AUC was 3276 (1770–5445) ppm 2 h at index test and this changed by –1210 (–3740–545) ppm.2 h during re-test. Intra-individual AUC values between test and re-test were not correlated (r = −0.001; p = 0.99; Spearman's). Similarly, regression analysis showed that hydrogen response to fructose in the index test accounted poorly for hydrogen responses in the re-test (p = 0.17).
The median time of first hydrogen rise after fructose was 40 (30–45) min for the index and 40 (30–60) min for re-test. Only three of 26 participants (12%) produced the same time of first rise on both tests. No correlation was seen in time of first hydrogen rise between the two tests (r = −0.87; p = 0.71; Spearman's). The change in the time of first rise of hydrogen after fructose between repeated tests inversely correlated with changes in hydrogen AUC between tests for fructose (Figure 2(b)). Analyses were repeated for those with complete data at 3 h and no correlations were found between tests for either time of first hydrogen rise or AUC responses (data not shown).
The proportion with fructose malabsorption who failed to demonstrate the same status at re-test was similar (p = 0.71) whether the test interval was short (5/16; 31%) or long (4/14; 29%). Changes in hydrogen AUC between test-retest and the length of time to complete the breath test did not correlate (r = −0.05; p = 0.82, Spearman's). Time was not a predictor of hydrogen production changes on regression analysis (r = 0.11; p = 0.60).
Relationship between gastrointestinal symptoms and fructose breath test results
Of the 36 subjects who completed symptom diaries at the time of fructose breath testing, 50% (n = 18) had fructose malabsorption. Figure 3 shows changes in overall and individual symptom scores for the VAS. A comparison of breath test symptom response within individuals demonstrated a greater increase in VAS score for overall symptoms in those with a positive fructose breath test (22.9 (10.7–35.2) vs 47.4 (32.7–62.1); p = 0.001), which was not seen in those with a negative breath test (21.3 (10.3–32.4) vs 27.7 (17.9–37.5); p = 0.17). There was an increase in VAS scores for abdominal pain, bloating and wind within the positive test group, but these were not significant following Bonferroni corrections (adjusted p-value>0.004). However, when symptom scores post-test were corrected for baseline, the changes in individual symptoms were not statistically different regardless of their fructose malabsorption status. Mean change in the severity of overall symptoms was greater when fructose malabsorption was present (24 (11–38)) vs absent: (6 (–3–16); p = 0.03), although this was not statistically significant when corrected for multiple comparisons. No differences in individual symptoms were observed when rated using the Likert scale (data not shown). Using the Likert composite score, there was no difference in median symptoms whether fructose malabsorption was present or not (2 (1.7–4.3) vs 1.5 (0.7–2.3); p = 0.12).
Changes in symptom scores according to the visual analogue scale for those with and without fructose malabsorption. *This difference was not statistically significant after adjusting for multiple comparisons using Bonferroni's correction, adjusted p-value=0.004. No significant differences were observed for the other symptoms (unpaired t-test).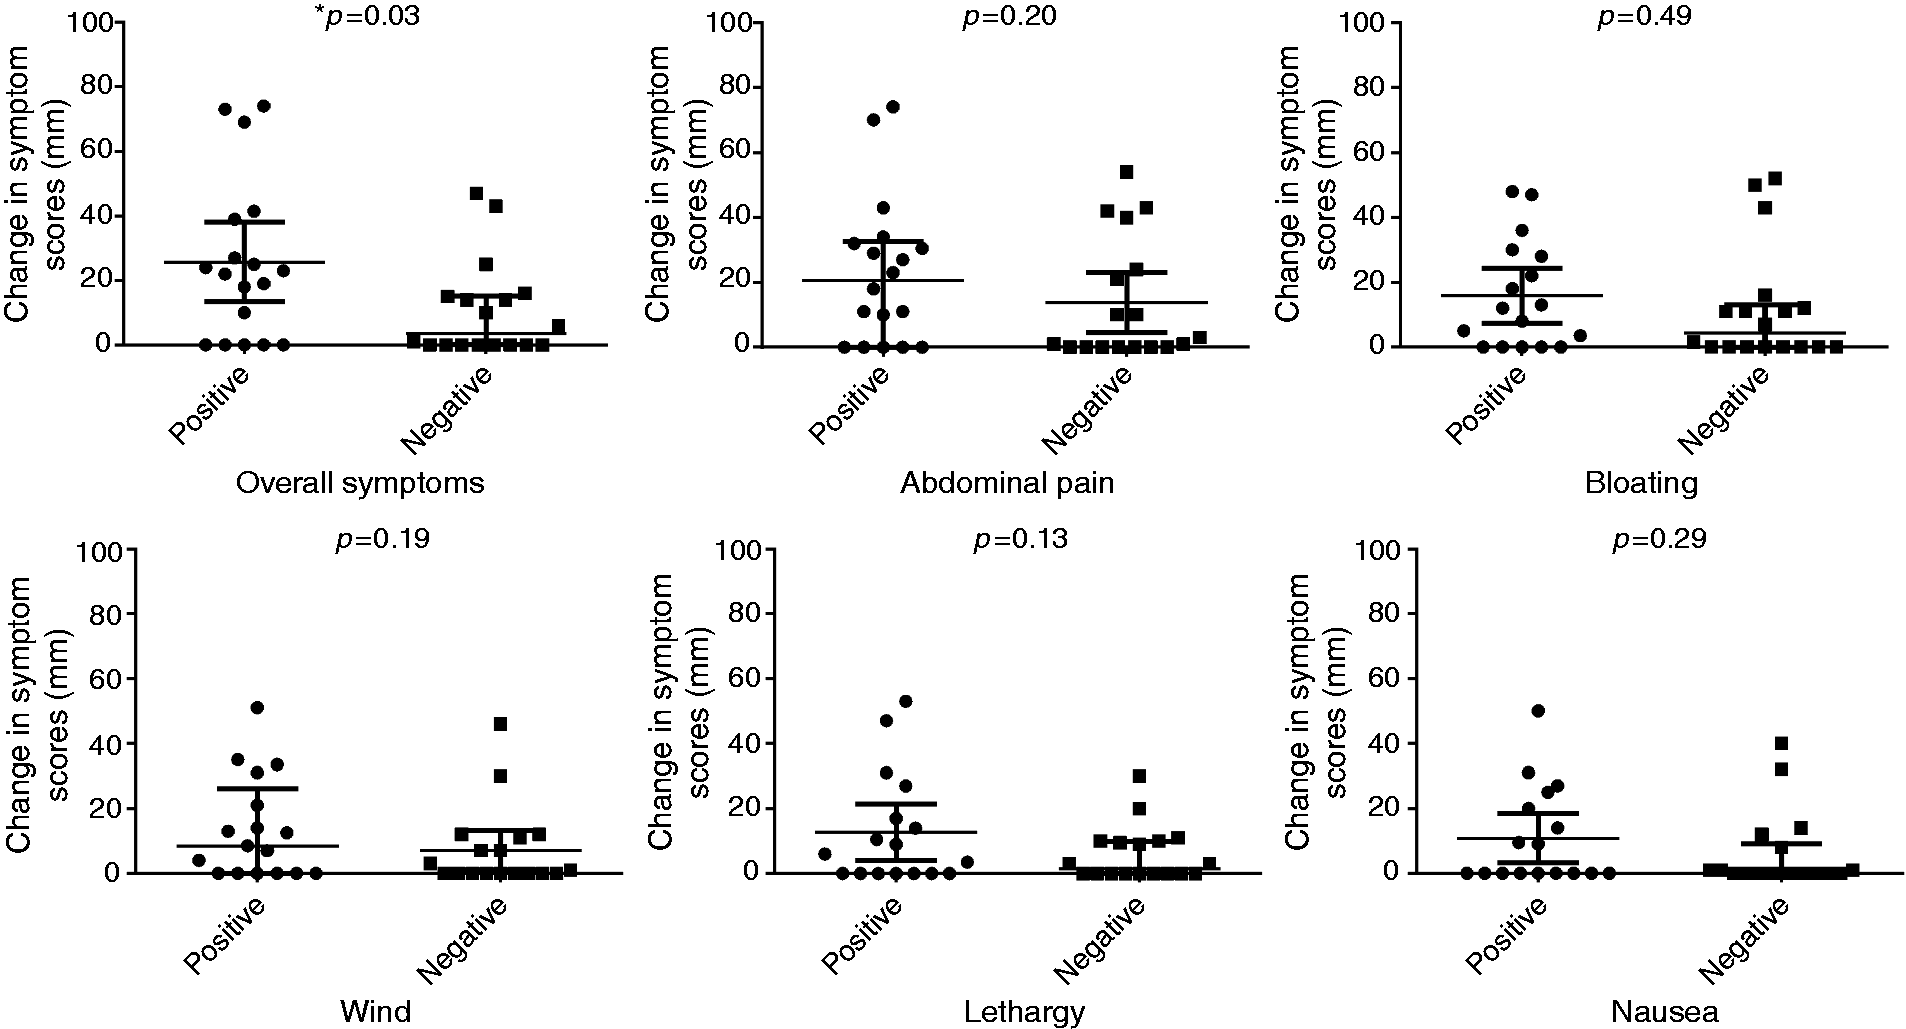
Since symptoms are usually reported categorically as positive or negative in association with fructose breath test outcomes in clinical practice, the proportion reporting worsening of overall symptoms was greater in those with fructose malabsorption than those without using arbitrary cut-off values for VAS (10 (56%) vs 3 (17%); p = 0.04) and for the Likert scale (7 (39%) vs 1 (0.06%); p = 0.04).
The frequency of reporting symptoms was inversely related to the time of first breath hydrogen rise. Thus, for ≤ 60 min, 70% developed an increase in symptoms compared to 30% in those where the time of first hydrogen rise was >60 min. However, the time of first hydrogen rise did not predict likelihood of symptoms in those with or without fructose malabsorption (Figure 4).
Comparison of the prevalence of individuals reporting symptoms across different oro-caecal transit times after consumption of fructose. Comparisons across the groups were computed using chi-square analysis. Where + ve is shown, this indicates positive response or worsening of symptoms; –ve indicates negative response or absence of symptoms.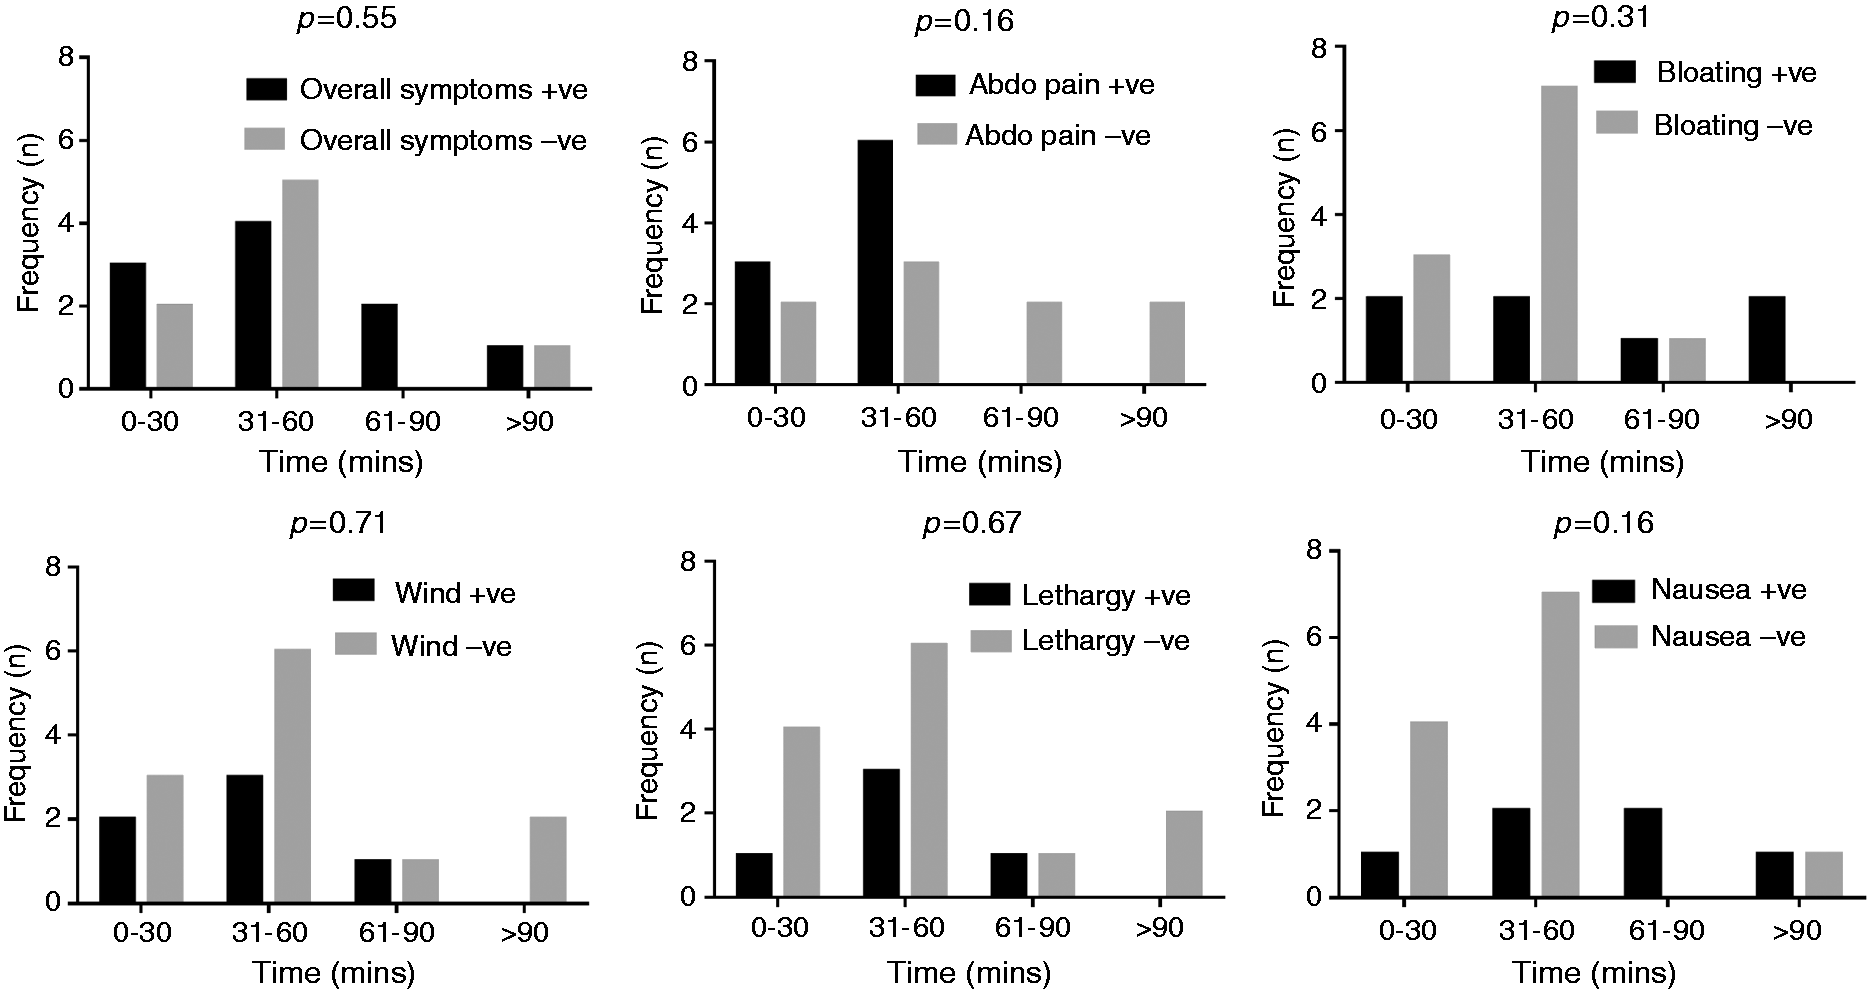
Discussion
Breath testing has been popularised as a simple, non-invasive measure of carbohydrate malabsorption. Findings at one point in time are then used to define an individual's physiology to inform therapy such as for SIBO or designing dietary manipulation. However, evidence of reproducibility is scant, particularly where test-re-test reliability is assessed with the same test conditions. Most studies have instead compared responses with changed conditions such as following modifications with diet 16 and antibiotics. 17 Results from the current study show that large variations in breath hydrogen response to lactulose and fructose can occur with repeated testing independent of any interventions. In addition, the use of breath results linked with symptom induction to define the role of a sugar in symptom genesis appears flawed. Thus, the clinical use of results generated by lactulose and fructose breath hydrogen tests is highly questionable.
The results of lactulose breath testing have been used to inform several physiological aspects in clinical practice. First, as a measure of an individual's hydrogen-producing capacity, this qualitative assessment seems reliable with only 4% changing their production. This is in agreement with Corraza et al., 18 who found a false negative rate of 20% in subjects repeating a lactulose test within three months. Secondly, the amount of hydrogen produced after lactulose has been used to semi-quantify the subsequent degree of fructose malabsorption. 19 However, our findings combined with those of two other test-re-test reliability studies20,21 in healthy controls have demonstrated large coefficient values in measurements of breath hydrogen measures following repeated lactulose challenges within a short interval, testifying against the accuracy of using such quantitative estimates. Thirdly, the timing of the first breath hydrogen rise has been used as a marker of SIBO.17,22 A previous study utilising concurrent scintigraphic assessment of lactulose entering the caecum indicated that this index reflects oro-caecal transit rather than SIBO. 23 We recently reported that, in patients with an early breath hydrogen rise, considerable variation of this response occurred over time independent of manipulations to diet or medications that alter gut bacteria 12 and the poorly reproducible results in this study support that view. The implications of these findings are that the lactulose breath test has significantly flawed characteristics affecting the guidance of a diagnosis or eradication of SIBO, but that it may perhaps have a role in qualitative assessment of hydrogen production.
Reasons for such variation in lactulose breath hydrogen responses are only partly understood. Small intestinal transit is a major factor in determining the time for the arrival of lactulose in the caecum and can be accelerated by an increased volume of liquid, with lactulose being faster than fructose in small bowel transit time, or anxiety related to breath tests in the irritable bowel syndrome population.24,25 The finding that the time of first breath hydrogen rise correlated negatively with subsequent hydrogen AUC suggests that the lactulose is being dumped in relatively higher concentrations into the caecum within a shorter time. What is more convincing is that variations in the amount of hydrogen produced is related to the differences in the hydrogen disposal pathways such acetatogenesis, methanogenesis or sulfate reduction. 26 Differences in hydrogen production might also relate to differences in the structure of microbiota over time, influenced by changes in diet and endogenous factors. However, even when the tests were performed in close proximity while consuming a stable diet, variations in AUC for hydrogen occurred. It is possible that a longer pre-test dietary period restricting fibre and fermentable carbohydrates may be needed to stabilise the microbiota but is impractical for a patient undergoing such tests in clinical practice.
Fructose malabsorption is defined as incomplete absorption of a given dose of fructose in the small intestine and hence, ‘spillover’ into the large intestine occurs. The subsequent fermentation in the microbiota-rich large intestine and its associated gas formation will add to the osmotic action, increasing water delivery to the intestinal lumen, as well as fermentation in the large intestine, increasing gas. Hence ‘fructose intolerance’ may occur if this distention leads to gastrointestinal symptoms. 27 The use of fructose breath hydrogen test as a ‘diagnostic tool’ for fructose malabsorption was demonstrated in the present study to be poorly informative for simplifying dietary management of functional gastrointestinal symptoms. Marked variations in breath responses were occurring independent of time between testing. Reasons for such variations are likely to lie with changes in the functional capacity of the microbiota or presence of psychostressors as outlined above. However, factors that predict the completeness of fructose absorption in the small intestine, primarily the amount of time available for that absorption to occur, are also likely to be important. This was well demonstrated by the close correlation of oro-caecal transit time after fructose and the presence of fructose malabsorption.
Important in the value of identification of fructose malabsorption is its relationship to symptom generation, which has been questioned by clinical observations. In the literature, 20% of 1372 patients with functional gut symptoms reported symptoms with a negative breath test for fructose and lactose, 28 whilst another study of 2390 patients reported 7% being symptomatic despite a negative fructose breath test. 29 Additionally, only a weak agreement between a positive breath test and symptoms was observed in patients with gastrointestinal symptoms undergoing a fructose breath hydrogen test. 30 Observations with other slowly absorbed short-chain carbohydrates, sorbitol and mannitol, showed no correlation between symptom genesis and malabsorption at breath hydrogen testing. 31 Consistent with these observations, symptoms during a fructose breath test did not correlate with clinical response to dietary restriction of fructose in patients with abdominal pain. 32 In the current study, however, we did find a greater proportion of patients with fructose malabsorption reported worsening of symptoms and this was mirrored by a greater increase in overall symptom severity but not other symptoms in patients with rather than those without fructose malabsorption. As discussed above, mechanistic observations of marked expansion of small intestinal water content independent of fructose malabsorption suggests that symptoms following fructose ingestion might be more related to small intestinal distention. 27
This study has limitations. The use of two-hour data as opposed to three- or four-hour data may have increased the likelihood of false-negative results. 31 However, our data showed that only two participants changed from a negative to positive hydrogen response to fructose using the three-hour data. The duration of the interval between the first and subsequent test in the ‘long-term’ cohort was > 19 weeks during which the use of drugs or dietary factors may have altered the intestinal microbiota. Data from these participants were still included to reflect real-life practice. As reported, the timing of these tests, whether extended or short, had negligible effect on the marked variability in breath responses, consistent with findings from Jonderko et al. 21 Symptom data were only collected for the breath test period and no data were collected for the remainder of the day to capture delayed symptoms. This may have resulted in an underestimation of the frequency of symptom development, but does increase its specificity. 34 The use of ≥ 10 ppm rise in hydrogen as the cut-off to denote a positive result is an additional limitation of this study. Although uniform criteria for both cut-off values and dosage of sugar tested have been suggested, these have largely been based upon expert opinion only and, in reality, clinical practice sees considerable variation used, which is likely to have a significant outcomes on individual results.35,36
In conclusion, this study has highlighted the poor reproducibility of lactulose and fructose breath testing, as well as the poor correlation of these test outcomes with symptoms induced from these sugars. As such, these results do not support the routine use of lactulose or fructose breath hydrogen tests to ‘diagnose’ or identify causative factors underlying gastrointestinal symptom induction in patients with functional bowel disorders or to support their role in decision-making for treatment pathways for the patient. It is vital that clinicians are aware of the shortcomings of the reproducibility of breath hydrogen breath testing after lactulose or fructose. A result at any one point in time will not necessarily reflect the individual's inherent physiology, but rather the physiology at the time of testing, which may be influenced by factors including anxiety. 25 Instead, patients with irritable bowel syndrome with symptoms attributable to fructose would still benefit symptomatically from dietary restriction of all FODMAPs, regardless of their fructose malabsorption status. This should then be followed by gradual reintroduction of fructose (and other FODMAPs) preferably under the guidance of a specialist dietician to assess for long-term tolerance and liberalisation of the diet whilst symptom control is maintained. The findings do not negate the use of such testing in the setting of clinical trials where results can be interpreted within these limitations.36,37 Furthermore, the findings cannot be extrapolated to glucose or lactose breath tests where the setting and interpretation of the results are very different.
Footnotes
Acknowledgements
The authors would like to thank Greg Yelland for statistical expertise and support provided for the study. CKY and CJT contributed equally to this work. CKY, CJT, KC and HLP were involved in the collation of data for analysis. CKY, CJT, PRG and JSB were involved in statistical analysis of the data. CKY, CJT and PRG wrote the manuscript. All authors were involved in the revision of the manuscript and approval of its final form for publication.
Declaration of conflicting interests
None of the authors have any conflicting interests in relation to this research.
Funding
This work received research support in part from Yakult Australia Ltd Pty and Fonterra ™Australia.