
Abstract
Background
Response Evaluation Criteria In Solid Tumors (RECIST) are known to have limitations in assessing the response of colorectal liver metastases (CRLMs) to chemotherapy.
Objective
The objective of this article is to compare CT texture analysis to RECIST-based size measurements and tumor volumetry for response assessment of CRLMs to chemotherapy.
Methods
Twenty-one patients with CRLMs underwent CT pre- and post-chemotherapy. Texture parameters mean intensity (M), entropy (E) and uniformity (U) were assessed for the largest metastatic lesion using different filter values (0.0 = no/0.5 = fine/1.5 = medium/2.5 = coarse filtration). Total volume (cm3) of all metastatic lesions and the largest size of one to two lesions (according to RECIST 1.1) were determined. Potential predictive parameters to differentiate good responders (n = 9; histological TRG 1–2) from poor responders (n = 12; TRG 3–5) were identified by univariable logistic regression analysis and subsequently tested in multivariable logistic regression analysis. Diagnostic odds ratios were recorded.
Results
The best predictive texture parameters were Δuniformity and Δentropy (without filtration). Odds ratios for Δuniformity and Δentropy in the multivariable analyses were 0.95 and 1.34, respectively. Pre- and post-treatment texture parameters, as well as the various size and volume measures, were not significant predictors. Odds ratios for Δsize and Δvolume in the univariable logistic regression were 1.08 and 1.05, respectively.
Conclusions
Relative differences in CT texture occurring after treatment hold promise to assess the pathologic response to chemotherapy in patients with CRLMs and may be better predictors of response than changes in lesion size or volume.
Introduction
Approximately 20% of patients with colorectal cancer develop metastatic disease, the majority of which (±60%) are in the liver. Surgical resection is most effective in achieving long-term survival.1–3 Systemic chemotherapy is mainly given to those patients who present with initially unresectable metastases that may potentially become resectable in case of a good response to treatment. 4 After surgery, histological tumor regression grading (TRG) quantifies the response of the metastases to chemotherapy. Furthermore, TRG is a prognostic factor for survival. 5
Prior to surgery, response is typically mainly assessed using Response Evaluation Criteria In Solid Tumors (RECIST 1.1), which measure changes in the longest axial tumor diameters. 6 These size measurements may, however, not be representative for the true tumor volume, since tumors often tend to have irregular shapes, particularly after treatment. Moreover, correlation between RECIST and pathologic response is known to be limited.7,8 Volumetric measurements may overcome certain disadvantages of RECIST.9–11 Both RECIST and tumor volume measures do not take into account the spatial heterogeneity of tumor lesions, which has been suggested to correlate with tumor biology and treatment resistance. 12 Computed tomography (CT) texture analysis is a new approach to quantify tumor heterogeneity. It refers to a mathematical approach to evaluate gray-level intensity variations within a region of interest (ROI). 13 Studies of different tumor types have demonstrated that CT texture analysis can benefit diagnosis, staging, and therapy response assessment and may even be used as a prognostic biomarker for survival.14–19
The aim of our study was to assess the potential of CT texture analyses of colorectal liver metastases (CRLMs) before and after chemotherapy to differentiate between patients showing a good and poor response to treatment using the tumor regression grade (TRG) at histopathology after surgery as the standard of reference. Our second aim was to compare the results of CT texture with tumor size measurements derived from RECIST 1.1 and to volumetric tumor measurements.
Materials and methods
Patients
This study retrospectively evaluated 21 consecutive patients diagnosed with colorectal liver metastases and stratified for preoperative chemotherapy at our institution between 2006 and 2010. All patients underwent CT as part of their routine diagnostic workup. According to national law in The Netherlands (as described by the central committee on research involving humans), retrospective studies are not subject to the Medical Research Involving Human Subjects Act and informed consent was not required. Inclusion criteria consisted of (a) histopathologically confirmed colorectal adenocarcinoma; (b) presence of hepatic metastases (with at least one lesion measuring >1 cm in longest diameter), without evidence of other extrahepatic metastases; (c) treatment consisting of preoperative chemotherapy followed by metastasectomy/hepatectomy; and (d) availability of pre- and post-chemotherapy CT examinations (portal venous phase (PVP)). The preoperative chemotherapy regimen consisted of capecitabine plus oxaliplatin (XELOX) with (n = 15) or without (n = 6) the addition of bevacizumab.
CT acquisition
Contrast-enhanced CT of the liver was performed as part of the routine liver/abdomen CT protocol. Imaging was performed using either a 16-slice or a 64-slice multi-slice computed tomography (MSCT) scanner (Siemens Somatom Sensation16, Siemens AG, Erlangen, Germany; Toshiba Aquilion 16, Toshiba Medical Systems, Tokyo, Japan; Philips Brilliance 16 or 64, Philips Medical Systems, Best, The Netherlands). Four-phase contrast-enhanced CT was obtained for primary evaluation and single PVP for post-treatment evaluation. PVP images were routinely acquired 70 seconds after contrast injection. Slice thickness was 3 mm.
Imaging assessment
All measurements were performed on the PVP images acquired before and after chemotherapy. Measurements were performed by a single radiologist with two years’ specific experience in abdominal imaging (FA). According to RECIST 1.1,
6
one (in case of a solitary metastasis) or two solid-appearing metastases measuring >1 cm in diameter were selected as target lesions and their largest diameter was measured. In case of two selected lesions, the sum of the largest diameters was calculated and used for further analyses. To determine the total metastatic tumor volume, the same radiologist manually traced the tumor boundaries by placing free-hand ROIs around all visible metastases on the axial images, excluding the edge of the liver and the major vessels to avoid partial volume artifacts. This provided the cross-sectional area for each tumor-containing section (Figure 1). Lesion volume was then calculated for each lesion by multiplying the cross-sectional tumor area by the slice thickness. Total metastatic volume was calculated as the sum of the volumes of the individual lesions. The relative (%) decrease in size (Δ size) and total tumor volume (Δ volume) was calculated according to the following formula: ΔX = 100 × (Xpre − Xpost)/Xpre, where Xpre is pre-chemotherapy size/volume and Xpost is post-chemotherapy size/volume.
Representative example of a computed tomography (CT) slice showing the one-dimensional tumor size measurements (arrow) and delineation of regions of interest (ROIs) that provided the sectional tumor area (circle) for calculation of the tumor volume of all metastatic lesions combined in a patient pre- (a) and post-chemotherapy (b). The same ROIs were used to calculate the texture parameters (mean intensity, entropy and uniformity) from the largest available metastatic tumor lesion.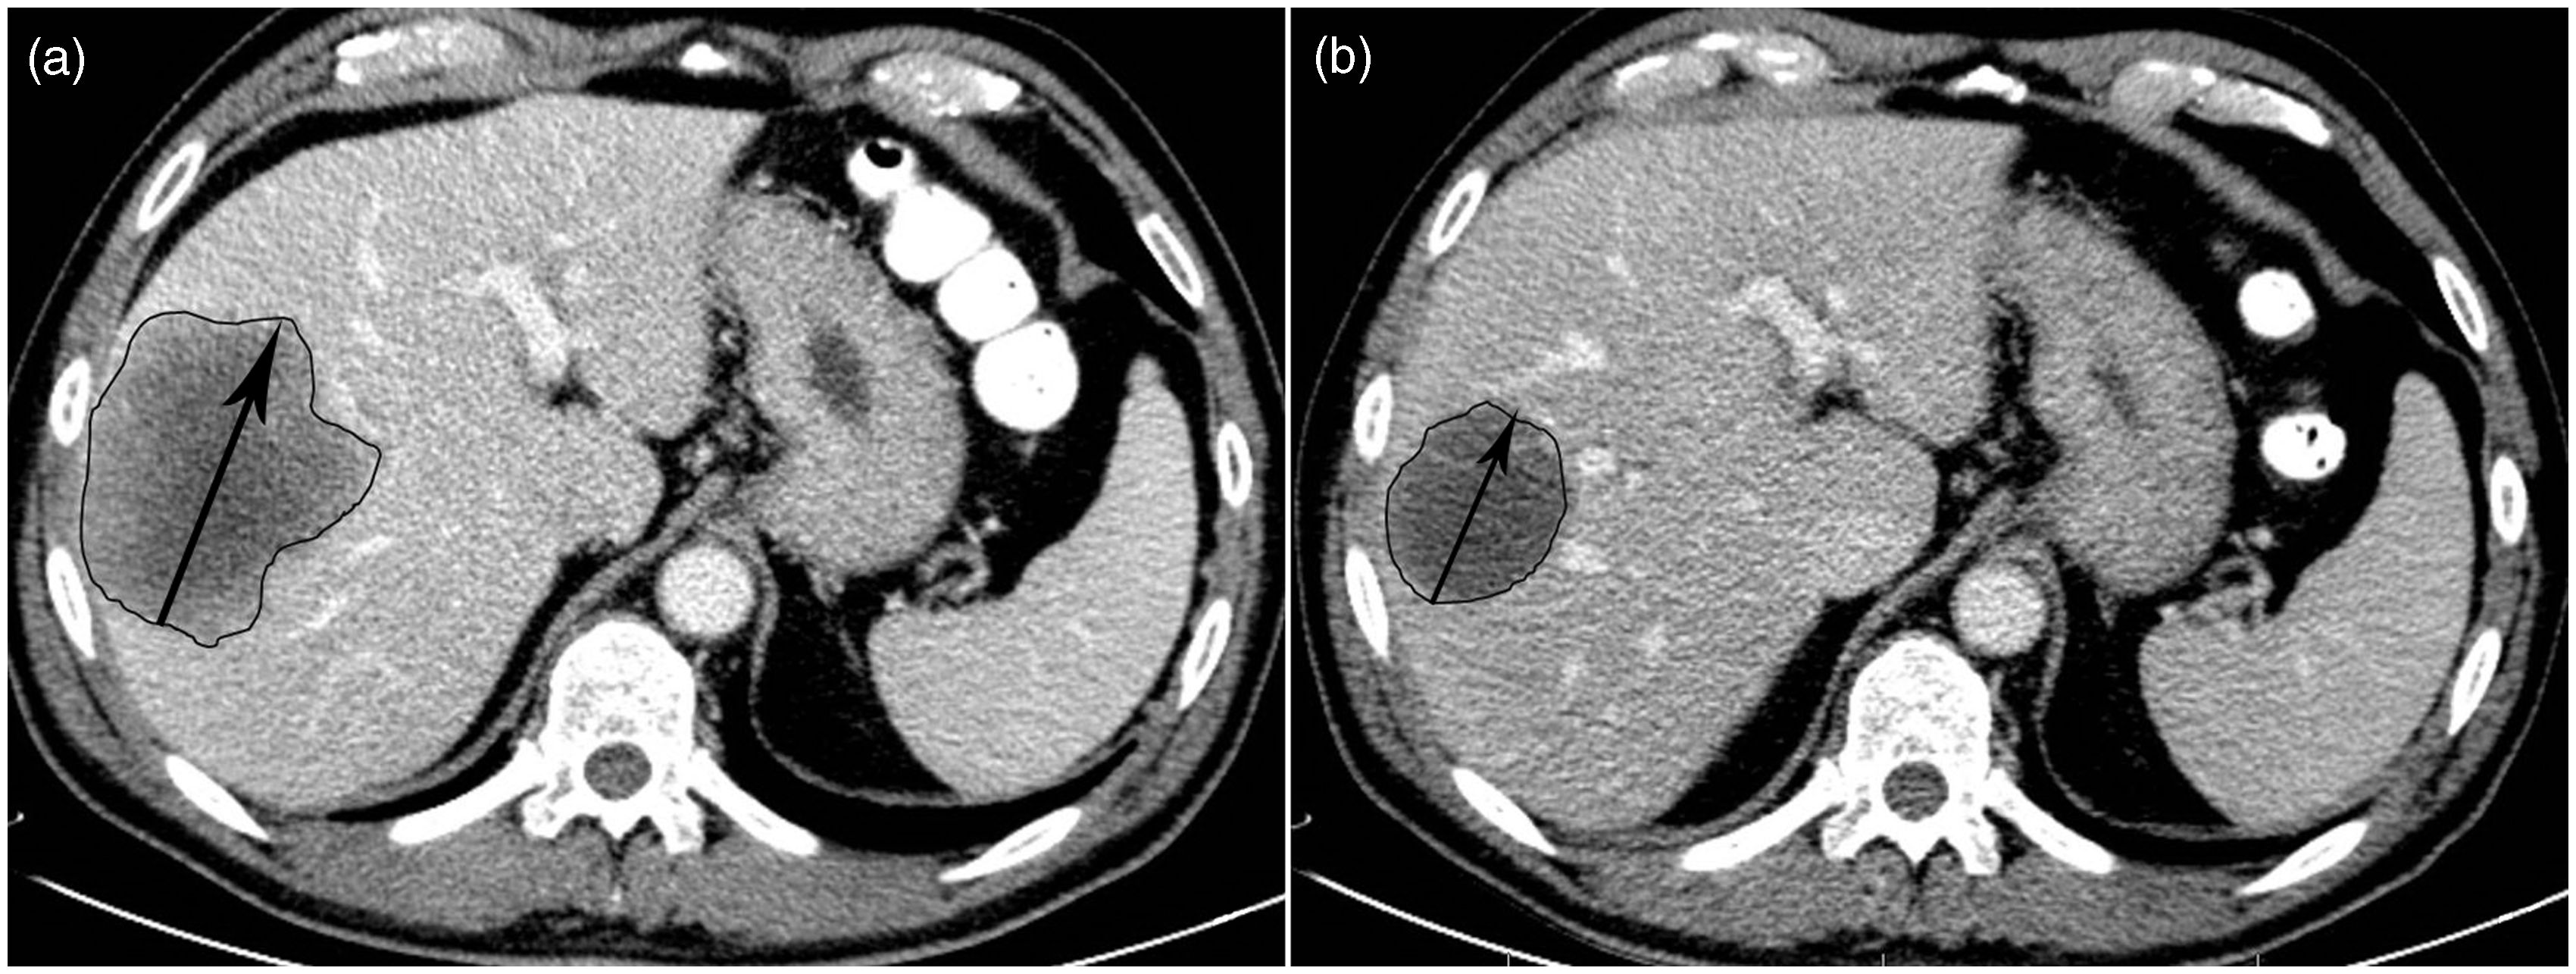
Texture analyses
Images were transferred to an offline workstation. Texture analyses were performed using a dedicated script written in MATLAB (MathWorks Inc, Natick, MA, USA) by one of the authors (RSS). For each patient the texture of the largest metastatic lesion was assessed using the previously determined volumetric ROIs. The mathematical technique used was according to a previous report.
20
It comprised two main stages: (a) image filtration and (b) quantification of texture. For image filtration, a Laplacian of Gaussian (LoG) band-pass filter was applied to the ROI using no filtration (0.0) and sigma (σ) values of, 0.5 (fine scale), 1.5 (medium scale) and 2.5 (coarse scale). For the various filtrations, the following parameters were determined: mean grey-level intensity (M), entropy (E) and uniformity (U). All the voxels within the ROI were used to make a histogram with a bin size of 1 HU. From this histogram the parameters were calculated using:
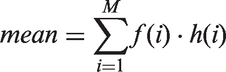
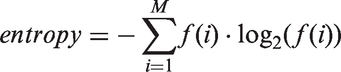
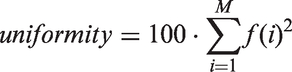
In this equation M is the number of bins in the histogram, f(i) the fraction of the voxels in the ROI in bin number i of the histogram and h(i) the HU value of bin i. The relative (%) change in the texture measures (ΔT) was calculated according to the following formula: 100 × (Tpre − Tpost)/Tpre, where Tpre and Tpost represent the various pre- and post-chemotherapy tumor measures, respectively.
Standard of reference
Histopathological evaluation of the surgical resection specimens served as the standard of reference. TRG was scored for each metastatic lesion according to methods described in previous reports.5,21 The overall response for each patient was categorized as good responder (all lesions scored as TRG 1–2) or poor responder (one or more lesions scored as TRG 3–5). This dichotomization was determined before onset of the study.
Statistical analyses
Statistical analyses were performed using the Statistical Package for the Social Sciences, version 22.0 (SPSS Inc, Chicago, IL, USA). First, univariable logistic regression analysis was performed to identify which of the pre-, post- and Δ% measures of size, volume and texture had potential predictive value to discriminate between good/poor responders as the dependent outcome. Factors were considered significantly predictive when p < 0.05 to allow stringent selection of the best predictive factors given the large number of variables under evaluation. Subsequently, multivariable analysis was performed with the different predictive factors identified in the univariable analysis together with the location of the primary tumor (colon or rectum) and lesion size (according to RECIST) as independent covariables and good vs. poor response as the dependent outcome. Tumor location and lesion size were chosen as covariables as rectal tumors are associated with worse prognosis compared to colon tumors, and lesion size is the most commonly used measure in clinical practice to assess response. To explore whether bevacizumab is a potential confounder, a subgroup analysis was performed in the patients who received bevacizumab. For the multivariate analysis factors were considered predictive when p < 0.20. 22 Diagnostic odds ratios (ORs) with 95% confidence intervals (CIs) were recorded.
Results
Patients and treatment characteristics
Patient and treatment characteristics
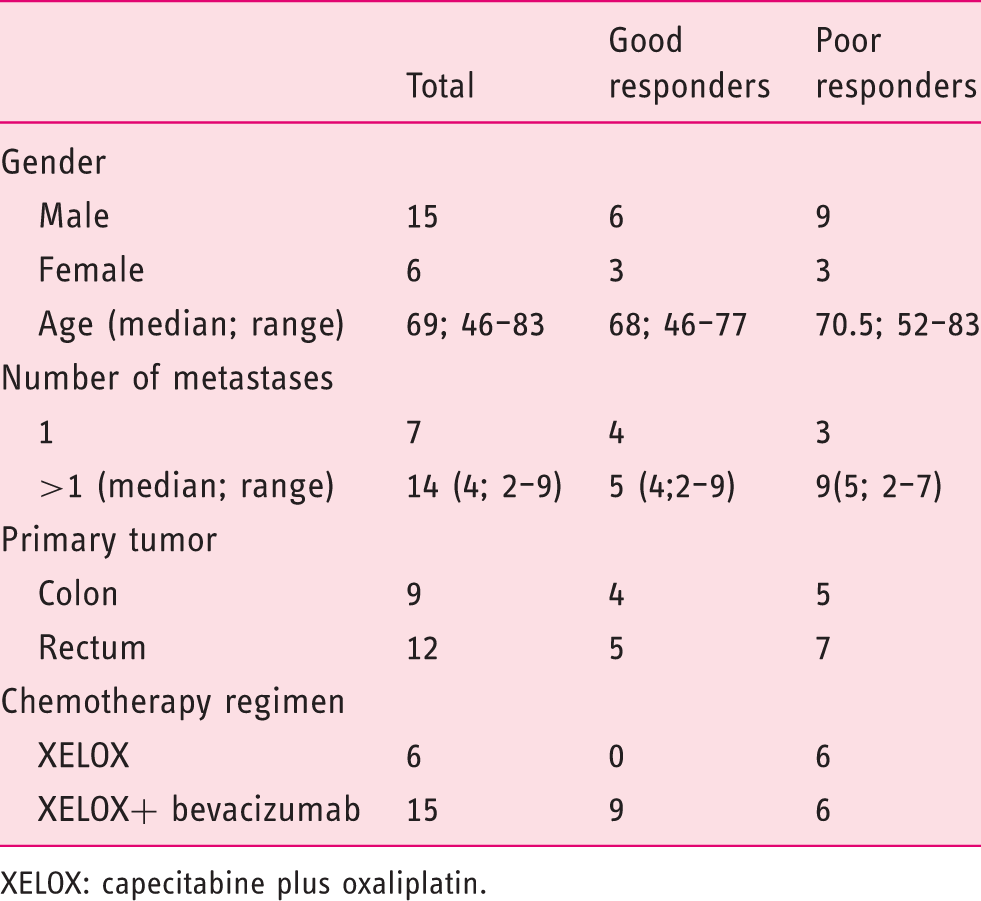
XELOX: capecitabine plus oxaliplatin.
Tumor size (RECIST) and volume measurements
Mean and differences in pre-, post-treatment and Δ measurements in one-dimensional size measurements and total volume between good responders and poor responders according to histopathology (TRG 1–2 vs. TRG 3–5) as the outcome
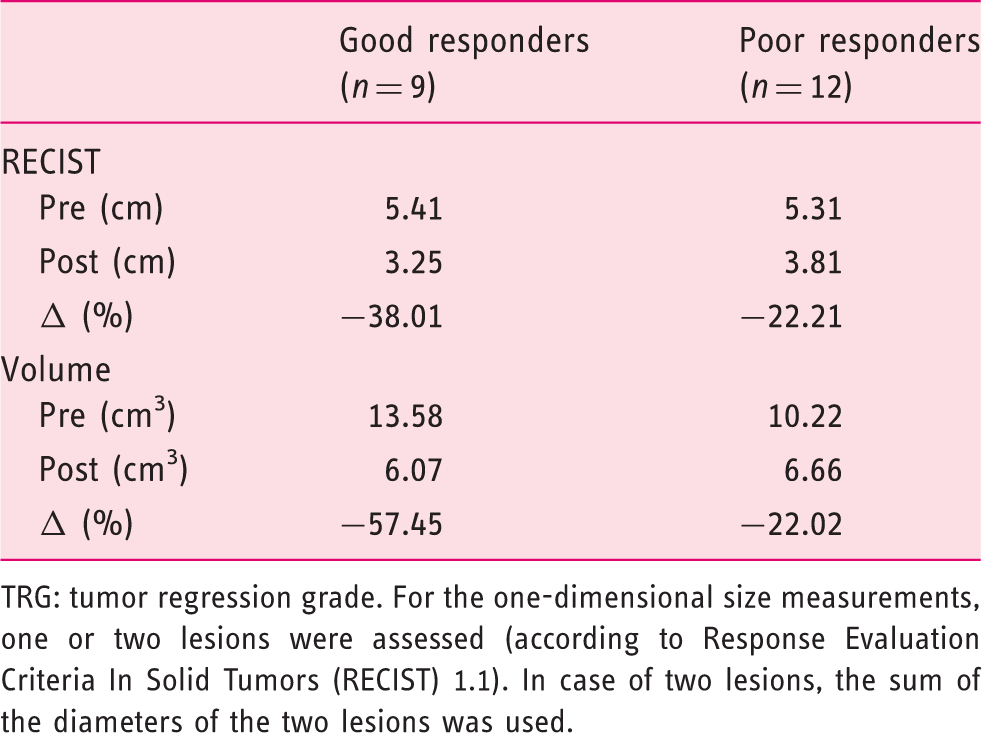
TRG: tumor regression grade. For the one-dimensional size measurements, one or two lesions were assessed (according to Response Evaluation Criteria In Solid Tumors (RECIST) 1.1). In case of two lesions, the sum of the diameters of the two lesions was used.
Texture analyses
Mean values and differences in pre-, post-treatment and Δ measurements for the intensity and texture measures between good responders and poor responders according to histopathology (TRG 1–2 vs. TRG 3–5)
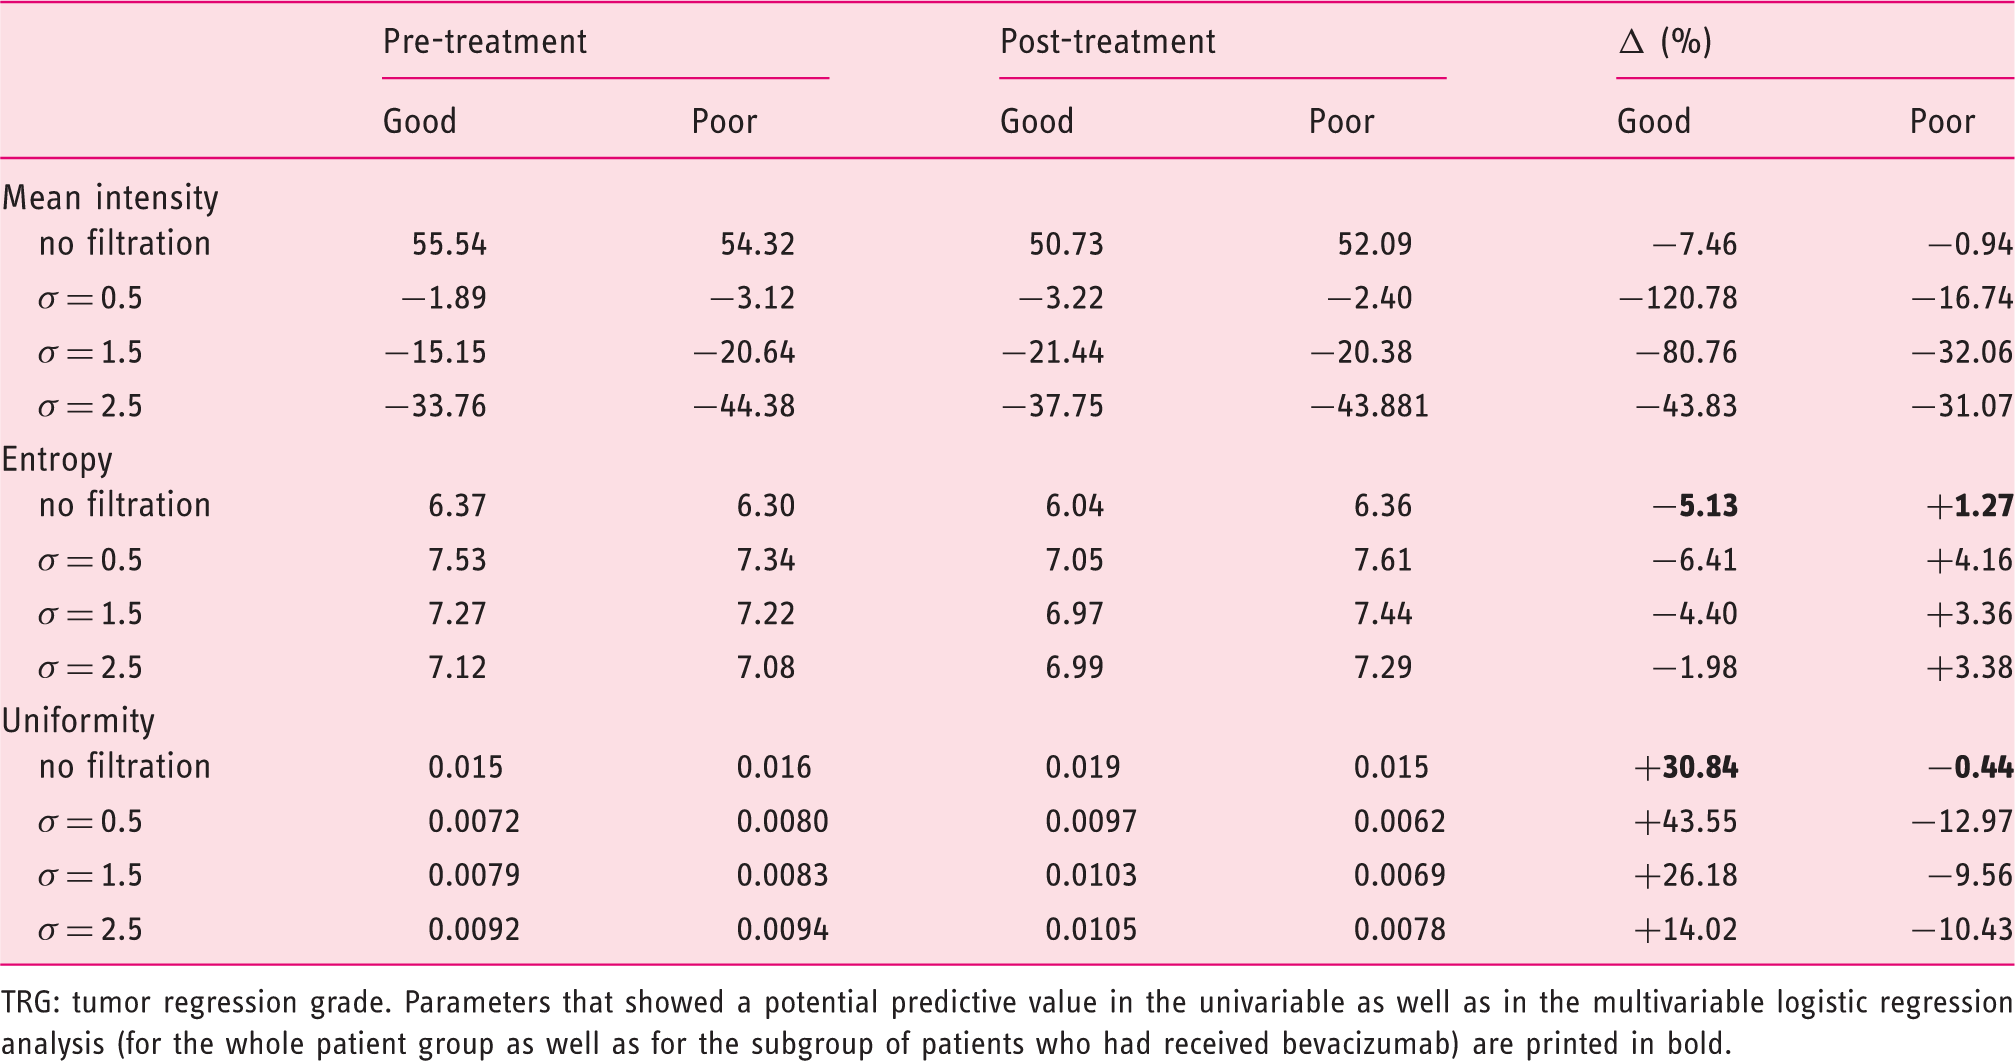
TRG: tumor regression grade. Parameters that showed a potential predictive value in the univariable as well as in the multivariable logistic regression analysis (for the whole patient group as well as for the subgroup of patients who had received bevacizumab) are printed in bold.
Discussion
The relative changes after chemotherapy (Δ%) of the texture parameters entropy and uniformity without filtration were significant predictors to differentiate between a good response (TRG 1–2) and poor response (TRG 3–5) after chemotherapy. Diagnostic ORs were 0.95 for Δuniformity and 1.34 for Δentropy. ΔSize and Δvolume were not significant predictors and resulted in ORs of 1.08 and 1.05, respectively, indicating that texture parameters may be better discriminators of response compared to size and volume measurements.
The poor results for size measurements (derived from RECIST 1.1) are consistent with previous reports. Egger et al. reported that RECIST criteria could not predict residual viable tumor burden after chemotherapy in patients with CRLMs. 7 In contrast to our results, in their study CT volumetry showed a better correlation with pathology. It has previously been suggested that size-based measurements are limited in assessing response and that additional criteria such as the density, enhancement pattern and the tumor-liver interface of metastatic lesions may provide better results to predict outcome.23–25 Such criteria, however, remain subject to interpretation differences 23 and do not provide a quantifiable measure of response. To better understand how therapy-induced changes may be captured by imaging, we need to gain better insight into the internal tumor structure. In the current study, we aimed to quantify liver structure by means of texture analyses. We found that relative changes in tumor entropy, as well as uniformity, showed the most promising results. Entropy is a measure reflecting irregularities (heterogeneity) in the gray-level distribution. This parameter is closely linked to uniformity, which is in fact an opposite measure reflecting the homogeneity of gray-level distribution. As demonstrated in Table 3, lesion uniformity increased in the good responders while correspondingly entropy decreased. In the poor responders, the opposite effect was observed. This means that metastases that respond well to treatment develop a more homogenous internal lesion structure. This makes sense, since as a result of successful treatment tumor lesions will typically be replaced by necrosis and fibrosis, whereas in poor responding lesions viable high-cellular tumor areas will remain present, either clustered or scattered throughout the lesion remnant, resulting in a more heterogeneous structure.
We could not demonstrate an obvious benefit for pre-chemotherapy texture parameters in predicting response. A possible contributing factor might be that texture measurements in our study were performed only on PVP images. Goh et al. found that pre-treatment entropy and uniformity on arterial phase images yielded predictive information on treatment response of metastatic renal cancer. 16 Texture measures have been suggested to be associated with tumor hypoxia, angiogenesis 26 and vascular permeability, 17 which affect delivery of chemotherapeutic agents. Ill-defined peripheral enhancement tends to occur on the arterial phase and fades away on the PVP. Therefore the heterogeneity of vascular supply might become more evident on arterial phase images, although this hypothesis remains to be tested in patients with CRLMs.
Our study is limited because of the small sample size (which is, for example, reflected by the wide CIs in the multivariable analyses) and its retrospective nature. Furthermore, measurements were performed by only one reader, which does not account for interobserver variations, although we feel that particularly delineation of relatively large liver metastases (as were assessed for the texture analysis) will likely be subject to little interobserver variability. Also, there was quite a wide range in the interval between the post-chemotherapy CT and surgery. Different CT scanners with different acquisition parameters were advocated, which may affect the texture measures, although a previous study has suggested that these effects will likely be limited. 18 Bevacizumab was added to the neoadjuvant treatment regimen in a subgroup of patients which may have affected the perfusion characteristics of the tumor after treatment. However, similar results were found in the logistic regression for the whole patient group as well as after exclusion of patients, who did not receive bevacizumab. Hence, we believe that the effect of bevacizumab on our study results will likely be limited. Finally, we quantified the texture for the largest visible lesion and not for all visible metastases. Ideally, response of individual lesions should be correlated to pathology. However, for this pilot study we chose to analyze one representative lesion, also because measuring very small lesions may be less accurate/reproducible. Moreover, previous studies demonstrated that in case of multiple CRLMs, the different lesions tend to show a similar response to chemotherapy.5,24
Clinical impact and conclusions
Good pathologic response of CRLMs to preoperative chemotherapy is associated with a better outcome. 7 Preoperative evaluation of response by imaging may benefit therapeutic decision making. CT texture analysis is a noninvasive technique extracting heterogeneity information from routine CT images without the need for additional acquisitions or radiation. Our results suggest that CT texture holds promise to monitor the effectiveness of chemotherapy and differentiate between patients showing a good and poor response to treatment. The current results are obviously still premature, but warrant further large and prospective patient studies.
Footnotes
Funding
This research received no specific grant from any funding agency in the public, commercial, or not-for-profit sectors.
Conflict of interest
None declared.