
Abstract
Background and objectives
Patients with liver cirrhosis are more prone to develop reduced bone mineral density (BMD), i.e. hepatic osteodystrophy (HOD). There are few data on the prevalence of HOD in the Indian population and its treatment. We aimed to determine the prevalence of HOD, factors associated with it and the impact of bisphosphonates on BMD in patients with liver cirrhosis.
Patients and methods
Consecutive patients with liver cirrhosis admitted at Sir Ganga Ram Hospital, New Delhi, between August 2012 and July 2013 were enrolled. Patients with chronic kidney disease, hyperparathyroidism and those on steroids were excluded. BMD was measured by dual-energy X-ray absorptiometry (DEXA) at the lumbar spine and femoral neck. Osteopenia and osteoporosis were defined according to WHO criteria. Ibandronic acid 150 mg per day orally for six months was given to patients with osteoporosis and DEXA scan repeated.
Results
A total of 215 patients (males 179, 83%) with a mean age of 50.9 ± 11 years were enrolled in this study. Prevalence of HOD was found to be 66% (142/215). On multivariate analysis BMI, TLC, total serum bilirubin and transient elastography values were found to be independently associated with HOD. All the patients with osteoporosis (n = 47) were treated with ibandronic acid as per protocol. Treated patients had significant improvement in DEXA scans after six months as compared to baseline.
Conclusions
HOD was seen in two-thirds of patients with liver cirrhosis. Higher liver stiffness as determined by transient elastography is significantly associated with HOD. Severity scores of liver disease (CTP and MELD) and etiology of liver cirrhosis did not determine HOD. Ibandronic acid is a safe drug that showed significant improvement in BMD in patients with liver disease along with osteoporosis.
Keywords
Introduction
Hepatic osteodystrophy (HOD) is the term coined to describe bone disease in patients with chronic liver disease. 1 It includes both osteopenia and osteoporosis. Dual-energy X-ray absorptiometry (DEXA) scan is the gold standard for diagnosing HOD. HOD is a common but overlooked problem in patients with liver cirrhosis. It is more commonly seen in cholestatic liver disease but has also been reported in non-cholestatic liver diseases. Overall prevalence of HOD ranges from 13% to 70%.1,2 The exact prevalence of HOD in non-cholestatic diseases has not been studied adequately.
The predisposing factors for HOD in liver cirrhosis patients have not been studied adequately. There are few data on the relation of severity of liver disease (Child-Turcotte-Pugh (CTP) or MELD score) and portal hypertension with HOD. Treatment of HOD in non-choleastatic liver disease has been inadequately studied.
The aims of this study were (i) to determine the prevalence of HOD in non-cholestatic chronic liver disease, (ii) to assess the predictive factors of HOD, (iii) to study the relation of severity of liver disease with HOD and (iv) to study the impact of bisphosphonates on bone mineral density (BMD).
Patients and methods
Patients
In this prospective study, all consecutive patients with liver cirrhosis attending the department of Gastroenterology and Hepatology, Sir Ganga Ram Hospital, New Delhi, between August 2012 and July 2013 were included.
Liver cirrhosis was diagnosed on the basis of clinical, biochemical and radiological features.
Patients age <18 years and >70 years, those with cholestatic liver disease, chronic renal failure, prolonged steroid use (more than three months), pregnancy, post-menopausal women, those on immunosuppressive therapy, with primary hyperparathyroidism, Cushing’s syndrome, malignancy (except hepatocellular carcinoma (HCC)) and human immunodeficiency virus (HIV) co-infection were excluded.
Baseline work-up
All patients underwent a detailed clinical assessment and relevant laboratory investigations. The investigations included a complete hemogram, renal function tests and liver function tests (LFTs) including prothrombin time (international normalized ratio (INR)). Etiological work-up for liver cirrhosis included HBsAg, anti-hepatitis C virus (HCV) antibody, antinuclear antibodies (ANA), anti-smooth muscle antibodies (ASMA), anti-liver-kidney-microsomal (LKM) antibodies, serum ceruloplasmin, and iron studies. Ultrasound was performed in all patients and triphasic computed tomography (CT) of the abdomen was conducted when there was suspicion of HCC. Upper gastrointestinal (GI) endoscopy and FibroScan were performed in all patients.
Serum calcium, phosphate, 25-hydroxyvitamin D (25-OH D), fasting thyroid profile and intact parathyroid hormone (PTH) levels were estimated in all patients. Sex hormone (free testosterone in males, estradiol and luteinizing hormone in females) were also tested.
BMD was measured by DEXA scan at two sites, i.e. the lumbar spine and femoral neck using a GE Lunar prodigy. Encore™ 2008 Software, GE Health Care system, version 12.20, was used to compute the BMD in g/cm2.
HOD was defined according to World Health Organization (WHO) criteria. T score was defined as number of standard deviations (SD) from mean BMD values of healthy young adults. Normal BMD was a T-score between + 2.5 and –1. Osteopenia was defined as a T score between –1 and –2.5 and osteoporosis was defined as a T score < –2.5.
Patients were divided into three groups on the basis of BMD: Group A had normal BMD, Group B had osteopenia and Group C had osteoporosis. All the parameters among these three groups were compared and analyzed.
Treatment
All patients with osteopenia and osteoporosis received calcium and vitamin D supplementation. Calcium was given in a dosage of 1000 mg. Vitamin D was given in a dosage of 60,000 IU per week.
Ibandronic acid (second-generation bisphosphonate) was given to the patients with osteoporosis in a dosage of 150 mg per orally once a month for six months.
Follow-up
All patients with osteoporosis were followed-up for a period of six months.
Those patients who completed six months of ibandronic acid were categorized as the treatment group. A repeat DEXA scan was performed along with relevant laboratory parameters in patients who received treatment after six months and these parameters were compared with baseline values. Any adverse effects of ibandronic acid were also recorded.
Statistical analysis
Statistical analysis was carried out using the Statistical Package for Social Sciences (SPSS, version 17.0). Normality of data was checked by measurement of skewness and the Kolmogorov-Smirnov test for normality. All quantitative variables are expressed as mean (SD) for normally distributed data and median (interquartile range (IQR)) if the data were skewed. Normally distributed data means were compared using a one-way analysis of variance (ANOVA), and if the F value was significant and variance was homogeneous, the Bonferroni multiple comparison test was used to assess the differences between the individual groups; otherwise, Tamhane’s T2 test was used. The Kruskal-Wallis test was used for those variables that were not normally distributed and further comparisons were performed using the Mann-Whitney U test. Multivariate logistic regression analysis was conducted using a stepwise method to find independent factors associated with osteopenia and osteoporosis. Qualitative or categorical variables were described as proportions. Proportions were compared by use of the chi-square test or Fisher’s exact test, whichever was applicable. For all statistical tests, a p value less than 0.05 was taken to indicate a significant difference.
Results
Baseline characteristics
Baseline clinical parameters of patients.
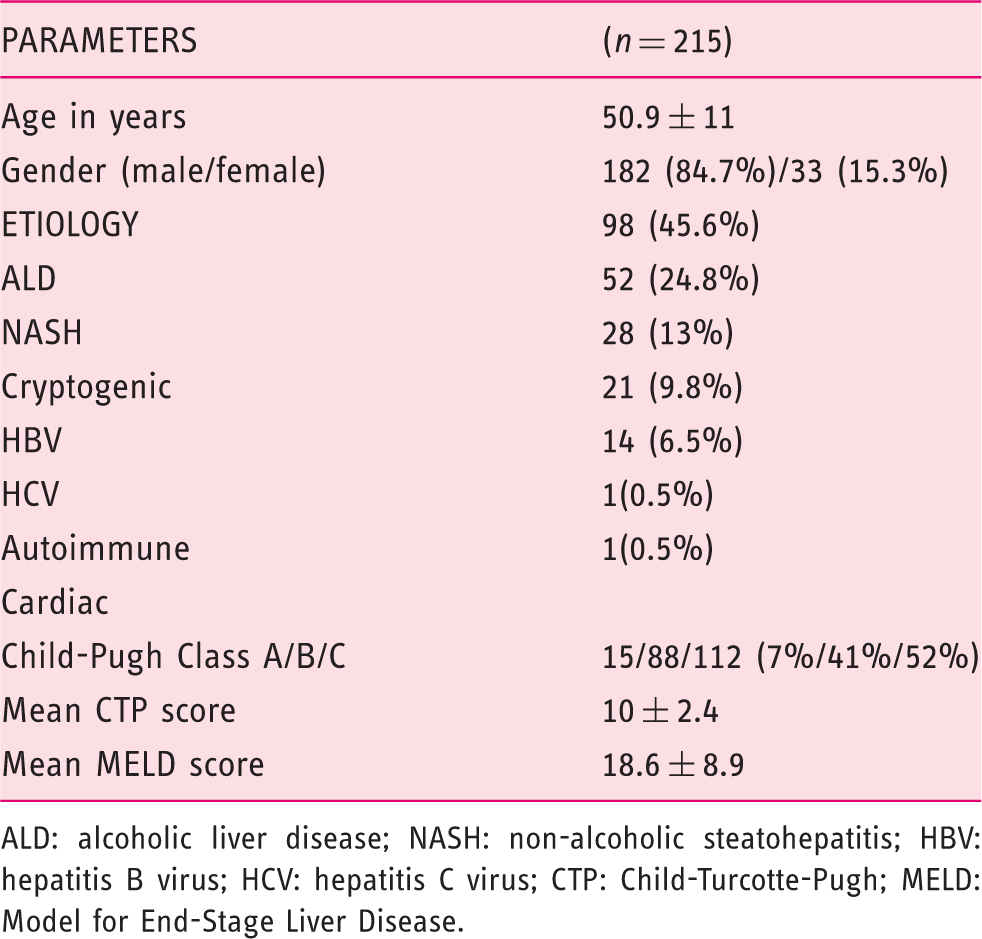
ALD: alcoholic liver disease; NASH: non-alcoholic steatohepatitis; HBV: hepatitis B virus; HCV: hepatitis C virus; CTP: Child-Turcotte-Pugh; MELD: Model for End-Stage Liver Disease.
The mean CTP of the entire group was 10 ± 2.4, out of whom 7% (15) patients were in Child Class A; 41% (88) patients were in Child Class B; and 52% (112) patients were in Child Class C. The mean Model for End-Stage Liver Disease (MELD) score of the study population was 18.6 ± 8.9.
Ascites were present in 81.4% (n = 175) of the patients. Out of total patients with ascites, mild ascites were present in 41.7% (n = 73), moderate ascites were present in 19.4% (n = 34) and gross ascites were present in 38.9% (n = 68).
Esophageal varices were present in 83.7% (n = 180), the majority of whom (63.3%) (n = 114) had small varices while the rest (36.6%) had large varices.
Prevalence and associations of HOD
Prevalence of HOD as defined by T score at the lumbar vertebra was 66% (n = 142) and at the femoral neck it was 44% (n = 95). All the patients who showed HOD at the femoral neck also had HOD at the lumbar vertebra. Patients were divided into three groups based on BMD results: those with normal bone density, group A (n = 73, 34%), those with osteopenia, group B (n = 95, 44.2%) and those with osteoporosis, group C (n = 47, 21.8%). All baseline characters and laboratory parameters were compared among these three groups.
Univariate analysis of baseline demographic and laboratory parameters of patients.
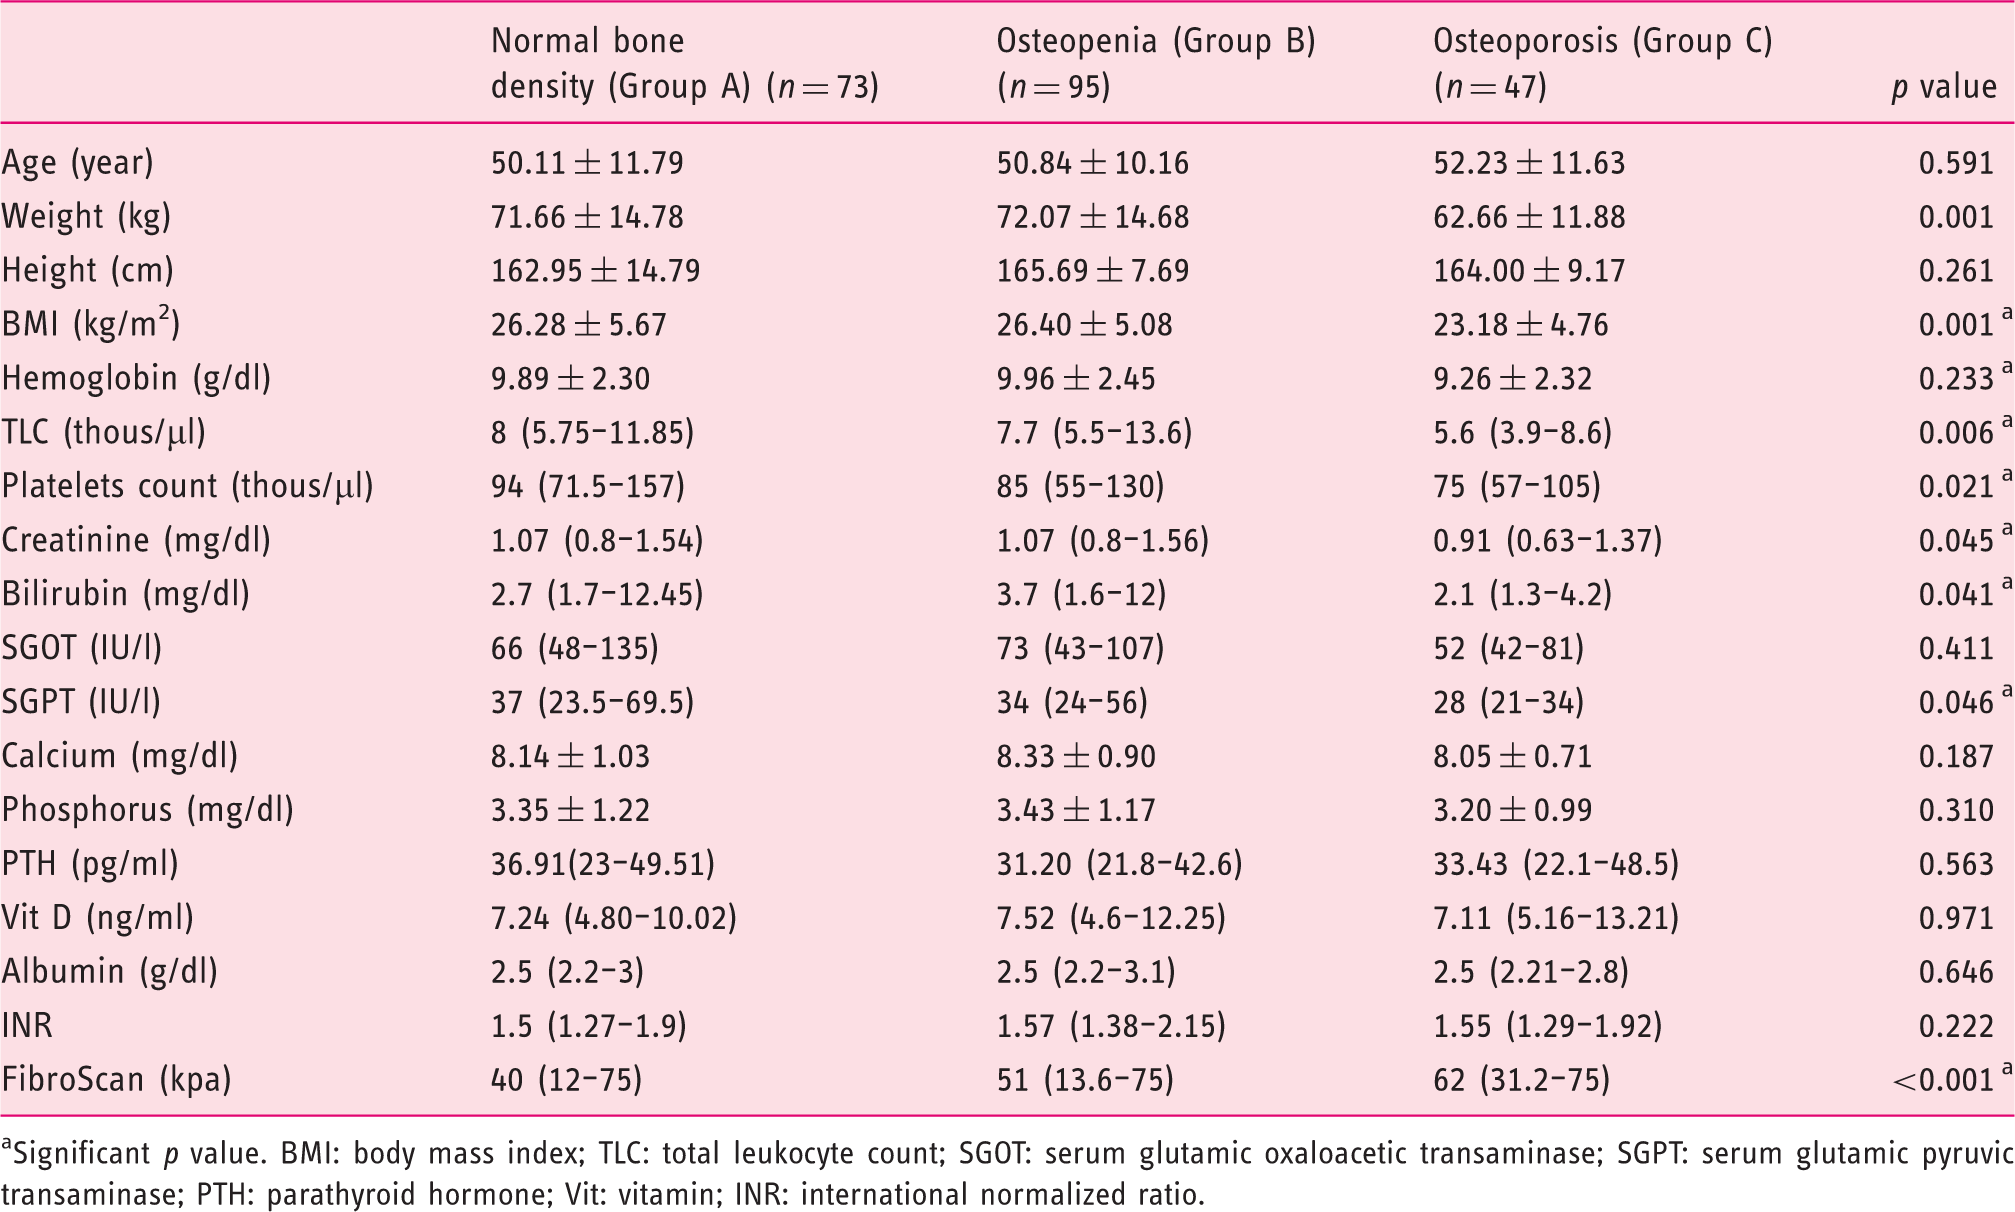
Significant p value. BMI: body mass index; TLC: total leukocyte count; SGOT: serum glutamic oxaloacetic transaminase; SGPT: serum glutamic pyruvic transaminase; PTH: parathyroid hormone; Vit: vitamin; INR: international normalized ratio.
Predictive factors for osteoporosis as compared to normal BMD on multivariate analysis.
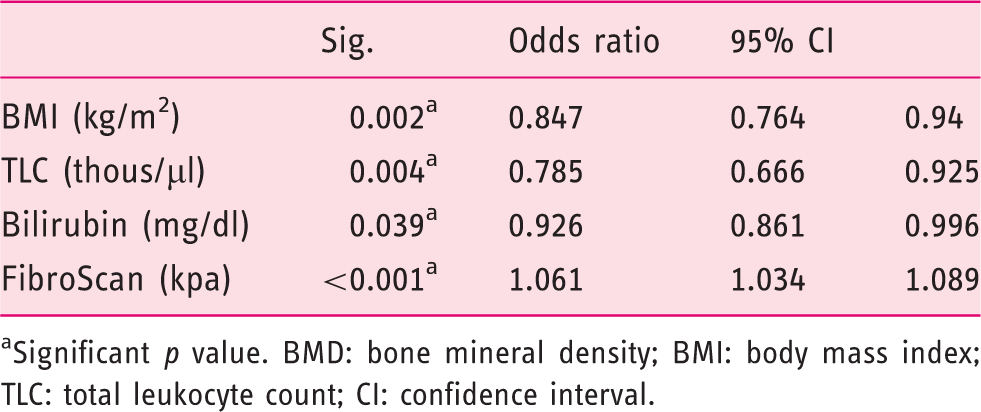
Significant p value. BMD: bone mineral density; BMI: body mass index; TLC: total leukocyte count; CI: confidence interval.
Etiological comparison among normal BMD (Group A), osteopenia (Group B) and osteoporosis (Group C).
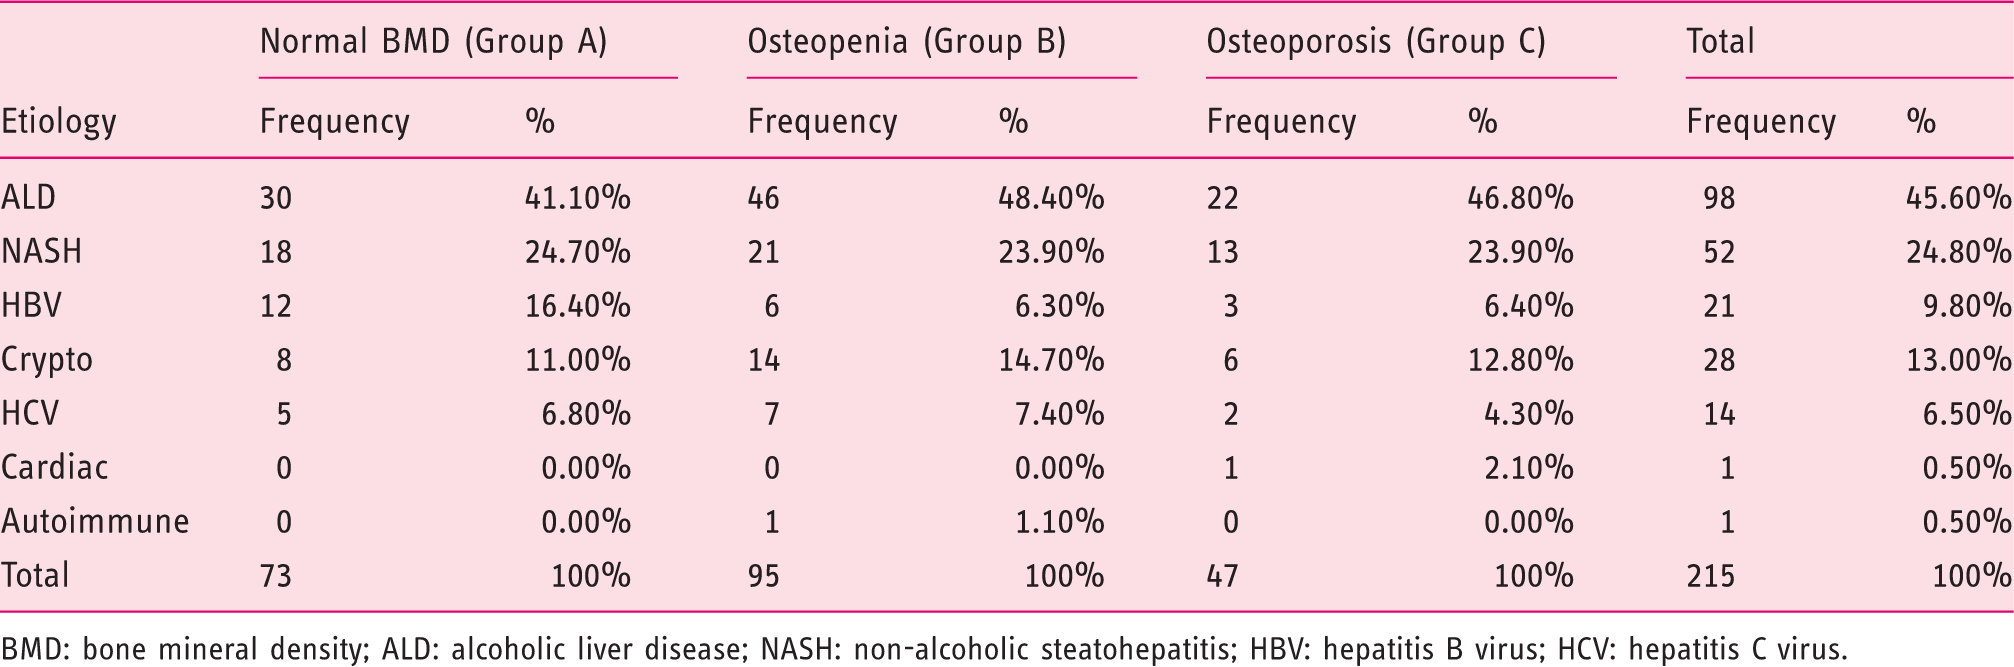
BMD: bone mineral density; ALD: alcoholic liver disease; NASH: non-alcoholic steatohepatitis; HBV: hepatitis B virus; HCV: hepatitis C virus.
The relation between severity of liver disease and HOD was studied using Child score, MELD score and FibroScan.
In Child A cirrhosis, seven (46.66%) had normal BMD, five (33.33) had osteopenia and three (20%) had osteoporosis. In Child B cirrhosis, 26 (29.5%) had normal BMD, 39 (44.3%) had osteopenia and 23 (26.1%) had osteoporosis. In Child C liver cirrhosis, 41 (35.7%) had normal BMD, 51 (45.5%) had osteopenia and 21 (18.75%) had osteoporosis. The difference in prevalence of osteopenia and osteoporosis among various Child groups was not significant statistically (p = 0.512) (Figure 1).
Comparison of baseline Child class in normal BMD (Group A), osteopenia (Group B) and osteoporosis (Group C).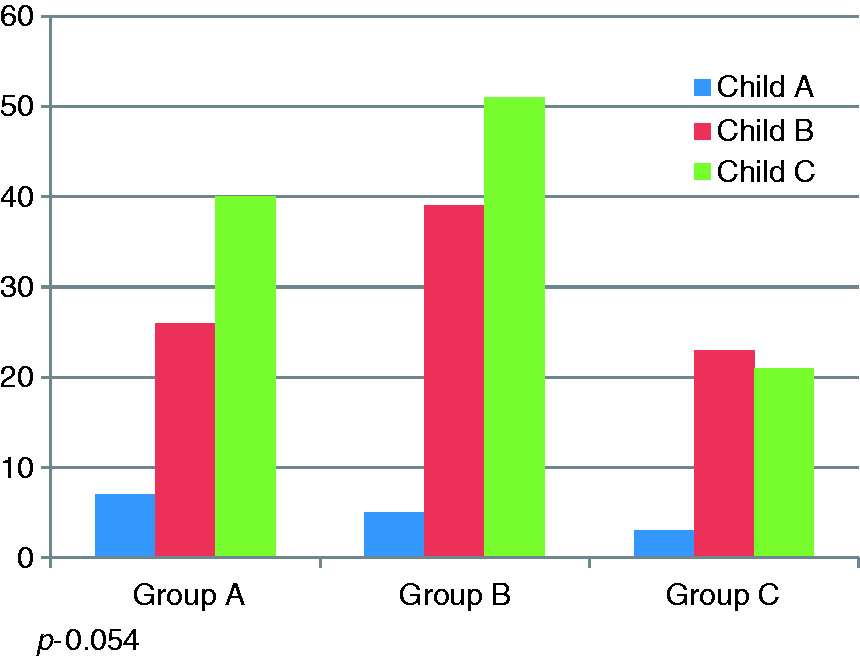
The MELD score of Group A was 18.48 ± 8.28, Group B was 19.82 ± 9.26 and Group C was 16.53 ± 8.70. Using the Mann-Whitney test, there was no statistical association of MELD score with HOD (p = 0.112) (Figure 2).
Comparison of MELD score among normal BMD (Group A), osteopenia (Group B) and osteoporosis (Group C).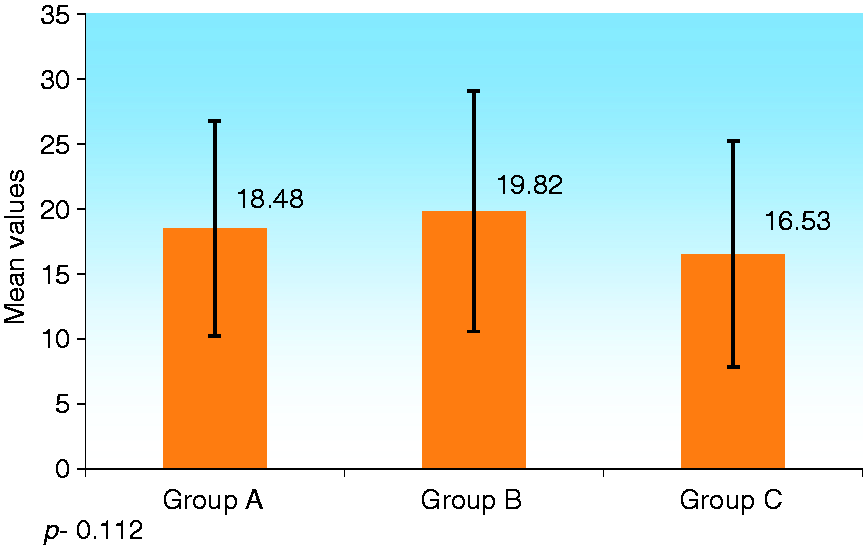
Mean FibroScan value was 40 kilo pascal (kpa) in Group A, 51 kpa in Group B and 62 kpa in Group C. FibroScan in patients with osteoporosis and osteopenia were significantly higher as compared to those with normal BMD (Groups A and B p < 0.001, Groups A and C p < 0.001). Patients with osteoporosis had higher FibroScan values as compared to those with osteopenia (Group B and C p = 0.001) (Figure 3).
Comparison of baseline FibroScan value among normal BMD (Group A), osteopenia (Group B) and osteoporosis (Group C).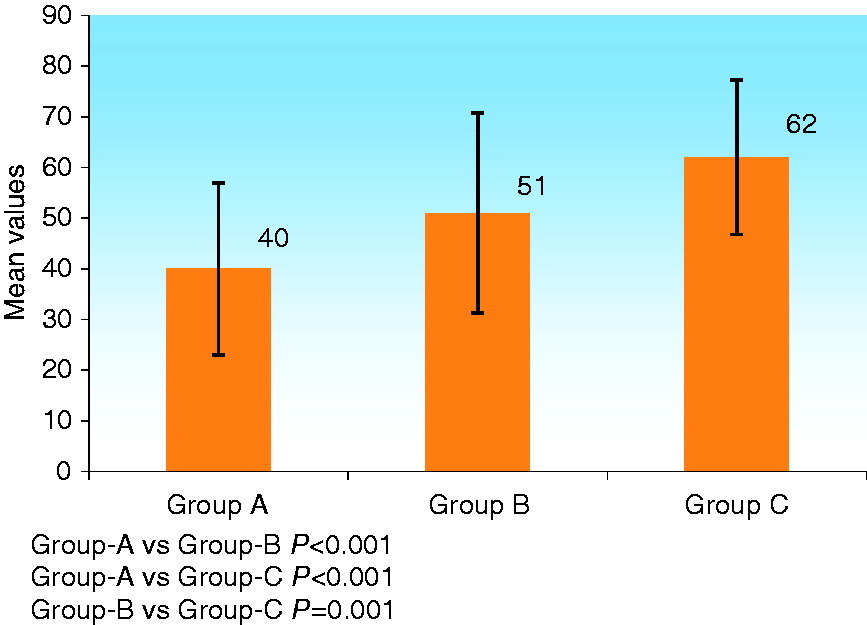
To test the usefulness of FibroScan for predicting HOD, we constructed receiver-operating characteristic curves (ROC) and found that the area under curve (AUC) was 0.711 (Figure 4). Based on the ROC curve and Youden index, we found that the best FibroScan cut-off value to predict HOD was 60 kpa. At this FibroScan value the sensitivity for detecting HOD was 50% while specificity was 86%, positive predictive value (PPV) was 88% and negative predictive value (NPV) was 47%.
ROC curve showing utility of FibroScan in detecting HOD.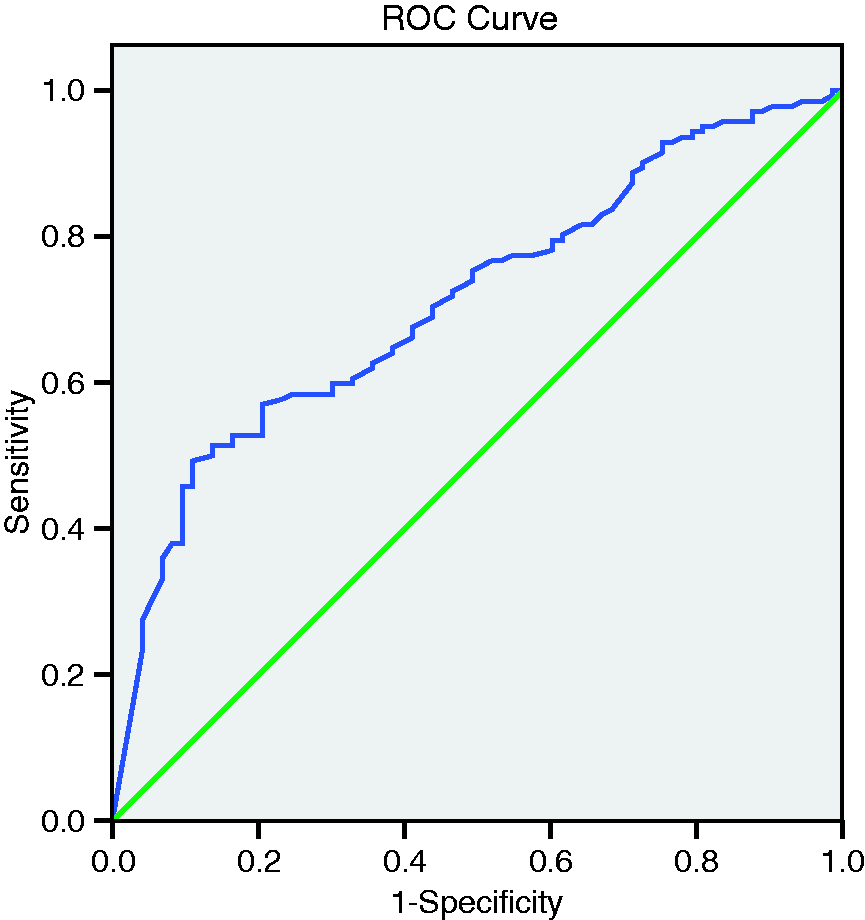
Follow-up
During the follow-up period, four out of 47 (8.5%) patients with osteoporosis developed fracture within two months of treatment. Sites of fracture were neck of femur, L–3 vertebra, T–11 vertebra and humerus.
Comparison of demographic and laboratory parameters between treatment group and baseline.
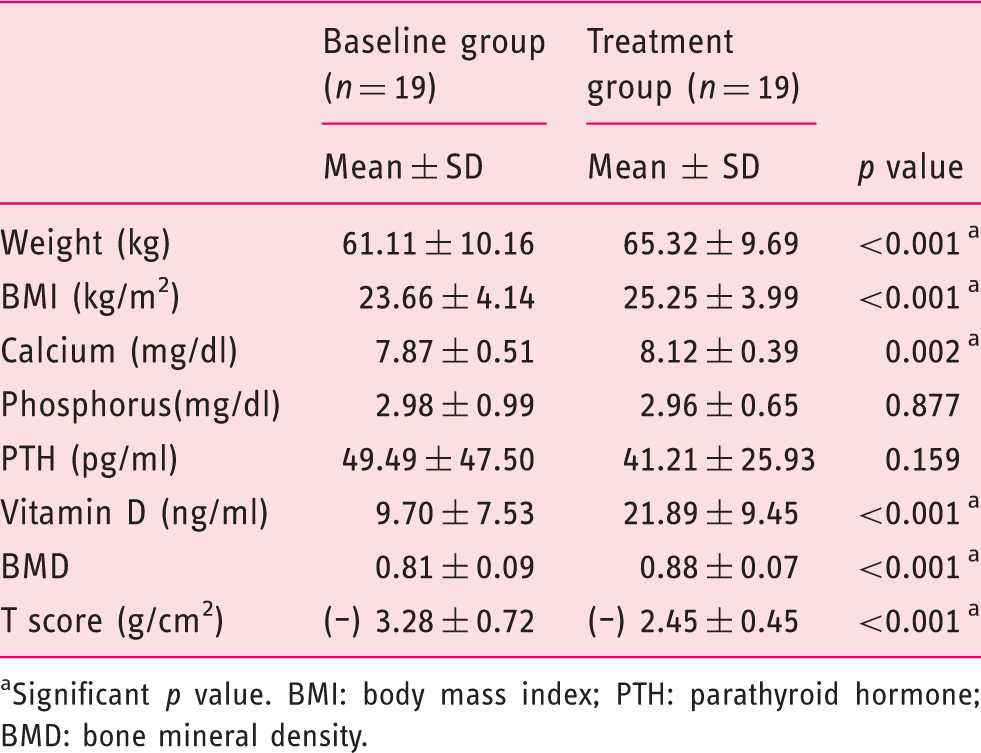
Significant p value. BMI: body mass index; PTH: parathyroid hormone; BMD: bone mineral density.
Discussion
This is the largest prospective study from India on the prevalence of HOD in patients with non-cholestatic liver cirrhosis. We studied 215 patients while two other Indian studies enrolled 115 and 72 patients. Our study reported a prevalence of 66% whereas the other studies from India reported a prevalence of 68% 3 and 95%. 4 In Western studies, the prevalence of HOD has been reported to be between 13% and 70%.1,2
During the follow-up period of one year, four patients developed spontaneous fracture. Other studies have reported a prevalence of fracture between 3% and 18%.5,6 In our study 8.5% (four of 47) patients with liver cirrhosis who had osteoporosis developed a fracture. Patients with liver cirrhosis should be screened for HOD and treated, and those with osteoporosis should be treated appropriately.
The pathogenesis of HOD is multifactorial. These include low lean body mass, inadequate calcium and vitamin D intake, low sunlight exposure, impaired cutaneous synthesis of vitamin D because of skin hyperpigmentation and hypogonadism.3,7 Patients with autoimmune liver disease or those who are post-liver transplantation require immunosuppressive therapy, which may cause further bone mineral loss. 8
Among the predictive factors for HOD, on multivariate logistic regression analysis, FibroScan, BMI, TLC and serum total bilirubin were found to be significantly different in patients with HOD in comparison to those with normal BMD. The relation of FibroScan with BMD value may represent an association with degree of portal hypertension. Difference in BMI is probably related to malnutrition, which leads to HOD. Total serum bilirubin is a part of the LFT, and low TLC may represent a feature of hypersplenism. However, other LFT parameters like albumin or INR were not found to be predictive.
All other factors like age, gender distribution, calcium, phosphate, vitamin D, TSH, PTH and gonadal hormones were not significantly different among all three groups. Serum calcium and vitamin D were below normal in the majority of patients among all three groups, and this might be the reason for the lack of difference between the groups. Serum PTH and vitamin D are crucial for bone metabolism; 25 hydroxylation of vitamin D takes place in the liver and this process may be compromised in chronic liver disease, which can result in metabolic bone disorders. However, we did not find a significant correlation between 25-OH D and HOD. This indicates that HOD has a multifactorial pathogenesis beyond vitamin D metabolism.
Similar to results for serum calcium and vitamin D, gonadal hormones were low in the vast majority of our patients (90%) but there was no difference among the groups.
A likely explanation for these observations is that low vitamin D and gonadal hormone level predispose patients with cirrhosis to HOD. Additional factors like nutrition, as reflected by BMI and weight, ultimately lead to the development of HOD.
The relation of severity of liver cirrhosis and HOD has been reported with conflicting results in earlier studies.9–11 In our study we found that there was no difference in prevalence of HOD with Child score. One probable reason for this may be the very small number of patients with Child class A.
Similarly there was no association of HOD with MELD score. This may be explained by the exclusion of patients with renal dysfunction.
FibroScan is a non-invasive method for assessing liver stiffness and portal hypertension. No previous study has studied the relationship between FibroScan and BMD. In our study we found that FibroScan value can differentiate between normal BMD with HOD. When we used 60 kpa as a cut-off point, the specificity for detection of HOD was 86%. The relation between FibroScan and BMD value may represent a relationship with degree of portal hypertension.
In our study we didn’t find any association of HOD with a particular etiology of liver cirrhosis. Similar results have been shown in previous studies.
This is the first study in which bisphosphonates have been used for treatment of osteoporosis in patients with liver cirrhosis. We gave oral bisphosphonate, i.e. ibandronic acid 150 mg, once a month, and after six months of bisphosphonate supplementation all patients showed significant improvement in BMD. There were no adverse events seen in these patients. During the follow-up period of one year, four patients developed spontaneous fracture. All these patients developed fractures within two months of initiating treatment. Larger sample size and long-term follow-up are needed to recommend treatment with ibandronic acid in patients with HOD and cirrhosis. Considering the safety and efficacy of ibandronic acid in this study, it can be used in all cirrhotics with osteoporosis.
Limitations of this study were lack of complete information on nutritional status, no separate analysis based on diuretic use, and lack of data about physical activity and sunlight exposure. We also did not analyze any impact of chronic obstructive pulmonary disease (COPD), diabetes, alcohol and smoking.
In conclusion, we found a high prevalence (66%) of HOD among Indian patients with non-choleastatic disease. The DEXA scan is a simple and non-invasive method to determine HOD. Screening for HOD should be performed in all liver cirrhosis patients. FibroScan is a modality that can predict HOD in patients with liver cirrhosis with a high degree of specificity. Severity of liver disease (CTP score and MELD score) and etiology of liver cirrhosis did not determine HOD. Ibandronic acid is a safe drug that shows significant improvement in BMD in patients with liver disease along with osteoporosis.
Footnotes
Funding
This research received no specific grant from any funding agency in the public, commercial, or not-for-profit sectors.
Conflict of interest
None declared.