
Abstract
Objectives:
In Pakistan, the degradation of drinking water quality is exacerbated by the increasing population size and rapid industrialization. Contaminated water serves as the predominant source of numerous diseases, including diarrhea, gastroenteritis, and typhoid. This article explores the evolution of waterborne diseases across 21 districts of the Khyber Pakhtunkhwa province in Pakistan by monitoring changes in the clustering solutions.
Methods:
The data employed in this study were sourced from 21 districts of KP by the Director-General Health Services. Cluster analysis was utilized to uncover patterns in waterborne disease incidence, while principal component analysis was employed to reveal underlying patterns and reduce dimensionality. Additionally, the MONItoring Clusters (MONIC) framework was applied for change detection, facilitating the identification of significant shifts in disease patterns over time and aiding in the understanding of temporal dynamics.
Results:
Our analysis indicates that two clusters survived consistently over time, while other clusters exhibited inconsistency. Profiling of the surviving clusters (C12 → C24 → C32 → C43) suggests a gradual increase in cases of bloody diarrhea in the Swat Valley, Hangu, Karak, and Lakki Marwat regions. Similarly, profiling of the surviving clusters (⊙→ C22 → C34 → C44) suggests an increase in the acute watery diarrhea (non-cholera) and typhoid fever in the regions of Peshawar, Nowshera, and Swabi.
Conclusion:
The findings of this study hold significant importance as they pinpoint the most vulnerable regions for various waterborne diseases. These insights offer valuable guidance to policymakers and health officials, empowering them to implement effective measures for controlling waterborne diseases in the respective regions of Khyber Pakhtunkhwa, Pakistan.
Introduction
Water is essential for life, and access to clean drinking water is one of human’s fundamental rights. Among many other factors, the contamination of food and water is a major source of disease transmission. Every year thousands of children lose their lives due to contaminated sources of water. These sources cause acute diarrhea diseases, typhoid, cholera, and so on, which are termed as waterborne diseases.1,2 Waterborne diseases pose significant public health challenges worldwide, particularly in regions with inadequate sanitation infrastructure and limited access to clean water. According to UNICEF, 3 water-related infections extinguish 1.8 million lives each year, the leading cause of death, across the world. Among these regions, Khyber Pakhtunkhwa (KP), Pakistan, stands out as a hotspot for waterborne diseases due to rapid population growth, industrialization, and limited infrastructure development. 4 Contaminated water sources serve as breeding grounds for pathogens, leading to the transmission of diarrhea, gastroenteritis, typhoid fever, and hepatitis. These diseases not only cause immense suffering but also impose a substantial economic burden on healthcare systems and society at large.5,6
There has been a significant increase in waterborne diseases in Pakistan as a result of people being compelled to drink stagnant, dirty water after the floods. More than 660,120 cases of acute, watery diarrhea, skin infections, typhoid, malaria, and dengue fever have been reported.7,8 The frequent floods in Pakistan destroy the infrastructure, resulting in a lack of toilet facilities, water sanitation, and hygiene. Zahid 5 showed that sources of drinking water and toilet facility are the most common environmental household-level indicators for a high prevalence rate of waterborne diseases. Waterborne infections such as dysentery, cholera, giardiasis, and hepatitides A and E have grown more common as a result of poor sanitation and water quality.
The World Health Organization (WHO) estimates that between 25% and 30% of diseases are gastrointestinal disorders. Almost 46% of the KP population is dependent on the polluted water sources that cause a high risk of waterborne infections. Ahmad et al. 9 conducted a research on drinking water quality in the District Peshawar, KP, Pakistan that contained bacteriological studies and evaluation of antibiotic-resistant bacteria from several drinking water sources.
Pakistan has abundant freshwater resources, but with rising population, urbanization, industry, and inadequate sanitation, the water quality is deteriorating, resulting in a high prevalence rate of waterborne diseases. 10 The in-depth exploration of literature reveals that water consumption or recreational water susceptibility is the root cause of waterborne infection. According to UNICEF, 3 water-related illnesses kill 1.8 million people each year and cause 4 billion cases, making them a major cause of death and morbidity across the world.
In order to prevent the spread of diseases that are transmitted through water, it is essential to effectively monitor water sources. However, monitoring these sources and identifying vulnerable regions with waterborne diseases poses significant challenges. These difficulties are caused by a number of factors, such as the dynamics of waterborne diseases, insufficient infrastructure, and scarce resources.11,12 Due to the inadequate surveillance infrastructure, they are able to spread unnoticed until they reach dangerous levels. The primary challenge contributing to this phenomenon is the limited availability of water samples over time and the difficulty in detecting certain organisms.13,14 Consequently, we have designed a methodology for monitoring the evolution of most prevalent waterborne diseases and identify the vulnerable regions. This can be achieved by monitoring and tracing the changes in cluster solutions of data stream over time.
In this study, we implement the clustering algorithm for the segmentation of waterborne diseases dataset. Subsequently, the segment profile diagram was used for detailed profiling of each cluster. This approach enables us to identify regions vulnerable to specific waterborne diseases that are predominant within each cluster. Furthermore, the data stream was discretized by using the landmark window model and the evolution of clusters were traced over time.
In the last couple of decades, researchers have increasingly focused on investigating changes in the patterns of underlying populations. The literature has proposed numerous models and algorithms for monitoring and tracing cluster solutions in temporal streams. These approaches offer valuable tools for analyzing dynamic data and capturing evolving patterns over time.15–20 These algorithms are widely used in various domains for tracking changes in cluster solutions, allowing for the detection of evolving patterns and anomalies in data streams. The study conducted by Atif et al. 20 showcases the practical applications and significance of tracing cluster evolution across a range of real-life datasets. The research highlights the process of segmenting data streams and emphasizes the importance of monitoring changes in clustering solutions. Through their findings, the study illustrates how change detection can offer valuable insights for policymakers, enabling them to effectively address clusters that evolve over time.
Research objectives
To investigate the evolution of waterborne diseases in Khyber Pakhtunkhwa and identify the regions vulnerable to exposure.
To monitor and trace changes in cluster solutions of waterborne disease dataset.
Methods
Dataset
This study is an observational investigation utilizing secondary data collected by the Director-General Health Services (DGHS) from 21 districts of KP, Pakistan. Among various health concerns, waterborne diseases present significant threats to public health. These diseases often stemming from contaminated water sources, inadequate sanitation infrastructure, and limited access to clean water. To evaluate the existing healthcare and safety conditions, the DGHS conducted data collection on waterborne diseases across 21 districts of KP. Over a span of 28 weeks, this study examined six variables related to waterborne diseases. These variables included acute watery diarrhea (AWD) (cholera), AWD (non-cholera), bloody diarrhea, acute viral hepatitis (AIS), typhoid fever, and extensively drug-resistant (XDR) typhoid. A total of 478 cases of waterborne diseases were observed during the study span. In this study, we utilize this dataset to monitor the evolution of waterborne diseases in KP, aiming to gain insights into their dynamics and identify regions requiring targeted intervention. In the initial step, we cleaned the dataset by removing cases with missing values and outliers.
Clustering
Clustering, a cornerstone technique in machine learning and data analysis, involves grouping similar data points together based on their similarities. The goal of cluster analysis is to partition a dataset into groups such that objects within the same group are more similar to each other than to those in other groups. Overall, cluster analysis is a powerful tool for exploring and summarizing complex datasets, aiding in data interpretation, and decision-making processes. Clustering has numerous applications across various domains, including customer segmentation, image segmentation, outliers detection, and document clustering.21,22 The process of clustering typically involves the following steps.
Choosing a proximity measure: In cluster analysis, proximity measure, is used to quantify the similarity or dissimilarity between data points. This measure defines the distance between pairs of observations in the feature space and forms the basis for clustering algorithms to group similar data points together. Common proximity measures include Euclidean, Manhattan, Minkowski, Cosine Similarity, and Correlation. The choice of proximity measure depends on the nature of the data and the characteristics of the clustering problem.
Choosing a clustering algorithm: Select an appropriate clustering algorithm that fits the characteristics of the dataset and the objectives of the analysis. Some common clustering algorithms include k-means, hierarchical clustering, density-based clustering, and Gaussian mixture models.
Determining the number of clusters: Identifying the optimal number of clusters is a critical aspect of cluster analysis, ensuring that the resulting clusters accurately represent the underlying structure of the data. The process involves selecting the number of clusters that best represent the underlying structure of the data while avoiding over-fitting. Several techniques can be employed for this purpose, each offering insights into the most suitable clustering solution.
Interpreting and visualizing results: Examine the resulting clusters to understand their characteristics and interpret the patterns present in the data. This may involve visualizing the clusters using techniques such as scatter plots, dendrograms, heatmaps, and t-distributed Stochastic Neighbor Embedding (t-SNE).
In this article, we employed the standard k-means algorithm to cluster the dataset. The variables used for clustering included AWD (non-cholera), AWD (cholera), bloody diarrhea, AIS, typhoid fever, and XDR typhoid. To determine the optimal number of clusters, we utilized the elbow method, silhouette score, and Gap statistics. These techniques allowed us to identify the most suitable number of clusters that best captured the inherent structure of the data. The Euclidean distance function was utilized as a dissimilarity measure index.
Windowing approach
Over the recent past, a number of applications in real life have been generating data streams, where data items are continually produced by different sources over time. Unlike traditional datasets that are static and stored in databases, data streams are dynamic in nature and continuously updated with new observations. As a result, the underlying structure is nonstationary and undergoes evolution over time. Due to their high volume, velocity, and variability, data streams present unique challenges for processing, storage, and analysis. In order to achieve this, the continuous data stream must be discretized into subsets according to some ordered phenomena. The term “windowing approach” refers to this discretization of the stream into smaller groups. The windows represent segments of the data stream and are defined based on specific criteria, such as time intervals or the occurrence of certain events. Data within each window is then analyzed or processed independently, allowing for the detection of patterns, trends, or anomalies within that time frame. In this research article we implement the landmark window models to discretize the stream and accumulate the data items at successive time points. The landmark window model is a specific approach to windowing in data stream processing. In this model, the data stream is discretized into subsets or windows based on specific landmark points in time. In the landmark window model, data points are accumulated from a specific landmark time t1 up to the current time point ti. This means that the window includes all data points that have been observed between the landmark time t1 and the current time ti, that is,

where D represents the window, d represents the data items accumulated within the window, and n represents the total number of time points observed up to the current time.
Tracing changes in cluster solutions
Monitoring changes in cluster solutions of streaming data involves tracking how clusters evolve over time. This process is crucial for understanding how patterns within the stream change over different time periods and identifying any shifts in cluster memberships. By systematically monitoring changes in cluster solutions of temporal data, researchers can gain valuable insights into the temporal dynamics of the data and make decisions accordingly. Some of the famous algorithms for monitoring changes in cluster solutions are given in Table 1.
Models and algorithms for monitoring changes in cluster solutions.

Source: Atif et al. 19
To monitor and trace the evolution of clusters extracted from the re-clustering of cumulative datasets, a framework known as the MONIC algorithm was introduced. 23 In this paper, we implement the clusTransition package in R-software for change detection in the waterborne disease dataset.24,25 This helps in understanding the evolution of waterborne diseases in KP.
Results
Figure 1 demonstrates the correlation plot between variables, where the darker shade represents strong correlation and lighter shade represents weak or no correlation. The plot suggests a mild correlation of AWD (non-cholera) with AIS and typhoid fever. Similarly, AWD (cholera) is correlated with bloody diarrhea, while AIS is correlated with typhoid fever.

Correlation plot for variables.
Since some of the variables in our dataset are correlated, Principal Component Analysis (PCA) allows us to gain insights into the relationships and patterns among the diseases represented by the variables. Based on the scree plot analysis presented in Figure 2, we decide to retain only two dimensions, as the first two principal components collectively explain approximately 60% of the total variation in the dataset.

Explained variation by PCs.
Figure 3 demonstrates the contribution of each variable to the corresponding PCs. Subplot A illustrates that typhoid fever, AIS, and AWD (non-cholera) significantly contribute to the variability explained by the first PC. Similarly, in subplot B, AWD (cholera), and bloody diarrhea are shown to make substantial contributions to the variability explained by the second PC. In subplot C, it is observed that AWD (cholera), bloody diarrhea, and XDR typhoid constitute one dimension, whereas, AWD (non-cholera), typhoid fever, and AIS constitute the second dimension, suggesting a separate source of variability.

Contribution of PCs to the dimensions.
Figure 4 illustrates the determination of the optimal number of clusters in the dataset using three different methods: the gap statistic, silhouette statistic, and elbow method. The elbow method indicates that additional clusters beyond the fourth add only a small value in minimizing the within-cluster variation, suggesting that four clusters may be optimal. Similarly, according to the gap statistic, the optimal number of clusters is k = 4, with k = 5 being a potential contender. The silhouette statistic also supports the conclusion that k = 4 clusters is optimal based on the dataset. These analyses provide consistent evidence that k = 4 clusters is the most suitable choice for partitioning the data.
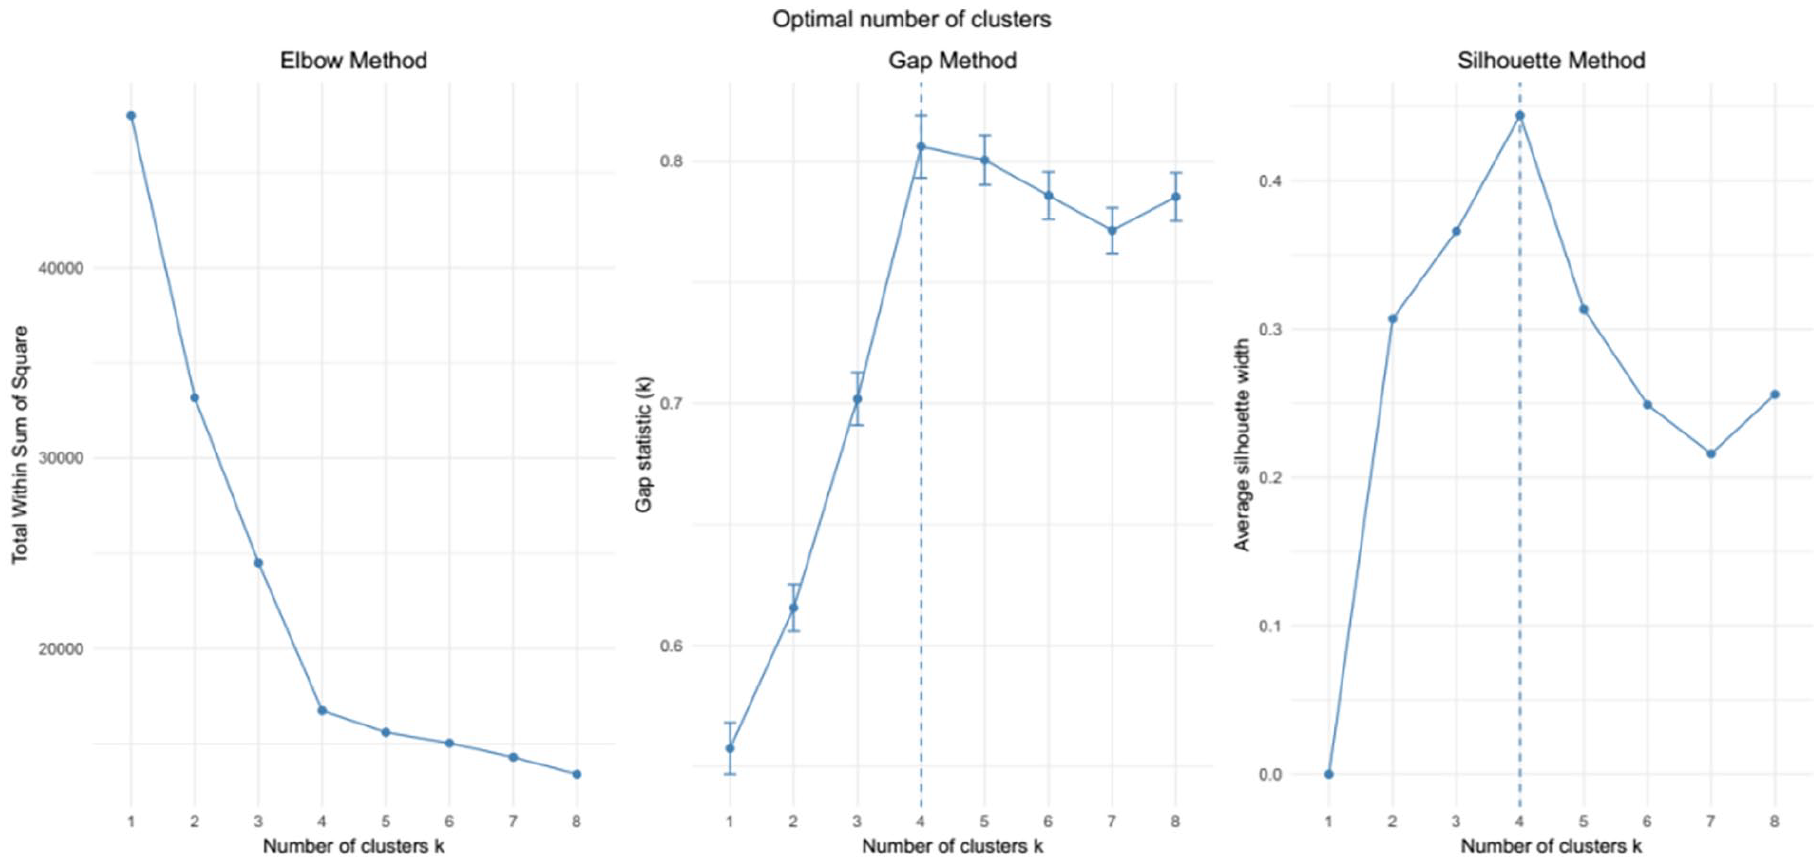
Optimal number of clusters using elbow, gap, and silhouette methods.
Figure 5 provides a profiling of each individual cluster in the dataset generated by the k-means algorithm. The largest cluster, Cluster 3, represents 37% of the data items and is characterized by a relatively high proportion of bloody diarrhea patients and an extremely low proportion of AWD (non-cholera) and typhoid fever patients. The second largest cluster, Cluster 1, represents 28% patients and is distinguished by a very high proportion of AWD (cholera) and typhoid fever patients. The Cluster 2, comprising 28% of the data items, exhibits a high proportion of AIS patients. The Cluster 4 is characterized by an extremely high proportion of AWD (non-cholera) and typhoid fever patients. The disease such as XDR typhoid is homogeneously distributed among all segments.
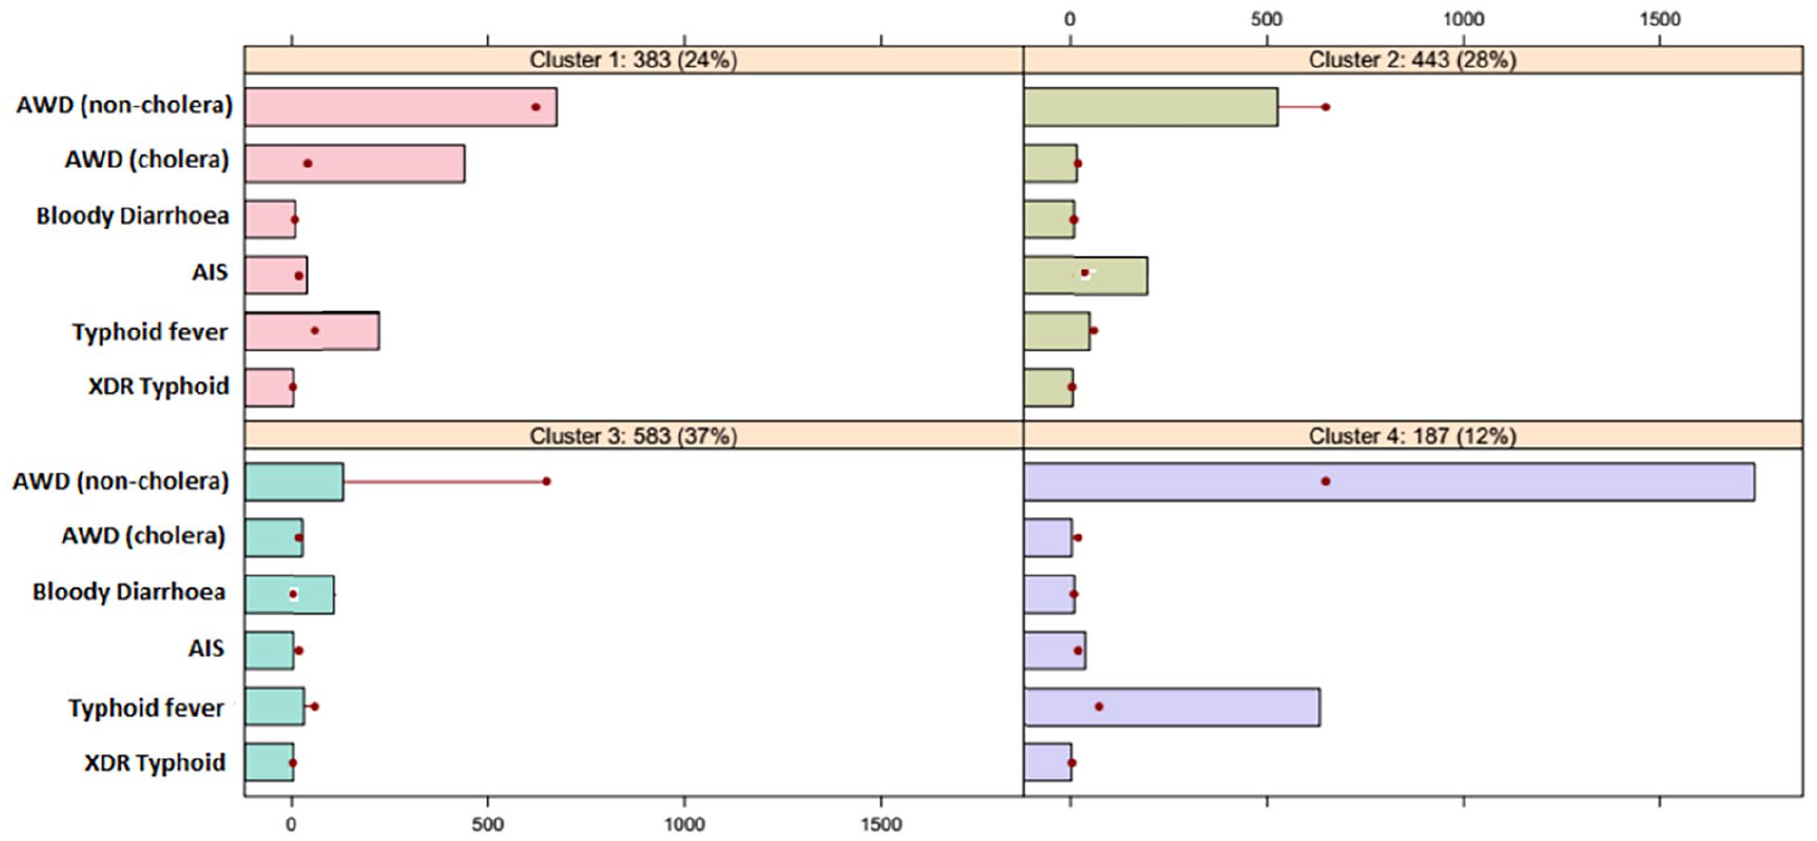
Segment profiling plot.
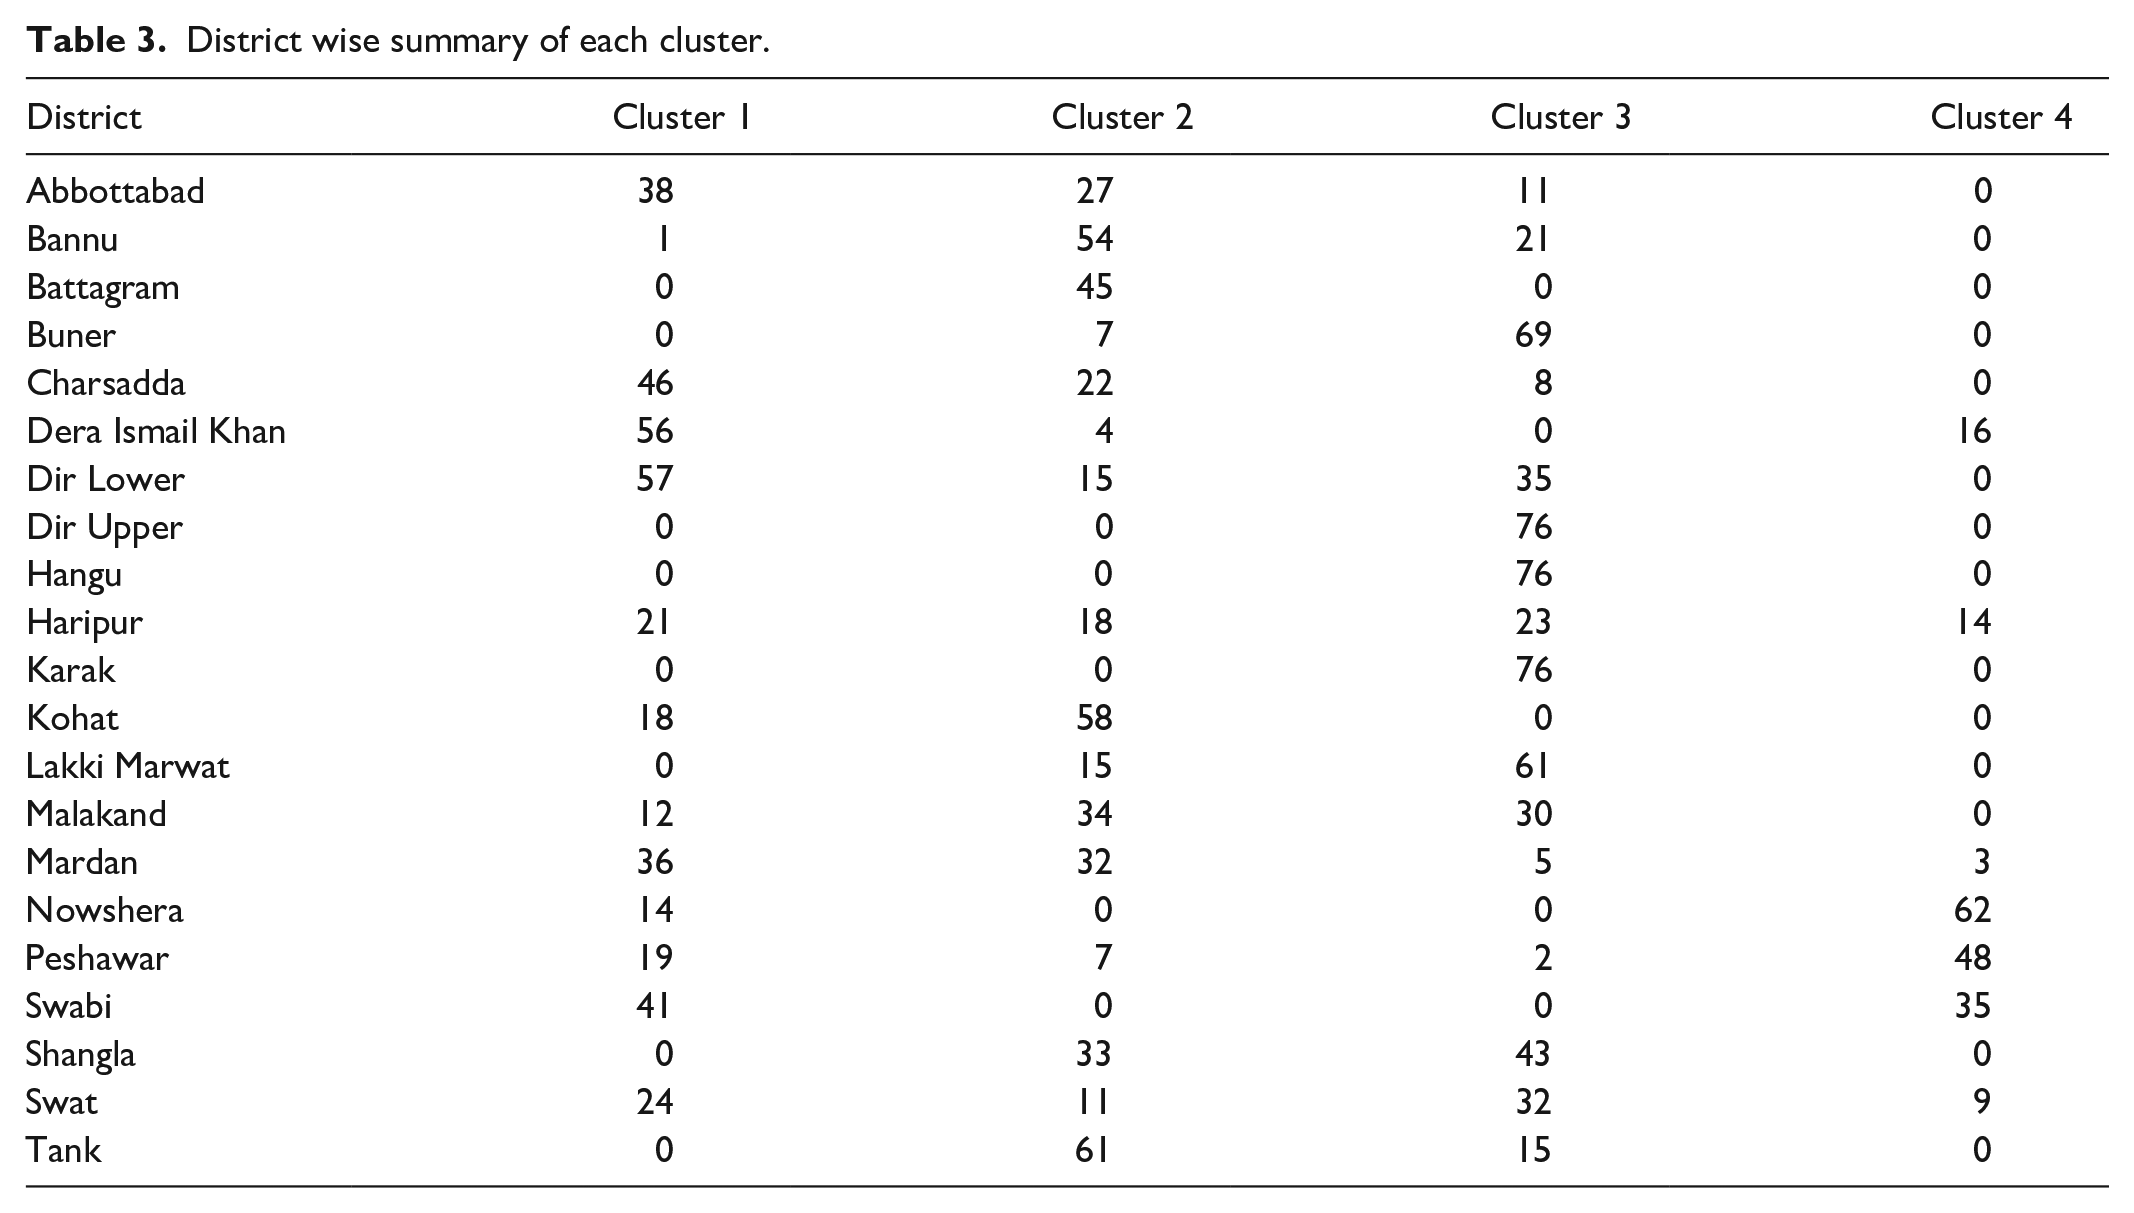
Table 2 (provided in Annexure I) presents the district-wise summary of all clusters in the dataset. Utilizing the segment profiling plot, we identified the most vulnerable districts to various waterborne diseases on the map of KP, as depicted in Figure 6. The largest cluster (Cluster 3) comprises of Swat Valley (Dir Upper, Dir Lower, Malakand, Swat, Shangla, and Buner), Hangu, Karak, and Lakki Marwat. These regions are identified as highly susceptible to bloody diarrhea. However, this cluster exhibits relatively lower risk levels for AWD (non-cholera) and typhoid fever. The second largest cluster (Cluster 1) includes districts such as Charsadda, Mardan, Swabi, Haripur, Abbottabad, and Dera Ismail Khan. These regions are identified as being exposed to both AWD (cholera) and Typhoid fever patients. Cluster 2 encompasses Battagram, Kohat, Bannu, and Tank districts. These regions are identified as being extremely vulnerable to AIS disease. However, the districts belonging to Cluster 2 are considered safe in terms of AWD (non-cholera) disease. Similarly, Peshawar, Nowshera, and Swabi belong to Cluster 4 and are identified as being extremely vulnerable to AWD (non-cholera) and typhoid fever. This observation underscores the importance of implementing targeted public health interventions in these areas to address the high prevalence of these waterborne diseases. By focusing resources and efforts on these vulnerable districts, authorities can effectively mitigate the spread of diseases and improve overall public health outcomes in the region.
Optimal number of clusters in each windowpane.


Vulnerable regions with waterborne diseases.
Change detection
The stream of data was discretized by accumulating it over the weeks. This was done by implementing the landmark window to the stream, accumulating it at successive time points. A window of 8 weeks was used. The implementation of the landmark window model generates four windowpanes, which comprise data evolving during [t1, ti]. Table 3 summarizes the optimal number of clusters in each windowpane of cumulative dataset estimated using elbow, gap, and silhouette methods. The details of estimating optimal number of clusters in each windowpane are provided in Figure 12 in Supplemental files. These methods provide consistent evidence that the optimal number of clusters in windowpanes D1, D2, D3, and D4 is 3, 4, 4, and 4, respectively.
Clustering cumulative datasets at successive time points results in a series of cluster solutions, with each solution corresponding to a specific windowpane of the dataset. The survival thresholds of τ = 0.6, 0.7, 0.8, and 0.9 were used to monitor any changes in these cluster solutions over time. Figure 7 demonstrates the survival ratio of clusters for different values of survival threshold. It is evident that τ ⩽ 0.7 produces very stable cluster solutions at successive time points. As the survival threshold τ exceeds 0.7, it signifies a strong temporal dependency in the data. In this scenario, only a few clusters from previous time points survived, while new clusters emerge in the dataset.

Effect of survival threshold on survival ratio.
Figure 8 in the Annexure demonstrates the changes in cluster solution for τ = 0.7 and τ = 8. For τ = 0.7, hardly any changes are detected, while for τ = 0.9, only one cluster survived. For small τ, we observed that the resulting clusters were highly inconsistent. Conversely, for very large τ, hardly any changes were detected in the clusters over time. Therefore, we decided to select a survival ratio of 0.8 for further analysis of the evolution of disease. This threshold strikes a balance between capturing meaningful changes in cluster composition while minimizing inconsistency in the clustering results.

Transition of clusters for different survival threshold.
Figure 9 demonstrates the evolution of clusters over time for τ = 0.8. It is evident that one cluster survives from time point t1 till time point t4 (C12 → C24 → C32 → C43), growing more diffuse than its ancestor clusters. Similarly, one cluster that emerged at time point t2 survived till time point t4 (⊙ → C22 → C34 → C44). One cluster disappears at each successive time point (C13 →⊙C23 → ⊙ C31 → ⊙). Two clusters t4 (C12 → C24 → C32 → C43) and (⊙ → C22 → C34 → C44) are important clusters, which require detailed analysis and special attention. The other clusters are inconsistent and is constantly disappearing at τ = 0.8 threshold.
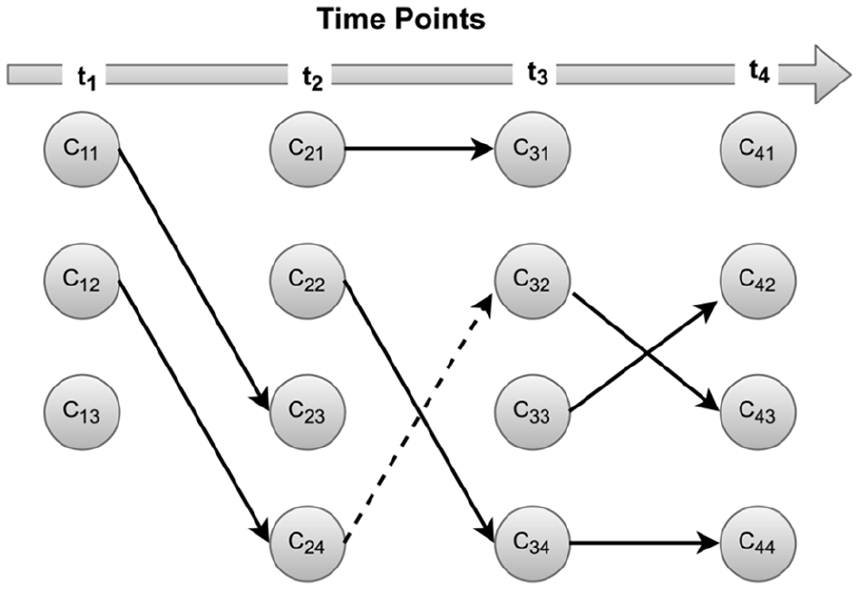
Evolution of clusters over time. The nodes represent the clusters at respective.
Figure 10 demonstrates the profiling plot of survived clusters (C12 → C24 → C32 → C43). The plot clearly indicates that the proportion of bloody diarrhea patients is increasing gradually with the passage of time. This suggests that the water quality in Swat Valley, Hangu, Karak, and Lakki Marwat is contaminating day by day causing an increase in the bloody diarrhea in the region.

Profiling plot of survived cluster (C12 → C24 → C32 → C43).
Similarly, Figure 11 suggests an increase in the AWD (non-cholera) and typhoid fever in the regions of Peshawar, Nowshera, and Swabi.

Profiling plot of survived cluster (⊙ → C22 → C34 → C44).
Discussions
In Pakistan, the drinking water quality is being eroded due to the threatening growth of population size and rapid industrialization. Contaminated water is the primary source of several diseases such as diarrhea, gastroenteritis, and typhoid. 26 Findings of this study shed light on the complex relationship between waterborne diseases, their prevalence, and dynamics in KP, Pakistan. For instance, typhoid fever and AIS are often linked to fecal contamination of water sources, with poor sanitation and inadequate hygiene practices contributing to their common transmission route. 23 The correlation between these diseases suggests common risk factors and environmental conditions conducive to their spread, emphasizing the need for comprehensive sanitation and hygiene interventions to prevent their transmission. Similarly, study by O’Reilly et al. 27 have highlighted the role of bacterial pathogens such as Vibrio cholerae and Escherichia coli in the etiology of both AWD (cholera) and bloody diarrhea cases. Interestingly, the contribution of XDR typhoid to the principal components was found to be minimal, indicating that this disease is spread homogeneously across KP. This suggests that XDR typhoid may pose a consistent and widespread threat to public health in the region, warranting further attention and targeted intervention efforts. 28
Waterborne diseases are among the foremost causes of death across the globe. It is suspected that contaminated water is the primary source of spreading these diseases. Inadequate access to clean water and poor sanitation facilities significantly contribute to the spread of these diseases. For instance, cholera, caused by the bacterium Vibrio cholerae, is often linked to drinking water contaminated with fecal matter. Similarly, typhoid fever, which is caused by Salmonella typhi, is frequently transmitted through ingestion of water or food that has been contaminated by the feces of an infected person. 29 Unfortunately, the identification of risk factors related to waterborne diseases is a difficult task. Because, on one hand, the time to time water samples is not available for all regions. Similarly, on the other hand, some pathogens are difficult to detect. Effective prevention strategies include ensuring access to safe drinking water, improving sanitation and hygiene practices, and implementing robust water quality monitoring systems. These measures are essential to reduce the burden of waterborne diseases and improve public health outcomes worldwide. 30 For the identification of the vulnerable regions to different waterborne diseases, we cluster the dataset and detailed profiling of each segment was studied. The diseases were used to generate clusters, and then summaries of districts were used to identify the vulnerable regions. The study’s finding reveals that bloody diarrhea is extremely prevalent in Swat Valley (which includes Dir Upper, Dir Lower, Malakand, Swat, Shangla, and Buner), Hangu, Karak, and Lakki Marwat. However, this is extremely safe zone for AWD (non-cholera) and typhoid fever. Rahman et al. 31 suggested that renovating existing drinking water sources and implementing new safe drinking water schemes could significantly reduce the prevalence of waterborne diseases and lower household healthcare costs in the region. Similarly, Charsadda, Mardan, Swabi, Haripur, Abbottabad, and Dera Ismail Khan are extremely vulnerable to bloody diarrhea and typhoid fever, but are considered safe for AWD (non-cholera). The AIS is more prevalent in the regions of Battagram, Kohat, Bannu, and Tank. Similarly, the AWD (non-cholera) and typhoid fever is extremely prevalent in Peshawar, Charsadda, and Swabi.
Monitoring changes in cluster solutions identifies regions facing persistent water quality challenges and increasing prevalence of waterborne diseases. Specifically, analysis reveals concerning trends in the water quality of Peshawar, Nowshera, and Swabi, where pollution levels are consistently rising, leading to a significant increase in cases of AWD (non-cholera) and typhoid fever.32,33 These regions require urgent attention and targeted interventions to address the underlying causes of water pollution and mitigate the associated health risks. Furthermore, the Swat Valley, Hangu, Karak, and Lakki Marwat are experiencing a rapid increase in cases of bloody diarrhea. This alarming trend underscores the need for immediate action to improve sanitation infrastructure, enhance water treatment processes, and implement effective public health measures to prevent the spread of these diseases in these regions.
While this study contributes to understanding the dynamics of waterborne diseases in KP, it is essential to acknowledge its limitations to provide a foundation for future research and public health interventions.
This study does not account for all potential confounding factors that could influence the relationship between water quality and disease prevalence. Factors such as socioeconomic status, access to healthcare, and environmental variables could have significant impacts on disease transmission but were not explicitly considered in the analysis. Additionally, as an observational study, the findings shed light on the dynamics of waterborne diseases and identify vulnerable regions affected by them. However, it’s crucial to acknowledge that causality cannot be established solely from observational data. While we observed correlations between certain variables, further research, including longitudinal studies or randomized controlled trials, is needed to explore the causal relationships.
Conclusion
The findings of this study underscore the relationships among different waterborne diseases in KP, Pakistan, emphasizing the need for comprehensive strategies to address public health challenges. Identifying vulnerable regions to different waterborne diseases through clustering and detailed profiling enables targeted interventions and resource allocation for effective disease prevention and control. The findings highlight alarming trends, such as the rapid increase in cases of bloody diarrhea in Swat Valley, Hangu, Karak, and Lakki Marwat, and rising pollution levels in Peshawar, Nowshera, and Swabi leading to an increase in cases of AWD (non-cholera) and typhoid fever. Urgent action is needed to improve sanitation infrastructure, enhance water treatment processes, and implement effective public health measures to prevent the spread of these diseases.
Based on the findings of this study, several recommendations can be made to address the challenges posed by waterborne diseases and improve public health outcomes. Firstly, it is essential to enhance water quality monitoring by implementing robust systems across all districts to identify and mitigate sources of contamination promptly. Additionally, investing in infrastructure projects to improve access to clean water and sanitation facilities, particularly in vulnerable communities, is crucial. Public health campaigns should be launched to raise awareness about the importance of clean water, proper hygiene practices, and the prevention of waterborne diseases. Furthermore, developing targeted interventions for regions identified as high risk based on the clustering analysis is necessary, focusing on disease prevention and control measures. Finally, further research, including longitudinal studies or randomized controlled trials, is necessary to explore causal relationships and inform more targeted public health interventions.
Supplemental Material
sj-docx-1-smo-10.1177_20503121241263032 – Supplemental material for Evolution of waterborne diseases: A case study of Khyber Pakhtunkhwa, Pakistan
Supplemental material, sj-docx-1-smo-10.1177_20503121241263032 for Evolution of waterborne diseases: A case study of Khyber Pakhtunkhwa, Pakistan by Muhammad Atif, Gohar Ayub, Fazal Shakoor, Muhammad Farooq, Muhammad Iqbal, Qamruz Zaman and Muhammad Ilyas in SAGE Open Medicine
Footnotes
Annexure
District wise summary of each cluster.
| District | Cluster 1 | Cluster 2 | Cluster 3 | Cluster 4 |
|---|---|---|---|---|
| Abbottabad | 38 | 27 | 11 | 0 |
| Bannu | 1 | 54 | 21 | 0 |
| Battagram | 0 | 45 | 0 | 0 |
| Buner | 0 | 7 | 69 | 0 |
| Charsadda | 46 | 22 | 8 | 0 |
| Dera Ismail Khan | 56 | 4 | 0 | 16 |
| Dir Lower | 57 | 15 | 35 | 0 |
| Dir Upper | 0 | 0 | 76 | 0 |
| Hangu | 0 | 0 | 76 | 0 |
| Haripur | 21 | 18 | 23 | 14 |
| Karak | 0 | 0 | 76 | 0 |
| Kohat | 18 | 58 | 0 | 0 |
| Lakki Marwat | 0 | 15 | 61 | 0 |
| Malakand | 12 | 34 | 30 | 0 |
| Mardan | 36 | 32 | 5 | 3 |
| Nowshera | 14 | 0 | 0 | 62 |
| Peshawar | 19 | 7 | 2 | 48 |
| Swabi | 41 | 0 | 0 | 35 |
| Shangla | 0 | 33 | 43 | 0 |
| Swat | 24 | 11 | 32 | 9 |
| Tank | 0 | 61 | 15 | 0 |
Acknowledgements
Not applicable.
Author contributions
Study conception and design: Muhammad Atif and Fazal Shakoor. Data collection: Gohar Ayub and Muhammad Ilyas. Interpretation of results: Muhammad Farooq and Qamruz Zaman. Draft manuscript Preparation: Muhammad Atif and Muhammad Farooq. Supervision: Muhammad Iqbal and Qamruz Zaman. All authors reviewed the results and approved the final version of the manuscript.
Declaration of conflicting interests
The author(s) declared no potential conflicts of interest with respect to the research, authorship, and/or publication of this article.
Funding
The author(s) received no financial support for the research, authorship, and/or publication of this article.
Ethical approval
Our study did not require an ethical board approval because there was no human interaction in this study.
Informed consent
Not applicable.
Trial registration
Not applicable.
Supplemental material
Supplemental material for this article is available online.
References
Supplementary Material
Please find the following supplemental material available below.
For Open Access articles published under a Creative Commons License, all supplemental material carries the same license as the article it is associated with.
For non-Open Access articles published, all supplemental material carries a non-exclusive license, and permission requests for re-use of supplemental material or any part of supplemental material shall be sent directly to the copyright owner as specified in the copyright notice associated with the article.