
Abstract
Objective:
This cross-sectional study examined the association between parental and child-reported correlates and children’s screen time.
Methods:
Children (N = 154) and their parents completed questionnaires examining correlates of screen time. Children recorded the time they devoted to screen-based and study-related sedentary activities and wore a pedometer for 6 days (four weekdays and two weekend days). Parents also provided information relating to the time their children devoted to screen time.
Results:
Children reported significantly higher time watching television and playing electronic games as well as higher total screen time during the weekend compared to weekdays. On the contrary, they reported significantly lower time doing homework and recorded significantly lower steps during the weekend compared to weekdays. The scale ‘Parent-child Television Viewing’ yielded significant associations with both parent and child-reported total screen time and television watching. Associations ranged from r = 0.193, p < 0.05 to r = 0.599, p < 0.001. The scales ‘Child Screen Time with Friends’ and ‘Friends’ Norms for Screen Time’ demonstrated significant associations with child-reported electronic games and total screen time, and with parent-reported electronic games and computer use. Associations ranged from r = 0.180, p < 0.05 to r = 0.478, p < 0.001. Variance explained for total screen time at the multivariate level ranged from 8% to 37% with the scale ‘Parent-child Television Viewing’ having significant associations with both parent and child-reported weekday total screen time.
Conclusions:
Obtaining data from both parents and children may provide further understanding of screen time behaviour. While parental factors appear to be consistently associated with children’s total screen time, studies may consider focusing more on parents to reduce time spent watching television, and more on friends to limit time spent in electronic games.
Introduction
Sedentary behaviour has been defined as any waking behaviour characterized by an energy expenditure ⩽1.5 metabolic equivalents, while in a sitting or reclining posture. 1 Sedentary behaviour may include time spent in screen-based activities or on media.1,2 In children, Screen Time (ST) is associated with severe depressive symptoms and anxiety, 3 adiposity and other markers of cardiometabolic disease risk,4,5 and with shorter sleep duration 6 that may result in reduced academic achievements. 7 It is, therefore, important to reduce ST among children and adolescents in order to decrease the adverse health effects of this behaviour on young people.
A first step in reducing ST is to investigate the correlates of these activities that will help inform the development of intervention programmes. 8 Correlates of sedentary behaviour may include personal characteristics, environmental and social factors. 8 Personal characteristics such as gender have shown null association with sedentary behaviour, while age has shown a positive association. 9 Environmental correlates such as number of television (TV) sets in the house were positively associated with ST among children, 10 while media equipment density was positively associated with adolescent girls’ ST. 11 Studies from the United States 12 and the United Kingdom 13 showed that children who were exposed to fewer media equipment in their bedroom had lower ST. Interestingly, a study carried out among children in the United States showed that the association between the presence of a TV set in the child’s bedroom and TV viewing was much stronger during weekends than weekdays. 14 As children tend to spend more ST during the weekend than during weekdays, 15 future studies should also examine correlates of ST for both of these periods.
Parental practices including ST, co-viewing with the child and rules on children’s ST have also been examined. 8 Studies from the United States 16 and the United Kingdom 13 have showed that parents’ own ST is associated with the child’s ST. Relating to parental co-viewing with the child, studies have revealed contrasting results, with some indicating an association between child and mother TV co-viewing on a weekday 17 and others an association during weekends but not during weekdays. 14 Studies focusing on parental rules have shown a negative association between parental rules and TV viewing among preschool children 18 and adolescents 19 during weekdays but not during weekends.14,17 As most studies have examined parental influences on TV viewing, it would be interesting to examine these influences across different media devices.
Studies have also investigated friends’ influences on children’s ST.19,20 A study conducted among children in Spain indicated that engaging in ST to spend time with friends was associated with primary school boys’ console game playing, 20 while a study among children across eight European countries indicated that friends’ norms and modelling were associated with children’s time spent watching TV. 19 As only a few studies simultaneously examined parental and friends’ factors affecting children’s health behaviours, 19 more studies are needed to examine these social influences on children’s ST.
There is an urgent need to reduce ST among children in Cyprus as evidence indicated that Cypriot children are more likely to exceed the recommended ST guidelines than children from other European countries. 21 A first step in reducing ST in Cyprus is to examine potential correlates. This will also add to the international literature, as more data from all potential correlates are needed. 9 Only one study examined correlates of ST behaviour among 2- to 10-year-old children in Cyprus that included only one environmental correlate. 21 Research has suggested that social variables may constitute more important correlates of children’s ST than physical environmental variables. 22
Furthermore, collecting similar data from different sources may help further extent the knowledge of correlates of children’s ST. For example, it would be interesting if studies collected data on ST from both parents and children. 23 If potential correlates are associated with both parental and child reports of ST, investigators may be more confident of the impact of these correlates on ST behaviour. In addition, by administering instruments measuring similar constructs to both children and parents, researchers can investigate whether parents and children perceive parental practices in different ways and how these perceptions correlate with ST behaviour. 24 Therefore, the purpose of this study was to examine the association between a number of correlates and children’s ST based on both parental and children’s reports.
Methods
Participants
This cross-sectional study is part of a larger study that examined correlates of physical activity and ST among elementary school children in the town of Paphos, Cyprus. A previous study presented the results of the physical activity data, 25 while this study presents the results of ST data. In total, 6 out of the 13 schools in the town of Paphos agreed to take part in the study, and a total of 154 children between 11 and 12 years old and their parents (53.5%) returned signed informed parental/child consent forms to participate. This study was approved by the Cyprus Ministry of Education’s Centre for Educational Research and Evaluation (7.15.01.23/18). Data collection took place during the spring of 2016 (early March to early May). Sample size calculation for the study followed the guidelines for multiple regression analyses that required 104 observations + number of individual predictors or independent variables, or a ratio of 15:1 observations to independent variables.26,27 As in our study, we would examine the possible association of 16 independent variables with children’s ST, a sample size between 120 and 240 was adequate.
Instruments
Parental questionnaire to examine correlates (explanatory variables) of screen time
The parental questionnaire consisted of 23 questions. Four questions (two for weekdays and two for weekends) concerned ‘Parent-child TV Viewing’ and asked parents how much time they: (1) watched TV alone and (2) watched TV with their child. Further four questions (two for weekdays and two for weekends) concerned ‘Parent-child ST’ and asked parents how much time they spent using a computer/tablet/smart phone: (1) alone and (2) with their child. These questions were scored on a seven-point scale with responses including ‘not at all’, ‘up to 30 minutes’, ‘up to one hour’, ‘up to two hours’, ‘up to three hours’, ‘up to four hours’ and ‘more than four hours’ and were derived from previous studies.13,20
Ten questions examined parental practices and rules relating to ST. These questions were adopted from previous studies.17,20,28 Five questions examined parental ‘ST Control’ and asked parents whether they knew/supervised: (1) the programmes, (2) the websites, (3) the games, (4) the time when their child watched TV and (5) the time when their child played electronic games. The other five questions examined parental ‘ST Restrictions’ and asked parents whether they had restrictions on the amount of time their child could: (1) watch TV, (2) use the computer, (3) play electronic games, (4) use the tablet and (5) use the smart phone. These questions were scored on a four-point response format, ranging from ‘strongly disagree’ to ‘strongly agree’. The last five questions were related to the media equipment available at home including the number of TVs, the number of screen devices and whether the child owned a smart phone or a tablet, or had a computer and a TV in his or her bedroom.
Children’s questionnaire to examine correlates (explanatory variables) of screen time
The child questionnaire consisted of 20 questions. The first 10 questions examined children’s perceptions of parental ‘ST Control’ and parental ‘ST Restrictions’ and were identical to the ones included in the parental questionnaire. The next four questions (two for weekdays and two for weekends) examined ‘Parent-child ST’ and asked children whether their parents or other adults spent a lot of time in front of the computer/tablet/smart phone or watching TV: (1) alone and (2) with their child. Another four questions, adopted from a previous study, 29 examined ‘Friends’ Norms for ST’ and asked children whether their friends: (1) believed that watching TV is a good thing, (2) believed that playing electronic games is a good thing, (3) spent a lot of time playing games and (4) spent a lot of time watching TV. These scales were scored on a four-point response format, ranging from ‘strongly disagree’ to ‘strongly agree’. The last two questions concerned ‘Child ST with friends’ and asked the weekly frequency with which the child played electronic games: (1) at a friend’s house and (2) on the Internet with friends. These two items were scored on a six-point scale, with responses including ‘not at all’, ‘once’, ‘two times’, ‘three times’, ‘four times’ and ‘more than four times’. Table 1 provides a description of parental and child-reported correlates of ST and Supplemental Appendix Questionnaire S1 and Questionnaire S2 present the English versions of the parental and the children’s questionnaires, respectively.
Description of the correlates of screen time used in the study.
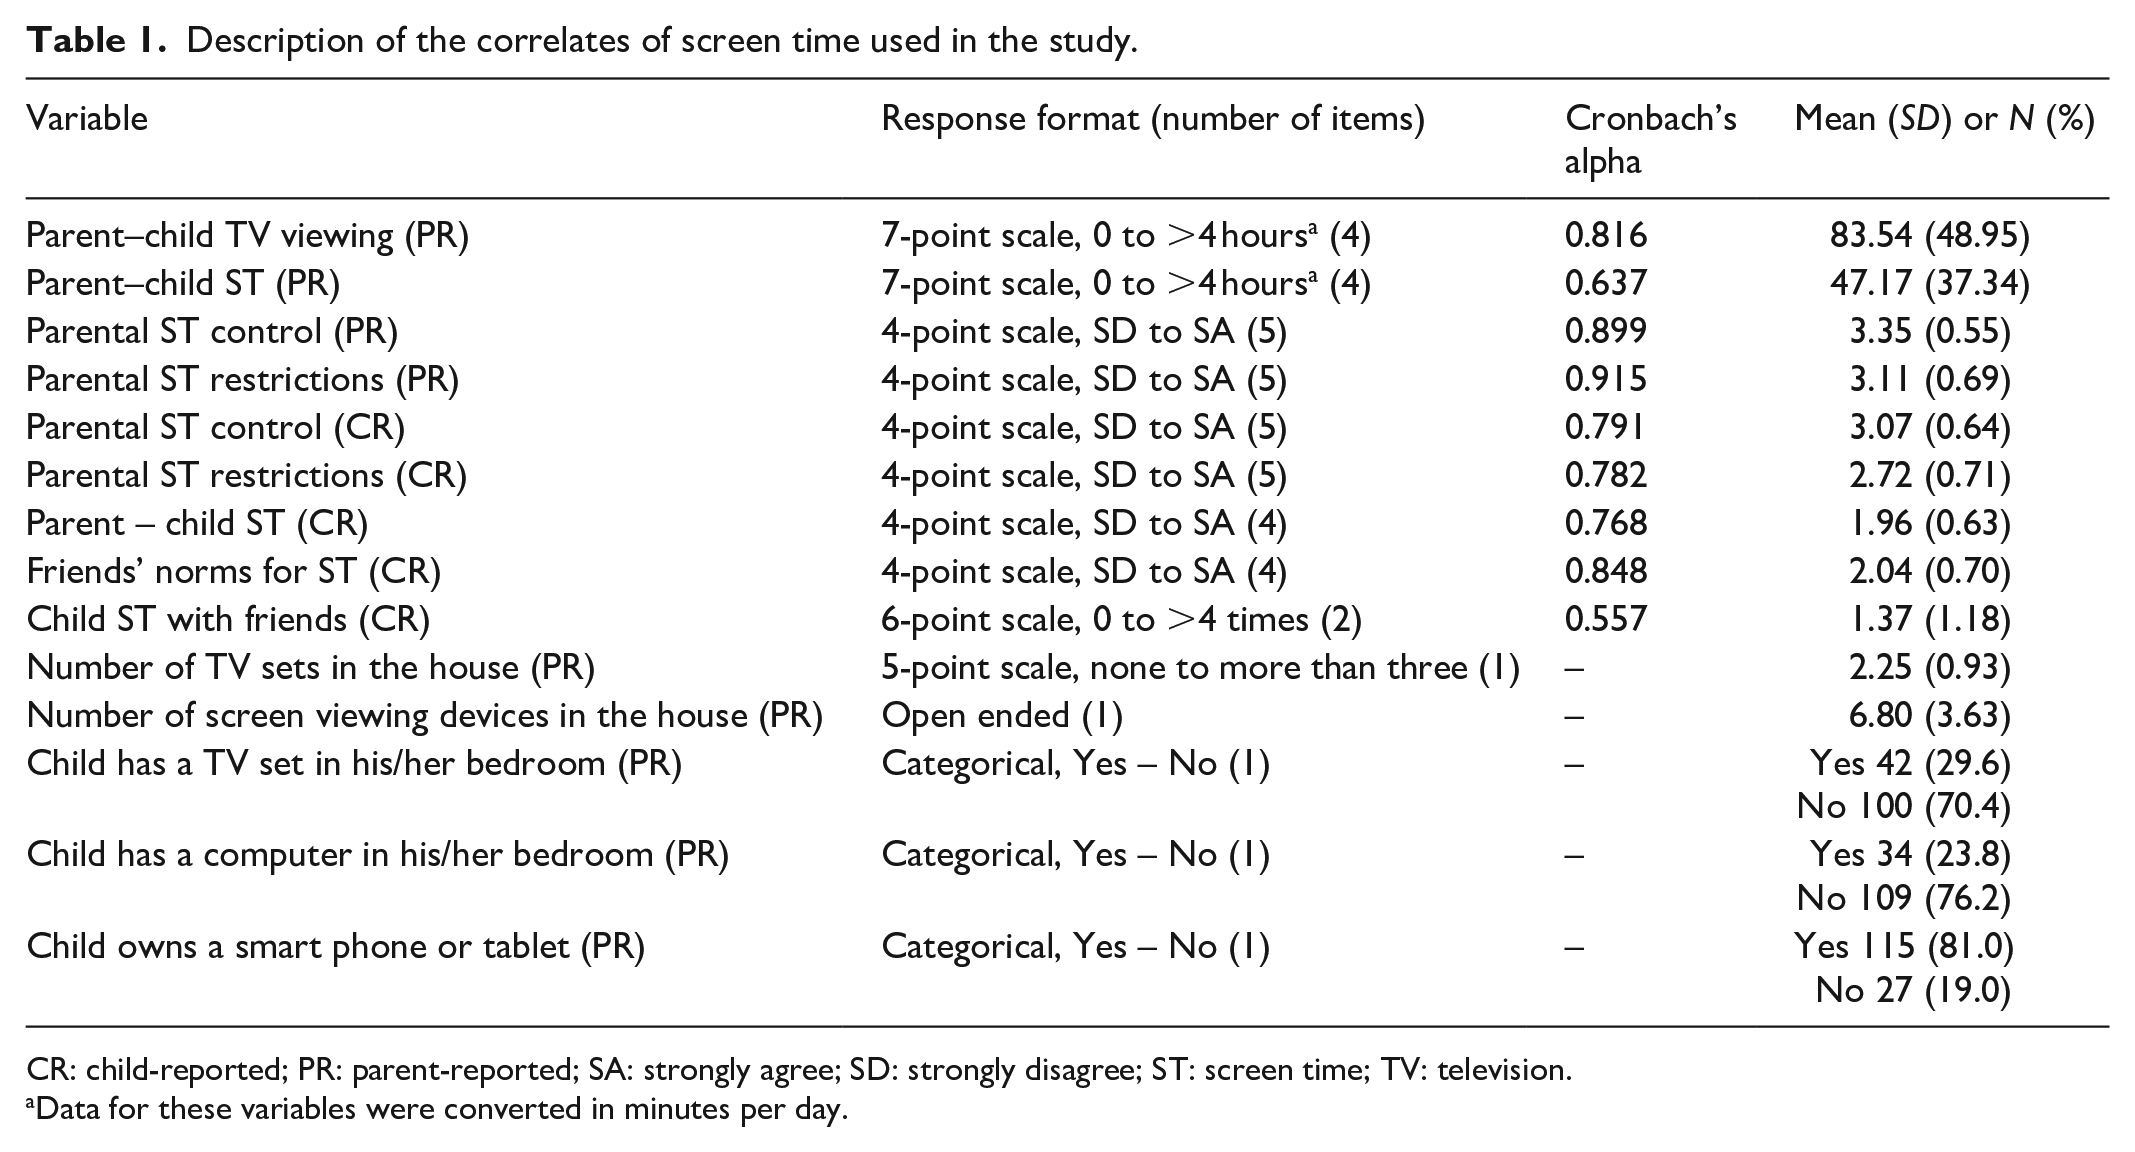
CR: child-reported; PR: parent-reported; SA: strongly agree; SD: strongly disagree; ST: screen time; TV: television.
Data for these variables were converted in minutes per day.
Sedentary behaviour (screen time and study-related variables) and physical activity measurement
Children’s time spent on sedentary activities was also assessed using both, parental and child reports. Parents reported on their child’s TV viewing and multi-screen use by responding to four items: ‘During weekdays, how much time does your child watch TV’, and ‘During weekdays, how much time does your child spend using the computer/tablet/smart phone or playing X-Box/PlayStation?’ The same two items were used to obtain information for the weekend. These questions were adopted from previous studies of parental reports of their children’s ST.12,13 Based on this information, three measures for weekday ST were calculated. These included estimates of the daily time spent: (1) watching TV, (2) using the computer/tablet/smartphone or playing X-Box/PlayStation and (3) on total ST (by averaging the values from the two previous items). The same three measures of ST were obtained for the weekend.
Children were also asked to record the time they spent on different sedentary activities on a diary every day for 6 days (including four school days and two weekend days). These activities included three ST activities (TV watching, electronic games and computer use) and two study-related activities including homework and after-school private lessons’ attendance. Self-report diaries have been widely used to assess sedentary behaviour in children.30,31 Based on this information, four measures of ST were obtained. The data of the four weekdays collected were averaged, and thus a mean daily value of each screen media device was obtained including the following: (1) TV watching, (2) electronic games playing and (3) computer use. Furthermore, the mean time for these three devices was averaged to obtain a mean value of total ST. The same four measures of ST were obtained for the weekend. Questions for both instruments (parental reports and the child’s diary) were scored on a seven-point scale, with responses including ‘not at all’, ‘up to 30 minutes’, ‘up to one hour’, ‘up to two hours’, ‘up to three hours’, ‘up to four hours’ and ‘more than four hours’.
Children’s physical activity was monitored for the same 6 days using the DW-200 YAMAX pedometer (Yamax Corporation, Tokyo, Japan). This pedometer has been shown to be valid and reliable among children and is the most widely used instrument in surveillance studies. 32 Furthermore, its low cost and ease of use make it an appropriate instrument for measuring physical activity in low-budget studies. Supplemental Appendix Diary S3 and Recording Card S4 present the English versions of the children’s diary and pedometer steps recording cards, respectively.
Procedures
Before the administration of the questionnaires, a pilot study was conducted with 6 parents and 23 children to ensure that participants understood the items and the response scales. For the main study, two research assistants visited the schools to administer the questionnaires, instruct the children on how to use the pedometer and measure children’s weight and height in the presence of school teachers. Children’s height and weight for the calculation of the body mass index (BMI, kg/m2) were measured using a portable stadiometer (SECA 220, Hamburg, Germany) and digital scale (SECA 767, Hamburg, Germany). The parental questionnaires were given to the children to take home for completion. The children recorded their steps and completed the time they devoted to each of the five sedentary activities on a diary at the end of each day before going to bed for four weekdays and for two weekend days. Children fitted and reset the pedometer at their waist in the morning before coming to school and removed the pedometer at night before going to sleep (except when bathing or swimming).
Statistical analyses
Means and standard deviations for scales and numeric variables, and frequencies and percentages for categorical variables were computed to describe children’s correlates of ST. Cronbach’s alpha coefficients were also computed to examine the internal consistency reliability of each of the scales adopted.
In total, seven measures of children’s weekday ST (and seven for weekend ST) were calculated, three from parental reports and four from children’s reports. Spearman correlation coefficients were computed between these measures of ST to examine whether parental reports of children’s ST were associated with children’s reports of ST. Means and standard deviations were computed to describe children’s time spent on sedentary activities and the pedometer-determined steps/day. The time spent on sedentary activities is presented in minutes per day. The percentage of children meeting existing ST guidelines 2 and daily step guidelines 33 was also computed.
Paired sample t-tests and chi-square tests were computed as appropriate to investigate possible differences in sedentary activities and physical activity across weekdays and weekends. Spearman correlation coefficients were then computed to examine the association between the correlates and the ST variables. Correlates that were significantly associated with total ST at the bivariate level were entered in regression models to examine the percentage of variance accounted for total ST. In total, four regressions models were computed, one for weekday and one for weekend child-reported total ST, and one for weekday and one for weekend parent-reported total ST. Because the distribution of total ST (dependent variable) was skewed, logarithmic transformations were conducted that significantly improved the distributions of each of the four dependent variables. Statistical analyses were performed using IBM SPSS Statistics Version 20 (IBM Software Group, Chicago, IL) and the significance level was set to 0.05.
Results
Descriptive findings
Of the 154 children who participated in the study and completed the questionnaire, 61 or 39.6% were boys and 93 or 60.4% were girls. Children’s mean BMI was 20.3 ± 4.2, 25 and according to international cut-off points for BMI, 34 104 or 68.0% were normal weight, 36 or 23.5% were overweight and 13 or 8.5% were obese. In total, 125 children and 118 children provided complete data that examined the time that they devoted to sedentary activities for weekdays and weekends, respectively, and 144 parents completed the parental questionnaire. In total, 141 children and 126 children provided complete data for step counts for weekdays and weekends, respectively. Table 1 presents descriptive statistics of the correlates of ST examined in the study. Internal consistency reliability coefficients of the scales used in this study ranged from α = 0.557 to α = 0.915. In total, 42 children or 29.6% and 34 children or 23.8% had a TV set and a computer in their bedroom respectively, while 115 children or 81.0% had a smart phone or a tablet.
Associations between parental reports and children’s reports of the child’s screen time
Significant associations were observed between parental reports of their child’s TV watching and TV watching based on children’s report for both weekdays (r = 0.425, p < 0.001) and weekends (r = 0.267, p < 0.01). Likewise, significant associations were observed between parental reports of their child’s computer/tablet/smart phone or X-Box/PlayStation time and children’s reports of electronic games playing for both weekdays (r = 0.446, p < 0.001) and weekends (r = 0.353, p < 0.001). As far as total ST is concerned, significant associations were noted between parental reports of their child’s total ST and total ST based on the children’s report for both weekdays (r = 0.406, p < 0.001) and weekends (r = 0.302, p < 0.01).
Differences in sedentary behaviour (screen time and study-related variables) and physical activity across weekdays and weekends
Table 2 presents descriptive statistics of child and parent-reported sedentary behaviour and physical activity. Parents reported significantly higher time watching TV (p < 0.05) and children significantly higher time watching TV (p < 0.01) and playing electronic games (p < 0.01), as well as a higher total ST (p < 0.001) during weekends compared to weekdays. On the contrary, children reported significantly more studying time (p < 0.001), more private lessons’ attendance (p < 0.001) and higher step counts (15970 ± 4749 vs 13871 ± 5523, p < 0.001) during weekdays as opposed to weekends. A significantly higher percentage of parents met TV (p < 0.001) and total ST guidelines (p < 0.001) and a higher percentage of children met total ST guidelines (p < 0.05) during weekdays compared to weekends. A significantly higher percentage of girls met steps/day guidelines (p < 0.05) during weekdays as opposed to weekends.
Means and standard deviations of child and parent-reported time spent in sedentary activities, pedometer-determined physical activity and percentages of participants meeting screen time and physical activity guidelines.

SD: standard deviation.
p <0.05.
p < 0.01.
p < 0.001.
Bivariate associations between child-reported screen time and potential correlates
Table 3 presents the bivariate associations between child-reported ST and potential correlates. The scale ‘Child ST with friends’ demonstrated four significant associations with weekday and weekend electronic games and total ST with associations ranging from r = 0.245, p < 0.01 to r = 0.478, p < 0.001. Four significant associations were also observed between the scale ‘Friends’ Norms for ST’ and weekday and weekend electronic games and total ST, with associations ranging from r = 0.198, p < 0.05 to r = 0.317, p < 0.001. Having a computer in the child’s bedroom was associated with higher computer use in both weekdays and weekends and with less TV watching during weekdays. The scale ‘Parent-child TV Viewing’ was associated with weekday TV watching and weekday total ST. Having a TV set in the child’s bedroom was associated with more computer use during weekdays and with less electronic games during weekends. The child-reported scale ‘Parent-child ST’ was associated with higher weekday electronic games playing and total ST. Physical activity demonstrated a significant association with weekend TV watching, and BMI with weekend computer use.
Bivariate associations between child-reported screen time and potential correlates (significant associations in bold).

COMP: computer; EG: electronic games; ST: screen time; TST: total screen time; TV: television.
p <0.05.
p < 0.01.
p < 0.001.
Parent-reported.
Child-reported.
Yes = 1, No = 2.
Bivariate associations between parent-reported screen time and potential correlates
Table 4 presents the bivariate associations between parent-reported ST and potential correlates. The scale ‘Parent-child TV Viewing’ yielded significant associations with all ST variables for both weekdays and weekends, with associations ranging from r = 0.256, p < 0.01 to r = 0.599, p < 0.001. The parent-reported scale ‘Parent-child ST’ revealed significant associations with weekday and weekend computer use and electronic games playing and total ST with associations ranging from r = 0.202, p < 0.05 to r = 0.317, p < 0.001. Having a computer in the child’s bedroom was associated with less TV watching during weekdays and with less TV watching, electronic games and computer use, and total ST during weekends. The scale ‘Child ST with friends’ demonstrated significant associations with weekday and weekend electronic games and computer use, and the scale ‘Friends’ Norms for ST’ was associated with weekend electronic games and computer use.
Bivariate associations between parental-reported screen time and potential correlates (significant associations in bold).

COMP: computer; EG: electronic games; ST: screen time; TST: total screen time; TV: television.
p <0.05.
p < 0.01.
p < 0.001.
Parent-reported.
Child-reported.
Yes = 1, No = 2.
Regression analysis results of total screen time and potential correlates
Table 5 presents the results of the four regression models examining the associations between weekday and weekend child and parent-reported total ST and potential correlates. For weekday child-reported total ST (model 1), the variables ‘Parent-child TV viewing’ and ‘Child ST with friends’ contributed significantly to the model accounting for 14% of the variance. The relative importance of the variable ‘Child ST with friends’ (β = 0.294) to the regression model was higher than that of the variable ‘Parent-child TV viewing’ (β = 0.207). For weekend child-reported total ST (model 2), the variables ‘Friends norms for ST’ and ‘Child ST with friends’ contributed significantly to the model explaining 8% of the variance. Both variables had a comparable degree of importance in the model (β = 0.202 for ‘Friends norms for ST’ and β = 0.196 for ‘Child ST with friends’). For weekday parent-reported total ST (model 3), the variable ‘Parent-child TV viewing’ was the only significant contributor to the model that explained 20% of the variance, while for weekend parent-reported total ST (model 4), ‘Parent-child TV viewing’, ‘Parent-child ST’, and having a computer in the child’s bedroom contributed significantly to the model explaining 37% of the variance. The variable ‘Parent-child TV viewing’ had the highest relative importance to the model (β = 0.448), while the variables ‘Computer in the child’s bedroom’ and ‘Parent-child ST’ had a lower degree of relative importance to the model (β = 0.256 and β = 0.160, respectively).
Regression analysis results for child and parent-reported weekday and weekend total screen time and potential correlates.
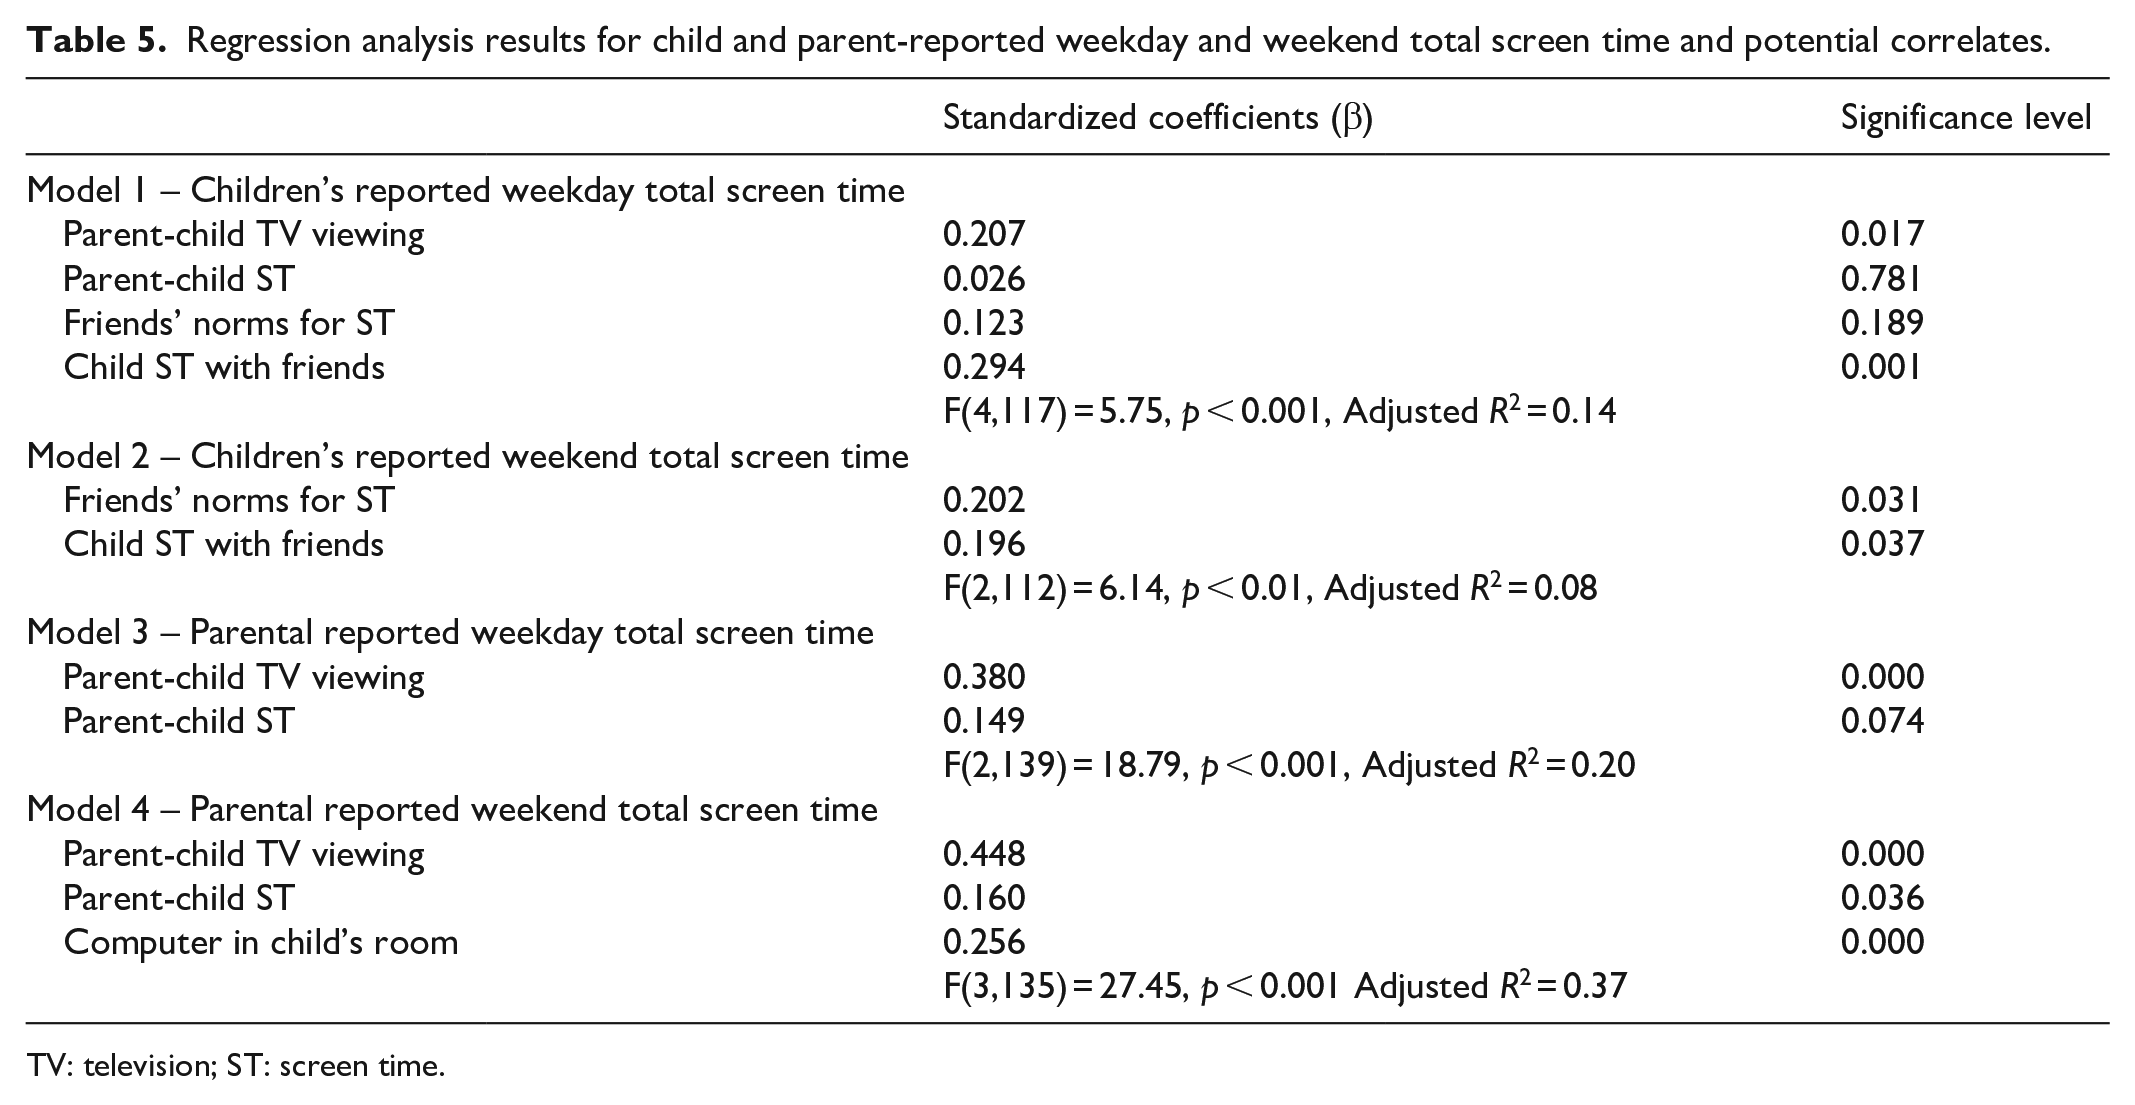
TV: television; ST: screen time.
Discussion
In accordance with previous studies which investigated children’s 15 and children’s and parents’ ST, 14 participants in this study spent more ST during weekends in comparison to weekdays. In this study, percentages of children meeting total ST guidelines based on child report ranged from 72.0% for weekdays to 59.7% for weekends, while the respective percentages based on parent report were 42.4% and 38.6%. These findings are somewhat comparable to findings from a study among eight European countries that found that 81.0% during weekdays and 42.0% during weekends of Cypriot children met total ST guidelines. 21
The finding that the percentages of children meeting ST guidelines varied based on who provided the reports (parent proxy report or children’s report) is worth mentioning. The discrepancies ranged from 7.9% for weekday TV watching to 29.6% for weekday total ST (see Table 2 for the percentages of children meeting guidelines). Future research should further explore this issue, as study findings and comparisons between different studies may be influenced based on who, parent or child, provided ST reports. Interestingly, moderate associations were observed between parental reports of the child’s ST and ST based on children’s reports, with higher associations observed during weekdays than weekends. Studies have shown that children and parents appear more able to recall sedentary behaviour on weekdays than weekends, probably due to the more structured nature of weekdays. 14
Data from this study showed that children recorded significantly lower step counts during the weekends in comparison to weekdays, a finding that strengthens previous evidence from accelerometer studies that showed that children engage in lower moderate to vigorous and lower total physical activity at weekends than on weekdays. 35 Furthermore, they engaged in less time studying and attending private lessons during weekends. The lower physical activity and the less time devoted to private lessons and studying during weekends, may suggest that children replace these activities with ST. These observations, coupled with the fact that children do not attend schools during weekends, may explain the increased ST observed during weekends in comparison to weekdays. Intervention programmes to reduce ST should especially target weekend days.
Correlates of ST that were found to be significantly associated with both parent and child reports of ST, are more likely to influence behaviour. These included ‘Parent-child TV Viewing’, ‘Parent-child ST’, ‘Child ST with friends’, ‘Friends’ Norms for ST’ and having a computer in the child’s bedroom. The scale ‘Parent-child TV Viewing’ yielded eight significant associations at the bivariate level, six with all parent-reported ST variables, one with child-reported weekday TV watching, and one with child-reported weekday total ST. Most importantly, this scale was the only one significantly associated with both, weekday child and parent-reported total ST in the regression analyses with the models explaining 14% and 20% of the variance, respectively. These results support those of previous studies that found that parental TV viewing was associated with children’s TV viewing. 36
While in this study, the associations of ‘Parent-child TV Viewing’ were stronger for TV watching at the bivariate level, there was also evidence of smaller associations with computers and electronic games. The parent-reported scale ‘Parent-child ST’ revealed significant associations with all parent-reported ST variables except for TV watching, and was associated with parent-reported weekend total ST at the multivariate level. The child-reported scale ‘Parent-child ST’ showed small associations with weekday electronic games and total ST based on children’s ST reports. Previous studies conducted among younger children have also shown higher associations with parental TV and child TV watching in comparison to other media equipment.13,16 The finding that the TV specific scale was more strongly associated with both children’s reports and parental reports of ST suggests that parents may have more impact on children’s TV time rather than on other devices, including computers and electronic games. Interestingly, the parent-reported scale ‘Parent-child TV viewing’ exhibited higher internal consistency reliability than the ‘Parent-child ST’ scales, indicating higher interrelatedness between the statements. 37 This may suggest that parents consider TV viewing as a family behaviour, while they view the use of other electronic devices as individual or non-family behaviours. The present findings suggest that parental role modelling, that includes parental own ST and ST co-use with the child, are important correlates that should be targeted in intervention studies to reduce children’s ST, especially with regard to TV watching.
An important finding of this study was the association observed between the scales ‘Child ST with friends’ and ‘Friends’ Norms for ST’ with child-reported weekday and weekend electronic games playing and total ST. The significance of this finding is further enhanced, as the scale ‘Child ST with friends’ was associated with parent-reported weekday and weekend electronic games and computer use and the scale ‘Friends’ Norms for ST’ was associated with weekend electronic games and computer use. At the multivariate level, the scales ‘Child ST with friends’ and ‘Friends’ Norms for ST’ were associated with child-reported weekend total ST and the scale ‘Child ST with friends’ was associated with child-reported weekday total ST, with the overall models accounting for 8% and 14% of the variance, respectively. The findings of this study are consistent with previous research that showed that friends’ norms and modelling were associated with children’s TV viewing. 19 This study suggested that friends are more likely to influence children’s electronic games and computer use, rather than TV watching. Friends may be more influential on the use of new mobile media technologies that can be used away from the house. These data may supplement results from a qualitative study conducted in the United Kingdom, which found that friends may influence children’s remote online gaming. 38
Having a computer in the child’s bedroom was associated with a higher time of weekday and weekend computer use based on children’s report at the bivariate level, but was unexpectedly associated with less ST during the weekend according to parental reports, both at the bivariate and multivariate level. A possible explanation might be that during weekends, when children have more free time, parents may be less attentive of their children’s activities. The current findings complement other studies which showed that the effects of having a computer in the bedroom on sedentary time were much larger than those of having a TV set. 23 Nevertheless, findings of this study contradict those of previous studies that have found that the presence of a TV set in a child’s bedroom was associated with higher TV watching. 39 These discrepancies may be explained by the lower percentage of children in our study reporting having a TV in their room (29.6%) in comparison to studies in the United Kingdom 40 and in the United States, 39 where percentages ranged from 70.9% to 42.5% and 53.8%, respectively.
The lack of association between the number of media devices in the house and ST, in this study, may also be explained by the fewer TV sets and media devices reported by participants in this study compared to other studies.10,11 For example, a lower mean number of media devices (6.8 ± 3.6) was reported in this study in comparison to those reported (10.6 ± 4.5) in a study from the United States. 11 Our findings corroborate those of studies among European children that showed that the number of screen devices in the house is not associated with ST. 40 Having a smart phone or a tablet was not associated with any ST, but the large percentage of children in this study, that reported having these devices, raises the need for future studies to examine correlates of these specific media devices. Interestingly, a recent study among 9- to 12-year-old Saudi Arabian children showed that obese children, especially boys, owned more smartphones than normal weight children. 41 The fact that these devices are portable means that they can be used in different places 40 other than the house, and therefore, investigating the correlates of time spent in these devices remains a challenge for researchers.
Contrary to findings from studies that examined the association between parental rules with single items and children’s TV viewing,18,19,36 our results did not show a negative association between parental rules and children’s ST but revealed three small positive associations. This unexpected finding is difficult to interpret, but it may be that rules are likely made in response to children’s behaviour. Interestingly, Bjelland et al. 28 showed that the presence of rules was positively associated with parent-reported perceived excessive computer and console games playing.
Two small associations at the bivariate level, one for physical activity and one for BMI are worth discussing. Based on children’s weekend report, those who watched more TV engaged in less physical activity and those who spent more time on the computer had a higher BMI. It is interesting that both of these associations were observed to happen during weekends, indicating that the possible adverse effects of ST engagement on physical activity and adiposity may be more pronounced during this time. Nevertheless, the magnitude of associations observed are consistent with previous findings which indicate that adiposity and physical activity have small associations with sedentary behaviour.4,42
While this study appears to be the first to examine potential correlates of ST from different domains in the Cypriot context, a number of limitations should also be considered. First, the small sample size from a single town in the island of Cyprus limits generalizations to other populations and may have suppressed possible associations at both the bivariate and multivariate level. Second, the cross-sectional design of the study prevents the inference of cause and effect relationships between explanatory variables and ST. Third, the parallel use of accelerometers would provide more valid data, but the use of self-reports is still a cost-effective option for non-funded studies and essential for obtaining information relating to specific ST devices. 43
Conclusion
This study showed more prevalence of ST during weekends than weekdays, and future intervention efforts should especially target weekend days to reduce children’s ST. Scales and other explanatory variables in this study that exhibited consistent significant associations with both parent and children’s reports of ST, should be taken into account when implementing intervention programmes. At the multivariate level, parents’ own time spent watching TV and co-viewing with the child was the only variable associated with total ST. For TV watching at the bivariate level, these included parents’ own time spent watching TV and co-viewing with the child, while for computers and electronic games at the bivariate level, these included friends’ norms and practices as well as whether the child meets friends to play electronic games. These findings suggest that potential intervention studies to reduce ST may need to focus more on the family to reduce the time spent watching TV, and more on friends to limit the time spent on other devices, including computers and electronic games.
Supplemental Material
Supplemental_Appendix – Supplemental material for Screen time behaviour in a sample of 11- to 12-year-old Greek-Cypriot children: A cross-sectional study of parental and child reports
Supplemental material, Supplemental_Appendix for Screen time behaviour in a sample of 11- to 12-year-old Greek-Cypriot children: A cross-sectional study of parental and child reports by Constantinos A Loucaides in SAGE Open Medicine
Supplemental Material
Supplemental_material_1 – Supplemental material for Screen time behaviour in a sample of 11- to 12-year-old Greek-Cypriot children: A cross-sectional study of parental and child reports
Supplemental material, Supplemental_material_1 for Screen time behaviour in a sample of 11- to 12-year-old Greek-Cypriot children: A cross-sectional study of parental and child reports by Constantinos A Loucaides in SAGE Open Medicine
Footnotes
Acknowledgements
The author would like to thank the head teachers and teachers of the participating schools, and especially, the children and their parents for participating in this research.
Declaration of conflicting interests
The author(s) declared no potential conflicts of interest with respect to the research, authorship, and/or publication of this article.
Ethical approval
Ethical approval for this study was obtained from The Cyprus Ministry of Education’s Centre for Educational Research and Evaluation (7.15.01.23/18).
Funding
The author(s) received no financial support for the research, authorship, and/or publication of this article.
Informed consent
Written informed consent was obtained from all subjects, both legally authorized representatives/parents of children and children, before the study.
Supplemental material
Supplemental material for this article is available online.
References
Supplementary Material
Please find the following supplemental material available below.
For Open Access articles published under a Creative Commons License, all supplemental material carries the same license as the article it is associated with.
For non-Open Access articles published, all supplemental material carries a non-exclusive license, and permission requests for re-use of supplemental material or any part of supplemental material shall be sent directly to the copyright owner as specified in the copyright notice associated with the article.