
Abstract
Context:
Poorly written radiology reports are common among residents and are a significant challenge for radiology education. While training may improve report quality, a professionally developed reliable and valid scale to measure report quality does not exist.
Objectives:
To develop a measurement tool for report quality, the quality of report scale, with rigorous validation through empirical data.
Methods:
A research team of an experienced psychometrician and six senior radiologists conducted qualitative and quantitative studies. Five items were identified for the quality of report scale, each measuring a distinct aspect of report quality. Two dedicated training sessions were designed and implemented to help residents generate high-quality reports. In a blinded fashion, the quality of report scale was applied to 804 randomly selected reports issued before (n = 403) and after (n = 401) training. Full-scale psychometrical assessments were implemented onto the quality of report scale’s item- and scale-scores from the reports. The quality of report scale scores were correlated with report professionalism and attendings’ preference and were compared pre-/post-training.
Results:
The quality of report scale showed sound psychometrical properties, with high validity and reliability. Reports with higher quality of report scale score were more professional and preferable by attendings. Training improved the quality of report scale score, empirically validating the quality of report scale further.
Conclusion:
While succinct and practitioner friendly, the quality of report scale is a reliable and valid measure of radiology report quality and has the potential to be easily adapted to other fields such as pathology, where similar training would be beneficial.
Introduction
Teaching residents how to compose clinic reports is an important component of medical education. It has special significance in radiology resident training, where the written report is the main method for transmitting results to clinicians. However, in many training programs, radiology residents receive little, if any, formal instruction in report generation. 1 Instead they learn to dictate reports by emulating faculty or other residents, copying the style and format of old reports, or by using pre-determined templates. 2 This often leads to confusion as faculty and residents frequently have dissimilar reporting styles and preferences. Subsequently, residents lack a clear understanding as to the importance of the information within and the style and appearance of their reports, and they may produce reports that are disjointed, lacking clear focus and structure. A core educational program dedicated to instruction on the generation of radiology reports could provide the necessary information allowing residents to compose high-quality reports. However, assessing the effectiveness of such a dedicated training program requires a reliable and valid scale of radiology report quality. Although few groups have published their guidelines for measuring and assessing report quality,3–5 a professionally developed, valid, and reliable scale for the determination of radiology report quality is not available. Professionally developing a new scale is fraught with many challenges including ascertaining the appropriate expertise, time, and resources to complete the project, which may not be practical for most health researchers.6,7 This dilemma was echoed by Teresi and Fleishman, 8 who stated that few of the measures used in health sciences and medical education research have been “professionally developed” (i.e. developed by an interdisciplinary team of content experts and psychometricians and evaluated with rigorous psychometrical tests). Moreover, some “gold standard” scales have been proven to be inadequate instruments.9,10
In order to fill the gap, following guidelines published by DeVellis 11 and more recently by Artino et al., 6 we designed our study to professionally develop and validate a succinct rating scale, the quality of report scale (QRS), to measure the quality of radiology reports by establishing an interdisciplinary team of content experts (diagnostic attending radiologists) and a methodology expert (experienced psychometrician and biostatistician). Then, through close collaboration, we conducted a mixture of qualitative (focus group interviews) and quantitative (full-scale psychometric assessments and additional statistical analysis) studies. We hypothesized that the qualitative studies would lead to a scale with items meaningful to content experts and that the quantitative studies on the data collected using this scale would verify its sound psychometric properties. We also hypothesized that the new scale score of report quality would be closely correlated with the perceived level of professionalism in resident reports and in attendings’ preference of the reports and that dedicated training sessions would lead to improved quality scores from this new scale, offering additional empirical evidence for the validity of this new scale.
Methods
The Investigational Review Board (IRB) at our institute approved this study with waiver of informed consent. The study was also compliant with the Health Insurance Portability and Accountability Act (HIPAA).
Establishing an interdisciplinary research team
By nature, professional scale development and validation is an endeavor fraught with challenges.6,7,11 It requires expertise from at least two fields: the content under study and psychometrics. To address these challenges, our first step was to build an interdisciplinary research team that possessed the needed expertise and the ability to collaborate closely on the project. The interdisciplinary research team consisted of a group of academic radiologists with strong interest in resident education and an experienced psychometrician and biostatistician. As the faculty were all staff at the same institution, they were able to collaborate closely during the project, which further strengthened the power of the interdisciplinary research team to address the many challenges of developing and validating a professional measurement scale.
Focus group interviews
Focus group interviews are a method of qualitative research data collection consisting of dedicated interviews on a topic with a group of usually 6 to 10 people with strong interest or knowledge on the topic. 12 The focus group was charged with developing and formatting the scale used in the field test.6,7,11 From the Department of Radiology, we recruited seven radiologists who had expertise and interest in radiology report quality. All radiologists participated in the focus group discussions.The American College of Radiology (ACR) guidelines for diagnostic imaging reports 5 were rigorously followed when deciding the components (items) of the scale. In order to limit the burden associated with administering the scale, 13 we specifically created an instrument with as few items as possible and made the calculation of scale scores as easy as possible (a simple summation). Our goal was that the new scale would take less than 10 min to be administered and that it would be practitioner friendly making it more likely to be used in practices.
With the assistance of senior librarians at our institute, we conducted multiple rounds of intensive literature review on radiology report quality assessment. The database we searched included but was not limited to the ERIC, Google Scholar, MEDLINE (Ovid), PsycINFO, PubMed, and Science Citation Index Expanded (SCI-EXPANDED). We identified five distinct areas as critical components influencing report quality: report appearance, report organization, language utilization, readability, and the ability to find pertinent information. To evaluate each of these five areas, a dedicated report scale, the QRS, was developed. The QRS consisted of responses to each of the five items, formatted as Likert-type, coding responses ranging from 1 (poor), 2 (below average), 3 (average), 4 (good), to 5 (excellent). Responses from the QRS scale were summed, producing an overall summary score (the QRS score) ranging from 5 to 25, with higher scores representing better report quality. The research team agreed that it was imperative to add two additional single-item scales, one for “professionalism” and another for “report preference,” asking reviewers if the report was one that they would like to receive when ordering imaging studies. The answers to the “professionalism” item were coded as those for the QRS items, and the answers to the “report preference” item were coded as 1 (never), 2 (only if forced), 3 (average), 4 (yes, again), and 5 (most definitely!). Details of the QRS and the two single-item scales are listed in Appendix 1.
Dedicated training sessions on report generation
Based on the ACR guidelines, 5 two dedicated training sessions were designed and implemented by a core group of academic radiologists with strong interest in helping residents generate high-quality radiology reports. Session A focused on the basic elements of report generation, and session B, given by subspecialist radiologists, was designed to educate residents in the generation of subspecialist reports, including modality-specific reports and the use of itemized reports. Session B also included a dedicated hands-on experience in privately editing reports at a workstation followed by group assessment of the edits. All diagnostic radiology residents at our facility were required to participate in the training sessions. Both sessions occurred simultaneously and were administered twice. The residents were randomly divided into two equal groups, one starting with session A, and the other with session B. After completion of the first session, the residents switched, completing both sessions.
Assessing report quality using the new scale
The new scale was used by a select group of academic radiologists to assess the quality of reports generated by radiology residents in post graduate year (PGY) 3, 4 and 5, before and after the dedicated training sessions. Each radiologist was provided detailed instructions and examples of the Likert scale categories for each of the five QRS items. Reports were randomly selected from the picture archiving and communication system (PACS). Although they participated in the training session, reports generated by PGY2 residents were excluded from the study because they had not dictated reports in both the 6-month period before and after the training session. Reports from four study types were selected: computed tomography of the head, computed tomography of the abdomen with or without images of the pelvis, abdominal radiographs, and chest radiographs. All identifiers in the reports were removed utilizing a computerized word processing program, including patient name and medical record number, referring clinician identifiers, dictating resident and attending identifiers, date of examination, and addendums and comments regarding emergent notification of findings. Although it would be ideal for research purposes to match reports dictated before and after training to the same resident, per the recommendations of our IRB, no effort could be made to do so.
The select group of radiology attendings reviewing the reports included one neuroradiologist and four abdominal imaging radiologists. The reviewers evaluated 804 reports (403 dictated 1–6 months prior to the training session and 401 dictated 1–6 months after the training session), using the QRS, which was attached to each de-identified report. They independently assessed de-identified reports unique to them, presented in a randomized and blinded fashion. Once completed, the reports and the QRS forms were collected by the project leader and the data entered into a computerized spreadsheet with double-entry in order to check for potential data entry errors.
Psychometrical assessments of the QRS
In order to thoroughly investigate the psychometric properties of the new QRS scale, intensive full-scale psychometric assessments were implemented on the data at the item-, dimension-, and measure-level. These included item analysis, item–scale correlations, confirmatory factor analysis (CFA), and reliability analysis using Cronbach’s alpha.
Item analysis
The basic psychometric property for an item is its variability.13,14 For each of the five items, a frequency table of grades was generated, designating an item with good variability as having none of its grades either less than 5% or greater than 95% among the reports. 15
Item–scale correlations
A good item shall substantially correlate with the dimension it belongs to, and item–scale correlation is a measure for this property. 14 There are two types of item–scale correlations: uncorrected and corrected. While the uncorrected item–scale correlation represents the degree of representatives the item has to the whole scale, the corrected one represents how closely the item is correlated to other items in the dimension.
Correlation matrix among the scores from items and the QRS
Correlations among items play a key role for a measure.14,16 Within the QRS scale, the five items should correlate closely with each other, and each of them shall correlate highly with the QRS score.
CFA
Factorial validity of the QRS assesses if the variation of scores from the five items is caused by variation of a single latent trait: report quality. CFA is the appropriate technique to assess factorial validity,17,18 and the following popular model fit indices from CFA were used:17,19 comparative fit index (CFI) and Tucker–Lewis index (TLI) greater than 0.95, root mean square error of approximation (RMSEA) less than 0.08, and standardized root mean square residual (SRMR) less than or equal to 0.08. However, the QRS’ factorial validity was not denied solely because it had few unsatisfying model fit indices given the large sample size of this study,17,20,21 since it is well-known that some model fit indices can be heavily affected by large sample size. 20
Reliability analysis
To determine whether the QRS was reliable as an overall measurement of quality, Cronbach’s alpha 22 was calculated to assess its internal consistency reliability. This statistic is a measure of how closely the five distinct aspects of the reports correlate with each other so that they are internally consistent to measure the single construct 23 of report quality. A Cronbach’s alpha greater than 0.7, 0.8, and 0.9 indicates “adequate,” “very good,” and “excellent” internal consistency, respectively. 20
Empirical validation of the QRS: does QRS score really make a difference?
“Consequence” is one of the most important criteria for validity of a measurement scale. 24 This is assessed by correlating the QRS score with recorded assessments on report professionalism and attendings’ preference, and by comparing the QRS scores before and after dedicated training. Empirical validity of the QRS is supported if the QRS score is highly correlated with professionalism and attendings’ preference, and if the QRS score improves after training, controlling for the possible confounding effects of radiologic study type, reviewer, PGY of training, and their interaction terms. Cohen’s d 25 is used to assess the effect of size of training on the QRS scores, with a Cohen’s d of 0.2, 0.5, and 0.8 indicating “small,” “medium,” and “large” effects, respectively. Also, the change of QRS mean scores (post–pre) were investigated among residency years, reviewers, and study types, to offer additional empirical evidence for the validity of the QRS.
Mplus version 7.1 (Mplus software; Muthén and Muthén, Los Angeles, CA, USA) was used to perform CFA evaluations. All other statistical analyses were performed using Statistical Analysis Software (SAS) 9.3 (SAS Institute Inc., Cary, NC, USA).
Results
Characteristics of the randomly selected reports
The general characteristics of the 804 randomly selected reports are listed in Table 1. The 403 pre- and 401 post-training studies did not differ in distribution among the five reviewers (p = 0.99) or the four study types (p = 0.99). However, more PGY4 and fewer PGY3 and PGY5 residents were represented in the pre-training reports compared to post-training (p < 0.001).
Distribution of the 804 reports: pre-training versus post-training.

CT: computed tomography.
Psychometrical properties of the QRS
The psychometric properties of the QRS are summarized in Tables 2 and 3. All of the five QRS items showed good variability, with the vast majority of the item responses falling in the range of 5%–95% in the pre-, post-, and overall samples. The corrected item–scale correlations of the five QRS items were high, ranging from 0.62 to 0.84, 0.77 to 0.88, and 0.71 to 0.86 for the pre-, post-, and overall samples, respectively. The five QRS items correlated closely with each other, with correlation coefficients ranging from 0.45 to 0.78, 0.68 to 0.85, and 0.58 to 0.81 for the pre-, post-, and overall sample, respectively. Among the five QRS items, Q4 (Readability) and Q1 (Report appearance) showed the highest and the lowest correlation with the overall QRS score, for all of the pre-, post-, and overall samples (Table 2). CFA results supported the uni-dimensional factor structure of the QRS, with the majority of the model fit indices falling into or close to the acceptance ranges. Data at post-training had the best fit. The few unsatisfying indices may be due to the large sample size. For each of the pre-, post-, and overall samples, all of the five QRS items had factor loading >0.4 and p < 0.001 (Table 3). These results indicate the factorial validity of the QRS, reflecting that each and all of the five items are measuring a single construct: report quality. Also, the QRS had excellent reliability, with Cronbach’s alpha of 0.899, 0.936, and 0.922 for pre-, post-, and overall sample, indicating that the QRS showed excellent reliability as an overall measure of report quality.
Item distribution, item–scale correlation, and correlation matrix among the items and scale scores of the reports.

QRS: quality of report scale; PF: professionalism; TP: type preference.
Q1: report appearance; Q2: report organization; Q3: language utilization; Q4: readability; Q5: information pertinence.
All of the correlation coefficients have p value less than 0.001.
CFA results and Cronbach’s alpha of the QRS in the 804 reports.
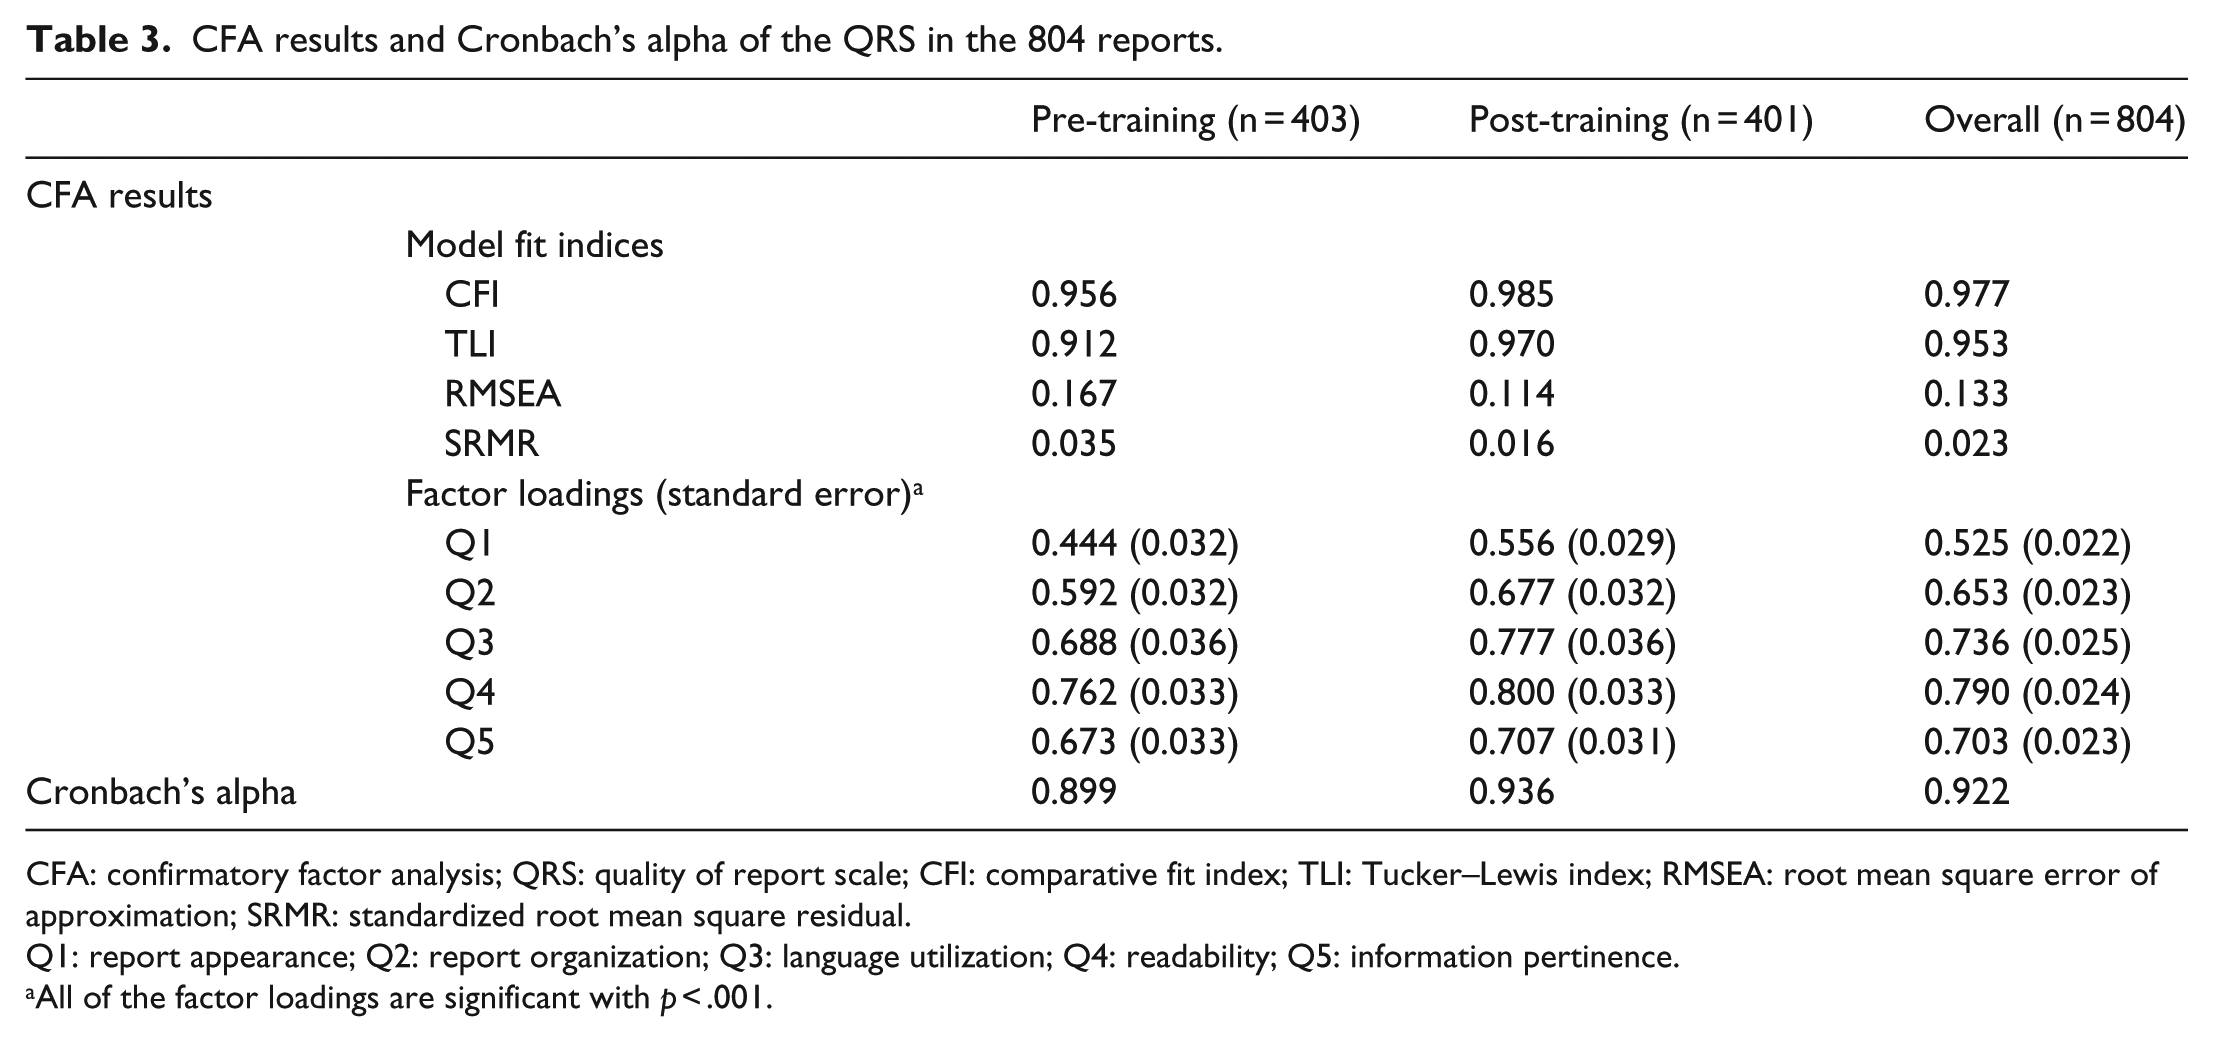
CFA: confirmatory factor analysis; QRS: quality of report scale; CFI: comparative fit index; TLI: Tucker–Lewis index; RMSEA: root mean square error of approximation; SRMR: standardized root mean square residual.
Q1: report appearance; Q2: report organization; Q3: language utilization; Q4: readability; Q5: information pertinence.
All of the factor loadings are significant with p < .001.
Empirical validation of the QRS
As shown in Table 2, the item and overall scores of the QRS were highly correlated with the two single-item scales for “professionalism” and “report preference” (ranged 0.54–0.92, p < 0.001). The QRS scores showed very high correlation with “professionalism” (0.83, 0.86, and 0.85 for the pre-, post-, and overall sample, p < 0.001), and with “report preference” (0.87, 0.92, and 0.90 for the pre-, post-, and overall sample, p < 0.001). The reports with higher QRS score were more professional and preferred by radiology attendings.
The comparisons of the scale and item scores of QRS pre- and post-training are summarized in Table 4. After training, the mean QRS scores increased from 18.70 to 20.03 and Cohen’s d was 0.40, an effect size between “small” and “medium.” Each of the five QRS items showed improvement after training, ranging from 4.91% to 8.65% (p < 0.01). After controlling for the possible confounding effects of study type, reviewer, PGY of training, and their interaction terms, the effect of dedicated report training was found to be very significant (p < 0.001, Table 5). Means of the QRS scores by PGY, reviewer, and study type are summarized in Table 6, which shows that, except for one reviewer (reviewer A, where a 4.0% drop was shown), the mean QRS scores improved after the report training session. All of these results offer empirical evidence for the validity of the QRS.
Comparison of the scores: pre-training versus post-training.

QRS: quality of report scale; SD: standard deviation.
ANOVA results from the multivariate model for QRS score.

ANOVA: analysis of variance; QRS: quality of report scale; df: degree of freedom; PGY: post graduate year.
An asterisk (*) between two terms stands for the interaction between them.
Means of the QRS scores by post graduate year, reviewer, and study type.

SD: standard deviation; CT: computed tomography.
Discussion
Although professionally developing scales is more demanding than selecting items casually, in the long run it is a worthwhile effort, simply because the costs of using casually constructed measures often greatly outweigh the benefits. 26 The primary output of this study, a professionally developed and validated scale for radiology report quality, can make significant contributions to advancing the education and training of residents in diagnostic radiology.
Improving the quality of radiology reports has been debated in the radiology literature for nearly a century. Hickey 27 called for the standardization of radiographic reports, and it was reaffirmed 80 years later by Steele et al. 2 In 2004, an extensive survey of radiology residency training programs in the United States 1 showed that, of the 151 responding programs, 86% offered 0–4 h of didactic instruction on report generation throughout the 4-year training program, and 81% of programs formally graded < 1% of resident reports, reaffirming that instruction in radiology report generation remained nearly nonexistent in training programs.
Coakley et al. 28 showed that routine faculty editing of reports generated by trainees significantly improved the ratings for report clarity, brevity, readability, and quality. The process, however, was time consuming. The authors stressed that it would be more efficient and cost effective to have a valid and reliable measurement tool of report quality, placing emphasis on the style aspects of reporting when training residents.
Several authors have developed various methods to evaluate resident reporting skills, that is, the quality of their reports. Williamson et al. 29 utilized a structured clinical examination of radiographic test cases reviewed and dictated by residents, grading them on the overall number of studies the resident could dictate in the allotted time, their ability to form a “well-specified” impression, documentation of discrepancies, and the notification of referring physicians regarding emergent or unexpected findings. Robert et al. 30 retrospectively reviewed chest radiograph reports dictated by residents, assessing the ability of the report to allow the patient to move forward on the clinical spectrum, how easy it was to read the report, whether the dictating physician documented presenting clinical signs or symptoms, the position of tubes and wires, and whether the report provided a definitive diagnosis or assessed overall change in disease status. The methods described by both Robert and Williamson provide a way to critically assess a resident’s ability to efficiently review radiographic studies and interpret findings, important skills that show considerable change as residents progress through their training. Collard et al. 3 developed a simple “Radiology Reporting Score Card” assessing the “Written Communication Skills.” The score card assesses 4 items including succinctness, spelling/grammar, clarity, and responsible referral, each scored on 0 to 3 scale with 0.25 intervals, with a summary score of “Written Communication Skills” ranging from 0 to 12. However, the authors did not report on the psychometric properties of their scale, leaving the reliability and validity of the tool untested. Within the framework of workplace-based assessments (WPBA), Wallis et al. 4 developed the Bristol Radiology Report Assessment Tool (BRRAT) for radiology reporting skills. The BRRAT has 19 questions measured at four categories (0 = Not Applicable, −1 = Below Expectation, 1 = Meets Expectation, and 2 = Above Expectation), and on Overall Assessment at a 1 to 10 scale. Unfortunately, the psychometric properties of the BRRAT were either not sufficiently studied or unacceptable. There was no item analysis of the 19 questions, and only 7 of the 19 items had item-total correlation greater than 0.30. No CFA was done to support that each and all of the 19 questions were measuring the single construct (the radiology reporting skills) and Cronbach’s alphas of the 19 items (0.64 to 0.76 among different raters) were low. Moreover, while the BRRAT is a 20-item, intensive, WPBA tool for radiology report skills, our QRS is a 5-item, succinct, rating scale for report quality.
To our knowledge, this study is the first to professionally develop and validate a scale specifically designed to measure the quality of radiology reports generated by the residents. The report tool allows us to evaluate overall report quality, irrespective of the training level of the person issuing the report or the examination type, while focusing on the basic features that the reader, that is, referring clinicians, would utilize to judge overall quality. As suggested by Sistrom et al., 1 we developed a core group of five Likert-type questions that could be quickly answered by a reviewer and then tested the validity and reliability of the scale. Although succinct and easy to administer, the newly developed scale is reliable and valid, reflecting one main characteristic: overall report quality. Since the scale is reliable and valid in a large sample of reports across study type, reviewer, and level of training of the dictating resident, it can be used to evaluate a wide variety of report types and to test various types of educational interventions. Currently, other scales of report quality do not exist, so convergent validity of the QRS cannot be checked. In the future, further evaluation such as measurement bias testing and possible revision of the QRS scale would be warranted if the tool were applied to a new population because psychometric properties of any scale require re-testing to specific samples 18 and because scale development is usually an iterative procedure. 11
As a secondary goal of our study, we verified (through use of the scale) the effectiveness of our own dedicated teaching sessions on report generation, showing that the didactic lectures improved the quality of reports generated by residents. Although the improvement was a modest 7.17% with Cohen’s d between “small” and “medium,” it was significant (p < 0.001). During the training sessions, residents had been instructed how to organize and present their findings in a clear and concise manner. The use of structured reporting, which is preferred by radiologists and clinicians,31,32 was reviewed during the didactic session, but was not formally implemented by the department during the testing period. During the time of the study, reports were generated through a voice recognition system utilizing a very basic common report format, with editing and final layout determined solely by the dictating resident and faculty. Detailed examination-specific templates, which reflect a more structured reporting style, were already utilized in select divisions within the department. We specifically did not evaluate reports from those divisions in our assessment.
Our evaluation of reports did not include clinicians as reviewers. Clearly they are the target audience for reports, so their opinion is highly valued. However, Coakley et al. 28 found that radiologists were more critical in evaluating reports compared to their clinical counterparts, likely due to the fact that they perform daily review of large numbers of reports and regularly receive feedback from clinicians. We felt that by having radiologists review reports specific to their area of expertise, they could offer a more detailed and discriminating assessment of report quality.
We noted that the reports randomly generated from the pre-training time period included a greater number of PGY 4 radiology residents. This is due to the overall scheduling of the residents by year of training, with more PGY4 residents assigned during the 6 months after the training session to imaging sections that did not dictate the types of studies evaluated in our analysis. However, multiple regression analysis clearly showed that the level of resident training did not influence the quality of report (p = 0.09), and there was no interaction effect between it and the report generation training (p = 0.63, Table 5).
Since this initial study, we have incorporated the training session into the mandatory yearly core lectures for residents. We continue to refine the sessions, adjusting to the needs of the residents and faculty and to departmental requirements. Having a valid scale to assess report quality allows us to monitor and strengthen these changes. The scale is also usedto provide a more objective documentation of the quality of reports generated by residents as they progress through their training, fulfilling the requirement for formal feedback on dictated reports as mandated by the American Board of Radiology.
Although the five QRS items seem to have a considerable amount of overlap given that as a set they are all measuring a single property of radiology reports, report quality, each of them is in fact measuring a distinct aspect of report quality. Additionally, the variability among the five item scores is shown in the difference at distributions of grades and item–scale correlation (Table 2), as well as the different means and standard deviations (Table 3).
Although as a “succinct” rating scale, the QRS is targeted to be finished within 10 min, based on our experiences, after passing the initial “learning curb,” a radiologist can finish grading a report using the QRS within 2 min.
We chose five points for each of the five Likert-type items of the QRS. Statistically, the more points at Likert scale, the better, because it will give more information and discriminating abilities. On the other hand, the more points at Likert scale, the more difficulties encountered with implementation of the scale (e.g. wording, reading, and grading of each item). In addition, the corresponding wording of the five points (1—poor, 2—below average, etc.) is precise and succinct, which services the succinct purpose and style of the QRS very well.
There are several limitations to our study. First, it would have been ideal to have an additional group of radiology residents who did not receive the training sessions as a control group. However, given the limited number of radiology residents at our institution this was not feasible. Expanding the study in the future to include other institutions would not only allow the recruitment of more radiology residents and allow the inclusion of a control group, it would also result in a more objective and independent evaluation. Second, obtaining each resident’s identification would allow comparison of the effects of the training sessions at the individual resident level instead of at the group level (through a pre-/post-design), which would significantly improve the statistical power of our analysis. However, we had to de-identify the residents due to ethical considerations per the regulations of our IRB. Third, it would be ideal for each of the 804 reports to be graded by each of the five reviewers so that the inter-rater reliability of the QRS can be assessed. However, the five readers did not have expertise in the four study types. In addition, it was unrealistic to ask each of them to grade all of the 804 reports given their busy clinical schedules. Future study on the inter-rater reliability of the QRS is warranted. Fourth, if resources permitted, more study types beyond the four tested should be included so that the generalizability of the QRS would be higher.
Conclusion
We have successfully developed and applied a quality report scale that has been shown reliable and valid in the evaluation of radiology resident reports. With minor changes, this scale can be easily adapted to other fields with similar educational needs, such as pathology, given that adaption is one of the common practices in scale development,6,7,11 offering greater potential value of the new QRS scale in other fields of medical education. In addition, we have shown that dedicated training in the generation of radiology reports can improve report quality and should be incorporated into radiology training programs and adapted to other areas of medical education in the future.
Footnotes
Appendix 1
Acknowledgements
The authors wish to acknowledge Ms Doreen Katzaman for her assistance in manuscript preparation and Dr K Eggli for her professional support. Also, the authors are grateful to an anonymous reviewer for his/her insightful reviews of an earlier version of this manuscript, which substantially improved the quality of this work. As the first author, Dr Yang was involved in the conceptualization and design of the study, conducted all data analyses, wrote the first draft of the manuscript with Dr Kasales, and completed multiple rounds of revision based on feedback from all other authors. As the corresponding author Dr Kasales was involved in the conceptualization and design of the study, collected the data, wrote the first draft of the manuscript with Dr Yang, and contributed substantially at the revisions of the manuscript. Drs Yang and Kasales had full access to all of the data in the study and take responsibility for the integrity of the data and the accuracy of the data analysis. Drs Ouyang, Peterson, Sarwani, Tappouni, and Bruno contributed to the study design, acquisition and interpretation of data, and the critical revision of the manuscript. All authors approved the final manuscript for publication.
Declaration of conflicting interests
The authors declare that there is no conflict of interest.
Ethical approval
This research was approved by the Institutional Review Board of at our institution.
Funding
This research received no specific grant from any funding agency in the public, commercial, or not-for-profit sectors.