
Abstract
Smartphones have become one of the most frequently used devices for accessing the Internet. Although a growing body of research has examined the second-level digital divide with a focus on general Internet and digital media use, little is known about patterns of smartphone use and smartphone-related skills in the general population. This paper examines inequalities in the use of smartphone technology based on two nationally representative samples of smartphone owners collected in Germany in 2017 and 2020. We identify six distinct types of smartphone users by conducting latent class analyses that classify individuals based on their frequency of smartphone use, self-rated smartphone skills, and activities carried out on their smartphone. Smartphone use differs significantly by sociodemographic characteristics and operating system. The types reflecting more frequent and diverse smartphone use are younger, have higher levels of educational attainment, and are more likely to use an iPhone. Overall, the composition of the latent classes and their characteristics are robust across samples.
Smartphones have become an integral part of people's daily lives, with 85% of U.S. adults owning a smartphone in 2021, compared with only 35% a decade ago (Pew Research Center, 2021). Smartphone ownership has similarly increased across other countries. For example, Eurostat (2021) shows that the proportion of people in Germany aged 16 and over who use a smartphone or other mobile phone to access the Internet increased from 15% in 2011 to 75% in 2019. Although smartphone ownership rates are still lower in emerging economies, they are rapidly increasing (Silver, 2019). Despite this general development, inequalities in smartphone access persist (van Deursen & van Dijk, 2019). Recent data from 2021 show that 96% of U.S. adults under the age of 30 own a smartphone, whereas only 61% of adults aged 65 and above own such a device. Smartphone ownership increases with household income and educational attainment, and U.S. adults living in rural areas are less likely to own a smartphone than adults living in urban or suburban areas (Pew Research Center, 2021). Similar patterns exist in other countries (Eurostat, 2021; Keusch et al., 2020). Beyond disparities in digital access, scholars have increasingly paid attention to inequalities in digital skills and the use of digital technologies, referred to as the second-level digital divide (DiMaggio et al., 2004; Hargittai, 2002). Even among people with access to the Internet and digital devices, substantial differences can be found with regard to how skilled and experienced they are in using digital technologies (van Dijk, 2020).
Although a growing body of research has examined the second-level digital divide with a focus on general Internet and digital media use (e.g., Blank & Groselj, 2014; Reisdorf & Groselj, 2017; van Deursen & van Dijk, 2014), there is a rather limited understanding in such research of inequalities related to smartphone skills and use. Our study contributes to filling this gap by providing empirical evidence about the second-level smartphone divide in Germany. We consider this extension important, because over the last decade smartphones have become one of the most frequently used devices for accessing the Internet, and for some parts of the population the only means by which they can do so (Eurostat, 2021; Pew Research Center, 2021; Tsetsi & Rains, 2017). In addition, smartphones differ in several characteristics from desktop and laptop computers, most notably in their portability, because smartphone users can easily access the Internet in their everyday lives whenever they carry around their mobile device. Thus, the ability to use a smartphone effectively and efficiently becomes increasingly important as the technology gets more embedded into people's lives. Smartphones can be used for a large variety of activities including communication and entertainment, but also for activities that were previously performed mainly on desktop or laptop computers, such as information seeking or work-related activities (Pearce & Rice, 2013; Perrin, 2017). Furthermore, there is a growing array of activities that rely exclusively on smartphones and, thus, cannot be performed on other digital devices. Examples include communication (e.g., using communication applications such as WhatsApp), commercial activities (e.g., using mobile banking or mobile payments), mobility (e.g., buying train or plane tickets or participating in public car-sharing or bicycle-sharing schemes), and health-related activities (e.g., digital contact tracing or using digital vaccination certificates). Smartphones are also increasingly used as a hub for Internet of Things devices such as wearable fitness trackers and smart home applications.
People who lack the required usage experience and skills are less likely to benefit from the opportunities offered by smartphones and are increasingly excluded from the digital society (van Deursen & Helsper, 2015). Individuals who have difficulties installing new apps on their smartphone, for example, may be unable to use services that are only accessible via particular smartphone apps. Previous research has shown that inequalities in general Internet and digital media use are directly linked to existing social inequalities, including those related to socioeconomic status, education, gender, ethnicity, and age (Helsper, 2021; Robinson et al., 2015; van Dijk, 2020). However, much less is known about the patterns of smartphone use and smartphone-related skills in the general population and how they relate to social inequalities.
To shed more light on these inequalities in the use of smartphone technology, we draw on nationally representative survey data from two independent samples of smartphone owners collected in Germany in November 2017 and January 2020 and address the following two research questions: RQ1: Which smartphone usage types can be identified among smartphone owners?
RQ2: How do the smartphone usage types differ in sociodemographic characteristics and in the operating system used?
With this study, we contribute to the digital divide literature in several ways. First, we apply the theoretical concept of the digital divide specifically to smartphones. We build on and extend the existing literature on the digital divide with a particular focus on the skills that smartphone owners report when using their device for different types of activities in their everyday lives. Second, we provide empirical evidence for the existence of different smartphone user groups that are clearly differentiated in their activity patterns and skill sets. Third, measuring the same constructs in two samples allows us to examine whether the identified smartphone usage types and their correlates are robust across different time points.
Background
Typologies of digital media and smartphone use
An extensive number of typologies have been constructed over the last two decades to conceptualize and classify the large variation in Internet and digital media use (Blank & Groselj, 2014). To create the usage typologies, previous studies often classified Internet users based on their amount, variety, and types of use (Blank & Groselj, 2014; Holmes, 2011; Horrigan, 2007; Livingstone & Helsper, 2007; Reisdorf & Groselj, 2017; Selwyn et al., 2005; van Deursen & van Dijk, 2014; Zillien & Hargittai, 2009). Whereas amount of use is measured as frequency of going online (e.g., number of hours per day), frequency of engaging in different online activities, or total years of Internet use, variety of use is measured as the number of activities carried out online. In turn, types of use are measured by nominal categories that represent different online activities such as information seeking and communication.
For example, in one of the earlier studies, Selwyn et al. (2005) interviewed 1,001 adults in four regions of England and Wales and identified four categories of Internet users based on their frequency and type of Internet use: (a) “broad frequent users” (13% of the sample); (b) “narrow frequent users” (18%); (c) “occasional users” (11%); and (d) “non-users” (58%). In a more recent study, Reisdorf and Groselj (2017) use data from the Oxford Internet Survey, a nationally representative face-to-face survey of individuals aged 14 and over in Great Britain, to identify five types of Internet users: (a) “broad users” (27% of the population); (b) “regular users” (30%); (c) “low users” (21%); (d) “non-users” (18%); and (e) “ex-users” (4%).
Although a large number of such typologies have been proposed for general Internet and digital media use, smartphone use has received less attention in previous research on the digital divide. In a few of the existing studies, mobile phone and smartphone use has been employed as an indicator for general Internet use (Herzing & Blom, 2019; Horrigan, 2007; Yates et al., 2020), but has not been studied on its own. In related areas of research, typologies of smartphone users have previously been developed, for example, smartphone addiction research (Bian & Leung, 2015; Elhai & Contractor, 2018; Kim et al., 2016) and marketing research (Calvo-Porral & Otero-Prada, 2020; Chen et al., 2019; De Canio et al., 2016; Hamka et al., 2014; Petrovčič et al., 2018; Sell et al., 2014).
For example, in the area of smartphone addiction research, Elhai and Contractor (2018) examined the relationship between usage patterns and problematic smartphone use in a survey of 296 college students in the United States. To classify the students into types of smartphone users, they conducted a latent class analysis based on the students’ self-reported frequency of engaging in 11 different activities on their smartphone, for example, voice/video calls, texting/instant messaging, and using social media. The authors identified two classes of smartphone users: “heavy users,” who use their phone for a large variety of activities; and “light users,” who particularly make use of social media and audio entertainment as well as taking photos and recording videos.
In the marketing literature, typologies of smartphone users have been proposed in the context of customer segmentation research. For example, De Canio et al. (2016) collected survey data from 264 smartphone users in Italy to conduct a cluster analysis based on their self-reported use of 10 different smartphone functions. The authors identified five types of smartphone users which they called “unfriendly users” (who do not use any of the 10 smartphone functions), “utility users” (who mainly use their smartphone for voice calling and information seeking), “gamers” (who mainly use their smartphone for games), “moderator users” (who use all of the 10 smartphone functions, but information seeking in particular), and “supersmartphoners” (who mainly use their smartphone for taking photos, recording videos, social media, and staying in contact with others, for example, using video calling).
Using a different measurement approach, Hamka et al. (2014) conducted a latent class analysis based on log files from 129 smartphone users who installed a tracking app on their device for at least two weeks. The authors identified six types of smartphone users, including “application ignorant users” (who visit a small number of URLs in the mobile browser and use a small number of apps per day), “basic application users” (who visit a small number of URLs but use a medium number of apps), “average application users” (who visit a medium number of URLs and use a medium number of apps), “information seekers” (who visit a large number of URLs but use a small number of apps), “app savvy users” (who visit a large number of URLs, use an extensive number of apps, and install a large number of new apps), and “high utility users” (who visit an extensive number of URLs, use an extensive number of apps, but install a small number of new apps).
A limitation of these existing typologies is that they reflect the underlying research questions, for example, smartphone addiction, rather than capturing the multidimensionality of smartphone use. In addition, they are often based on small samples or focus on specific subgroups of the population such as adolescents or college students. The typology developed in this paper aims to expand upon the existing smartphone usage typologies by focusing on general smartphone use and drawing on survey data that are more representative of the general population.
Correlates of smartphone use
Previous research on smartphone use has been relatively sparse compared with the large body of research on correlates of general Internet and digital media use (Blank & Groselj, 2014; van Deursen & van Dijk, 2014). Frequency and variety of smartphone use have been found to decrease with age (Andone et al., 2016; Fortunati & Taipale, 2014; Serrano-Cinca et al., 2018). With regard to the types of activities carried out on smartphones, younger individuals are more likely to use their smartphone for entertainment and games, social interaction, and commercial activities (Andone et al., 2016; Kongaut & Bohlin, 2016). For other activities such as reading and writing emails on a smartphone, no significant age effects have been found (Kongaut & Bohlin, 2016).
Gender also seems to affect patterns of smartphone use. For example, previous research has shown that women use smartphones for a greater amount of time and visit a larger number of websites on their mobile browser than men (Andone et al., 2016; Cotten et al., 2009; Roberts et al., 2014; Wang & Liu, 2018). In contrast, men use a greater number of apps on their smartphone and generate a larger volume of uploaded and downloaded data traffic via the cellular network (Wang & Liu, 2018; Zhao et al., 2020). However, with regard to variety of smartphone use, the evidence for gender differences is mixed (Cotten et al., 2009; Fortunati & Taipale, 2014; Mascheroni & Ólafsson, 2016; Serrano-Cinca et al., 2018; Wang & Liu, 2018; Zhao et al., 2020). As far as types of use are concerned, women are more likely to use their smartphone for social interaction and taking photos, whereas men are more likely to read or watch news on their smartphone (Andone et al., 2016; Cotten et al., 2009; Kim et al., 2016; Kongaut & Bohlin, 2016; Mascheroni & Ólafsson, 2016; Roberts et al., 2014; Zhao et al., 2020). Mixed findings were reported for other smartphone activities, including entertainment and games, commercial activities, and reading and writing emails (Andone et al., 2016; Cotten et al., 2009; Kongaut & Bohlin, 2016; Mascheroni & Ólafsson, 2016; Roberts et al., 2014; Wang & Liu, 2018; Zhao et al., 2020).
Finally, education has been found to affect smartphone use. Individuals with higher levels of educational attainment use their smartphone for a larger number of activities (Fortunati & Taipale, 2014; Serrano-Cinca et al., 2018). Furthermore, they are more likely to use their smartphone for entertainment and games, social interaction, commercial activities, and reading and writing emails than those with lower levels of educational attainment (Kongaut & Bohlin, 2016).
Whereas the large majority of research on correlates of digital media use has relied on cross-sectional data that are collected at one point in time, several studies have also examined how usage behavior has changed over time (Kim et al., 2019; Li et al., 2020; van Deursen et al., 2015). For example, Kim et al. (2019) collected log data from 139,935 iPhone users between 2012 and 2016 who installed a tracking app on their device, and found that the use of social media apps and entertainment apps, including photo, video, and gaming apps, increased during this period, whereas the use of productivity apps decreased. Similarly, Li et al. (2020) used data collected between 2012 and 2017 from 1,465 Android smartphone users to study longitudinal changes in app use. They found that diversity of app use increased over the five-year period, whereas the number of apps used increased between 2012 and 2014 but decreased between 2014 and 2017.
Data and methods
Samples
To answer our research questions, we use survey data from two samples of smartphone owners collected in Germany in November 2017 and January 2020.
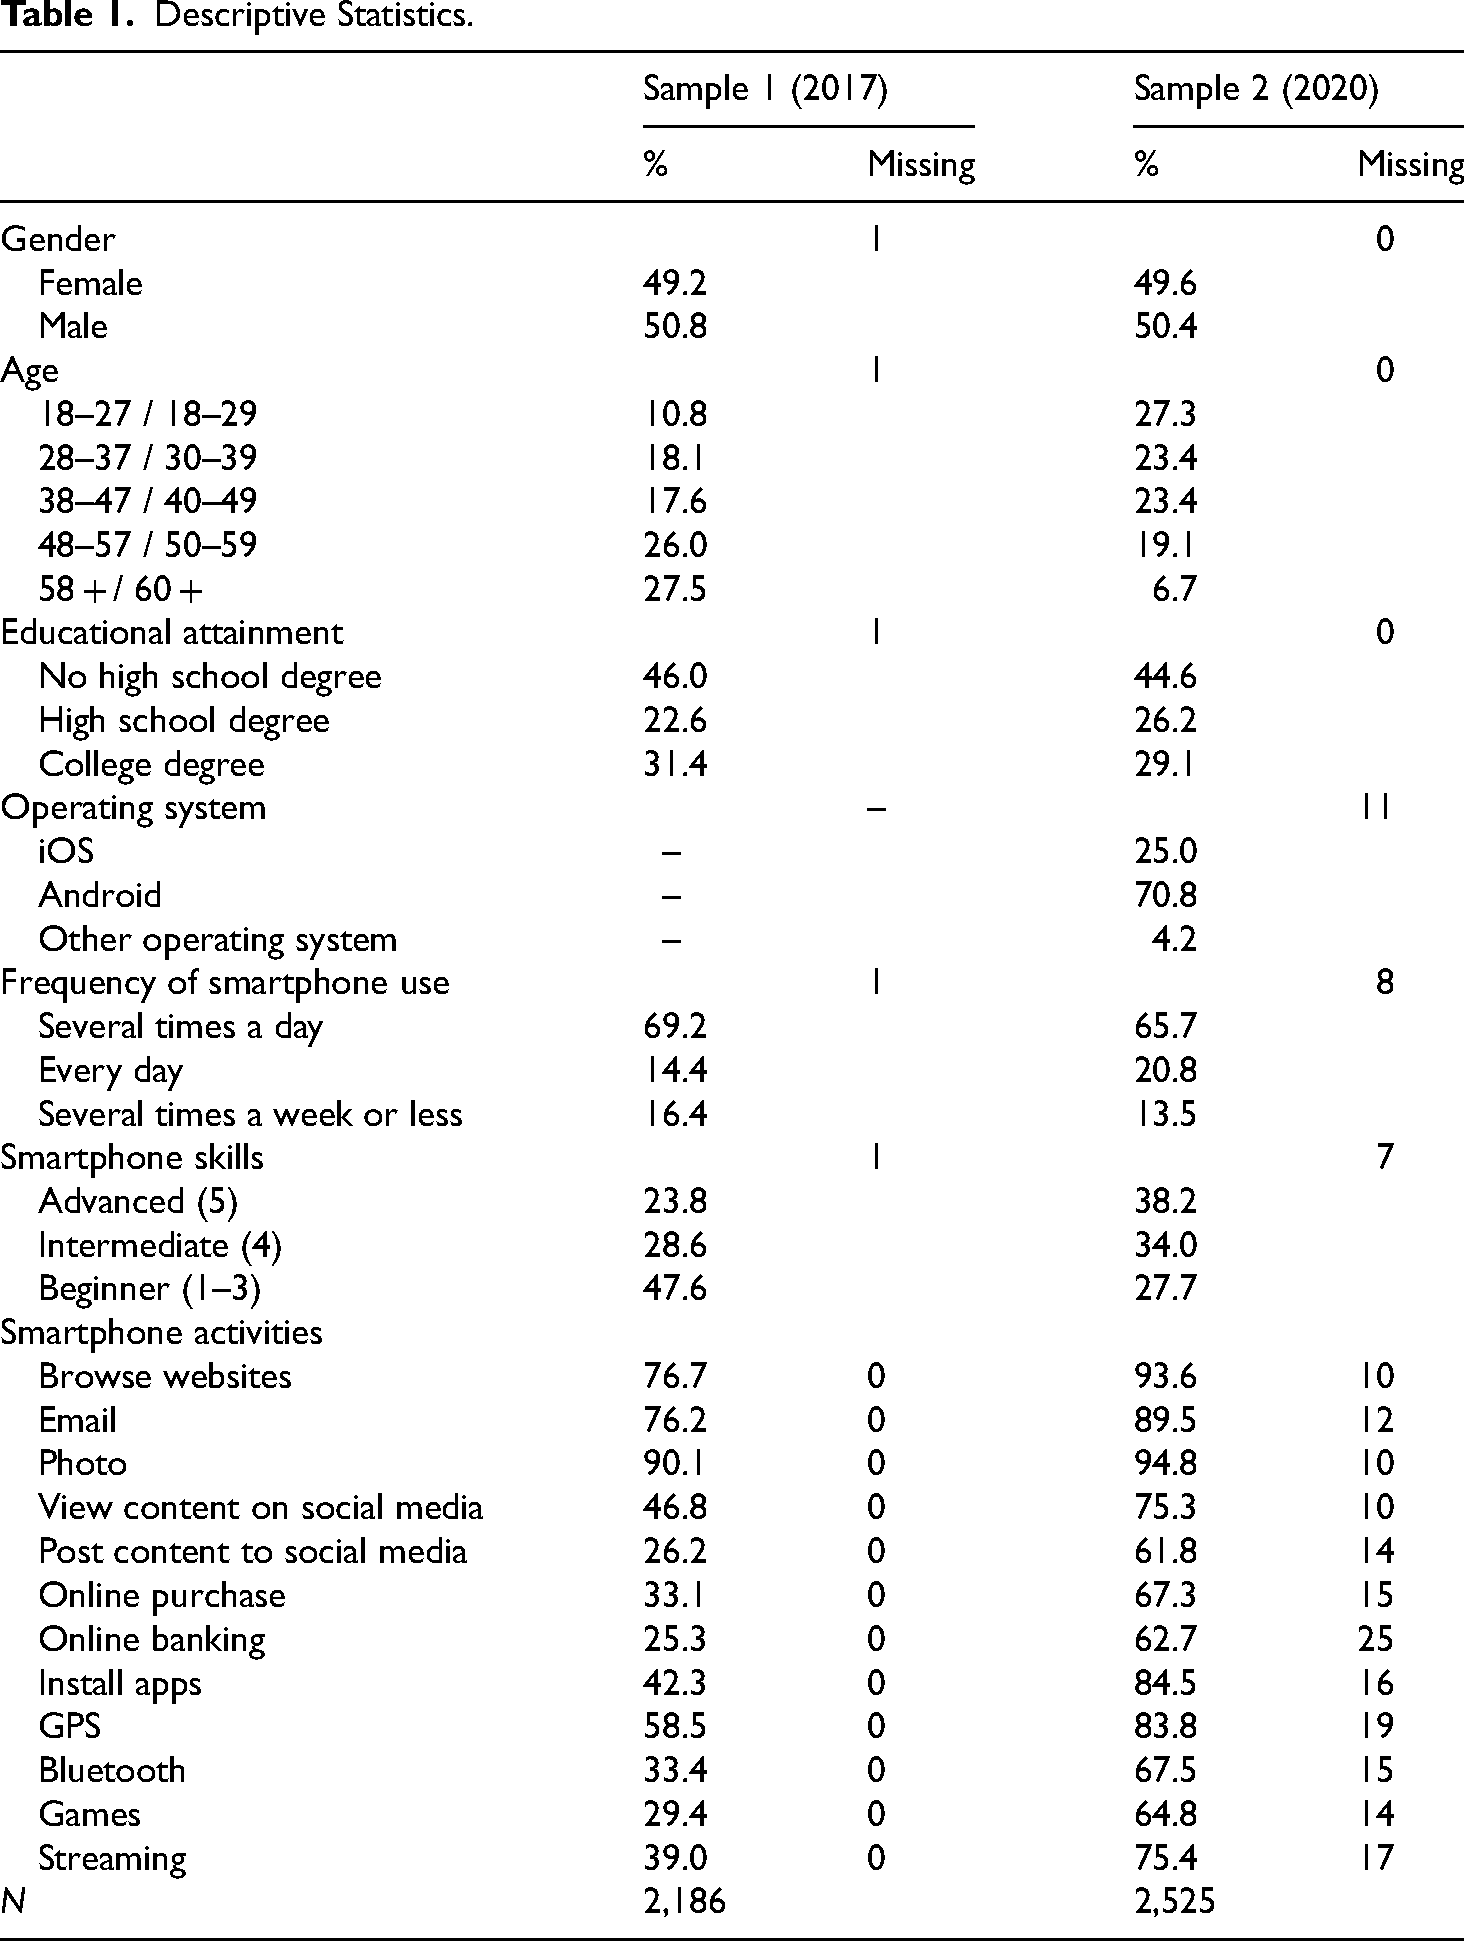
Descriptive statistics for the two samples are shown in Table 1. Both samples are comparable in terms of sociodemographics, except for age, with Sample 1 containing a larger proportion of older adults than Sample 2.
Descriptive Statistics.
Latent class analysis
We conduct a latent class analysis (LCA) to create typologies of smartphone users. LCA is a clustering method for identifying latent (unobserved) classes in a population from a set of observed categorical indicators (McCutcheon, 1987). Individuals are assigned to the different classes based on their similarity in response patterns on the indicator variables. LCA has been used in a number of previous studies to construct typologies of Internet and digital media use (Elhai & Contractor, 2018; Hamka et al., 2014; Herzing & Blom, 2019; Holmes, 2011; Sell et al., 2014; Yates et al., 2020).
We use 14 variables in the latent class models that were collected in both samples, including frequency of smartphone use, self-rated smartphone skills, and 12 smartphone activities (Table A1 in the Appendix). Frequency of smartphone use is measured on a five-point rating scale collapsed to three categories (several times a day, every day, several times a week or less). Self-rated smartphone skills are measured on a five-point rating scale collapsed to three categories (advanced [5], intermediate [4], beginner [1–3]). The categories were collapsed for these two variables because very few respondents selected the lower end of the scales and, thus, the original response distributions were highly skewed (see Table B1 in the Appendix for the response distribution of the original categories before recoding). Finally, 12 activities carried out on the smartphone are measured with a series of yes/no questions, reflecting types of activities that were examined in previous research on Internet and digital media use. These include social interaction (post content to social media), reading and writing emails (email), entertainment (games, streaming), commercial activities (online purchase, online banking), and information seeking (browse websites, view content on social media). The list was complemented by activities that are specifically carried out on smartphones, including taking photos, using GPS/location-aware apps, installing new apps, and using Bluetooth to connect the smartphone to other devices. A small proportion of missing values on these variables (< 2%) were imputed with a chained equations algorithm by using the R mice package, version 3.13.0 (van Buuren & Groothuis-Oudshoorn, 2011). Descriptive statistics for the variables included in the LCA are shown in Table 1.
To estimate the latent class models, we use the R poLCA package, version 1.4.1 (Linzer & Lewis, 2011). We vary the number of classes in the LCA from two to 10 and compute model fit criteria, including the log likelihood (LL), the Akaike information criterion (AIC), and the Bayesian information criterion (BIC), to select the best-fitting model, with lower values indicating a better model fit (Nylund et al., 2007). We also report the size and percentage of the smallest class.
Sociodemographic and smartphone-related correlates
As correlates of smartphone usage types, we collected data on sociodemographic characteristics in both samples (see Table 1 for descriptive statistics). The sociodemographic characteristics include gender (male vs. female), age (Sample 1: 18–27 years, 28–37 years, 38–47 years, 48–57 years, 58 + years; Sample 2: 18–29 years, 30–39 years, 40–49 years, 50–59 years, 60 + years), 1 and educational attainment (no high school degree, high school degree, college degree). In Sample 2, we also collected data on the operating system of the smartphone (iOS, Android, other operating system). The data preparation and analysis were conducted in R, version 4.0.4 (R Core Team, 2021).
Results
Which smartphone usage types can be identified among smartphone owners?
We first investigated which types of smartphone users can be identified in the two samples by conducting a LCA. Varying the number of classes from two to 10 showed that the BIC reached a minimum at the six-class model in both Sample 1 and Sample 2, with a LL and AIC that did not decrease substantially as more classes were included in the model (Table 2). The six-class model also resulted in classes with a reasonable size, with the smallest class containing 166 individuals in Sample 1 (8% of the overall sample) and 156 individuals in Sample 2 (6% of the overall sample). Therefore, we selected the six-class solution for our analysis.
Model Fit and Diagnostic Criteria for Two to Ten Classes of Smartphone Use.
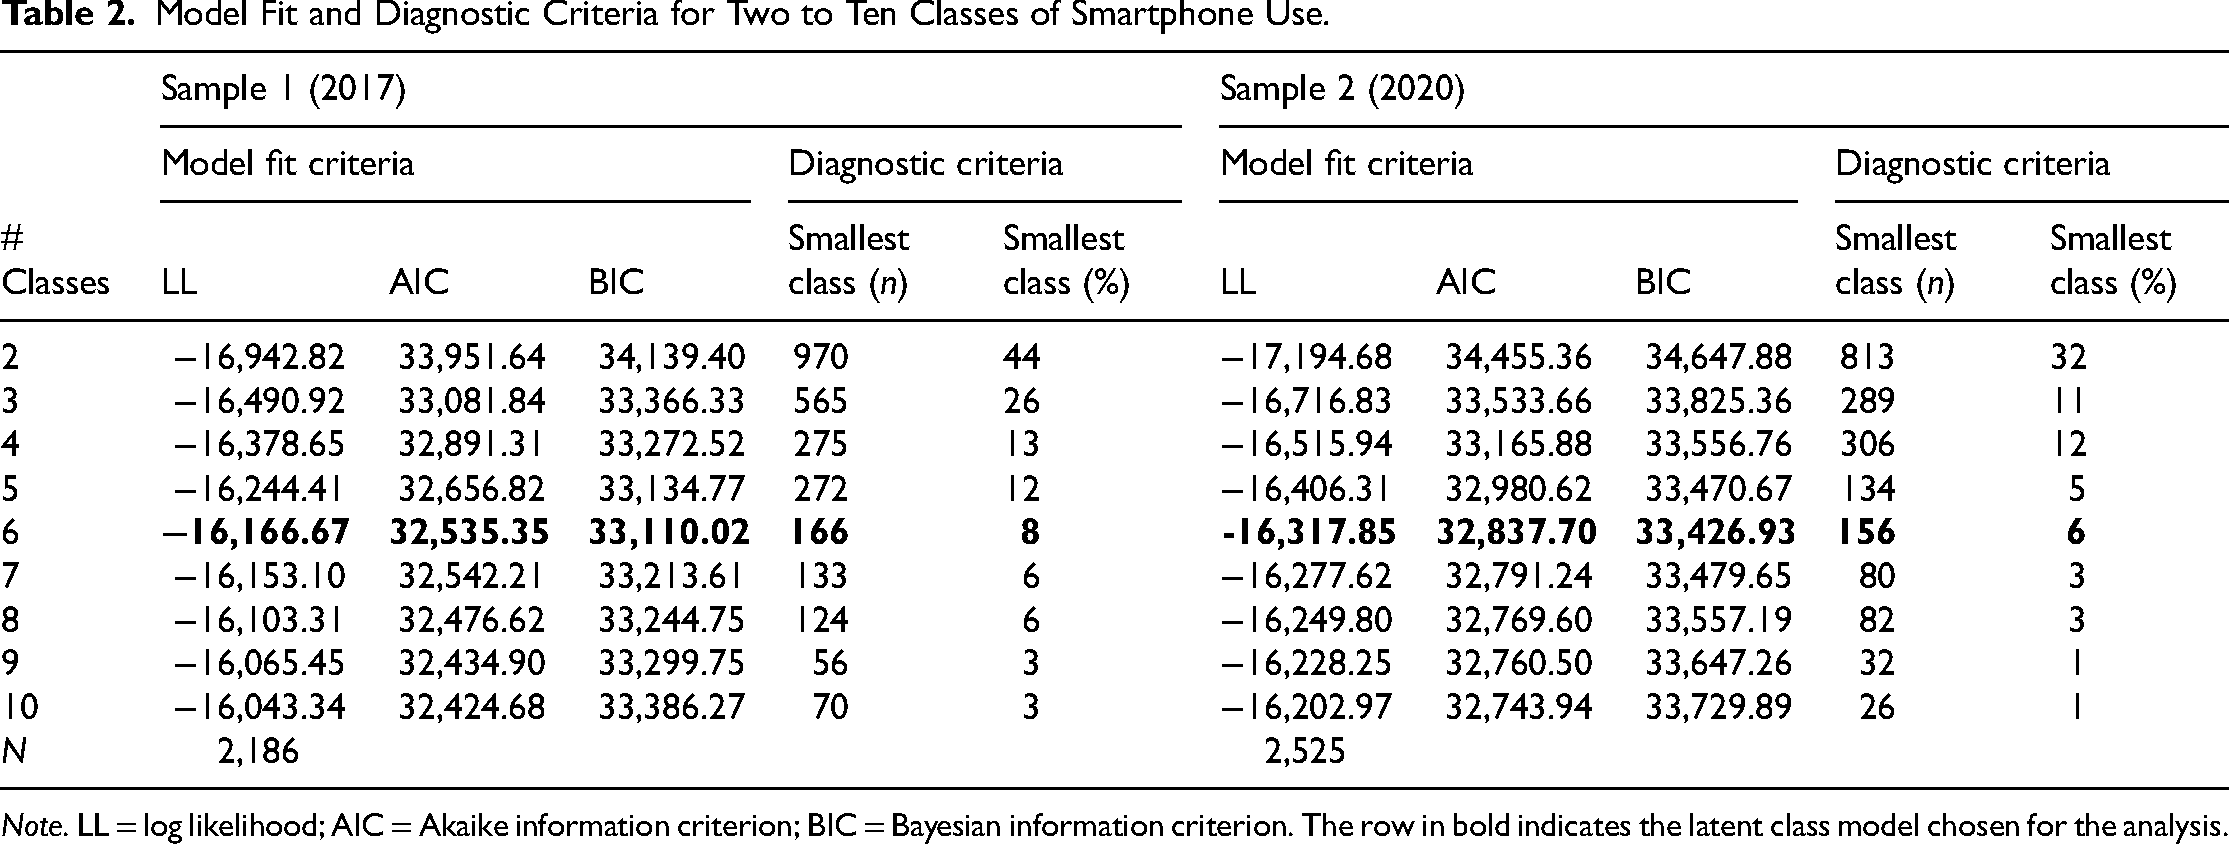
Note. LL = log likelihood; AIC = Akaike information criterion; BIC = Bayesian information criterion. The row in bold indicates the latent class model chosen for the analysis.
Next, we examined the composition of the latent classes. Table 3 shows the predictor variables (frequency of use, skills, types of activities) by smartphone usage class for Sample 1, and Table C1 in the Appendix shows the results for Sample 2. We describe the six usage types as follows.
Predictor Variables by Class of Smartphone Use (Sample 1).
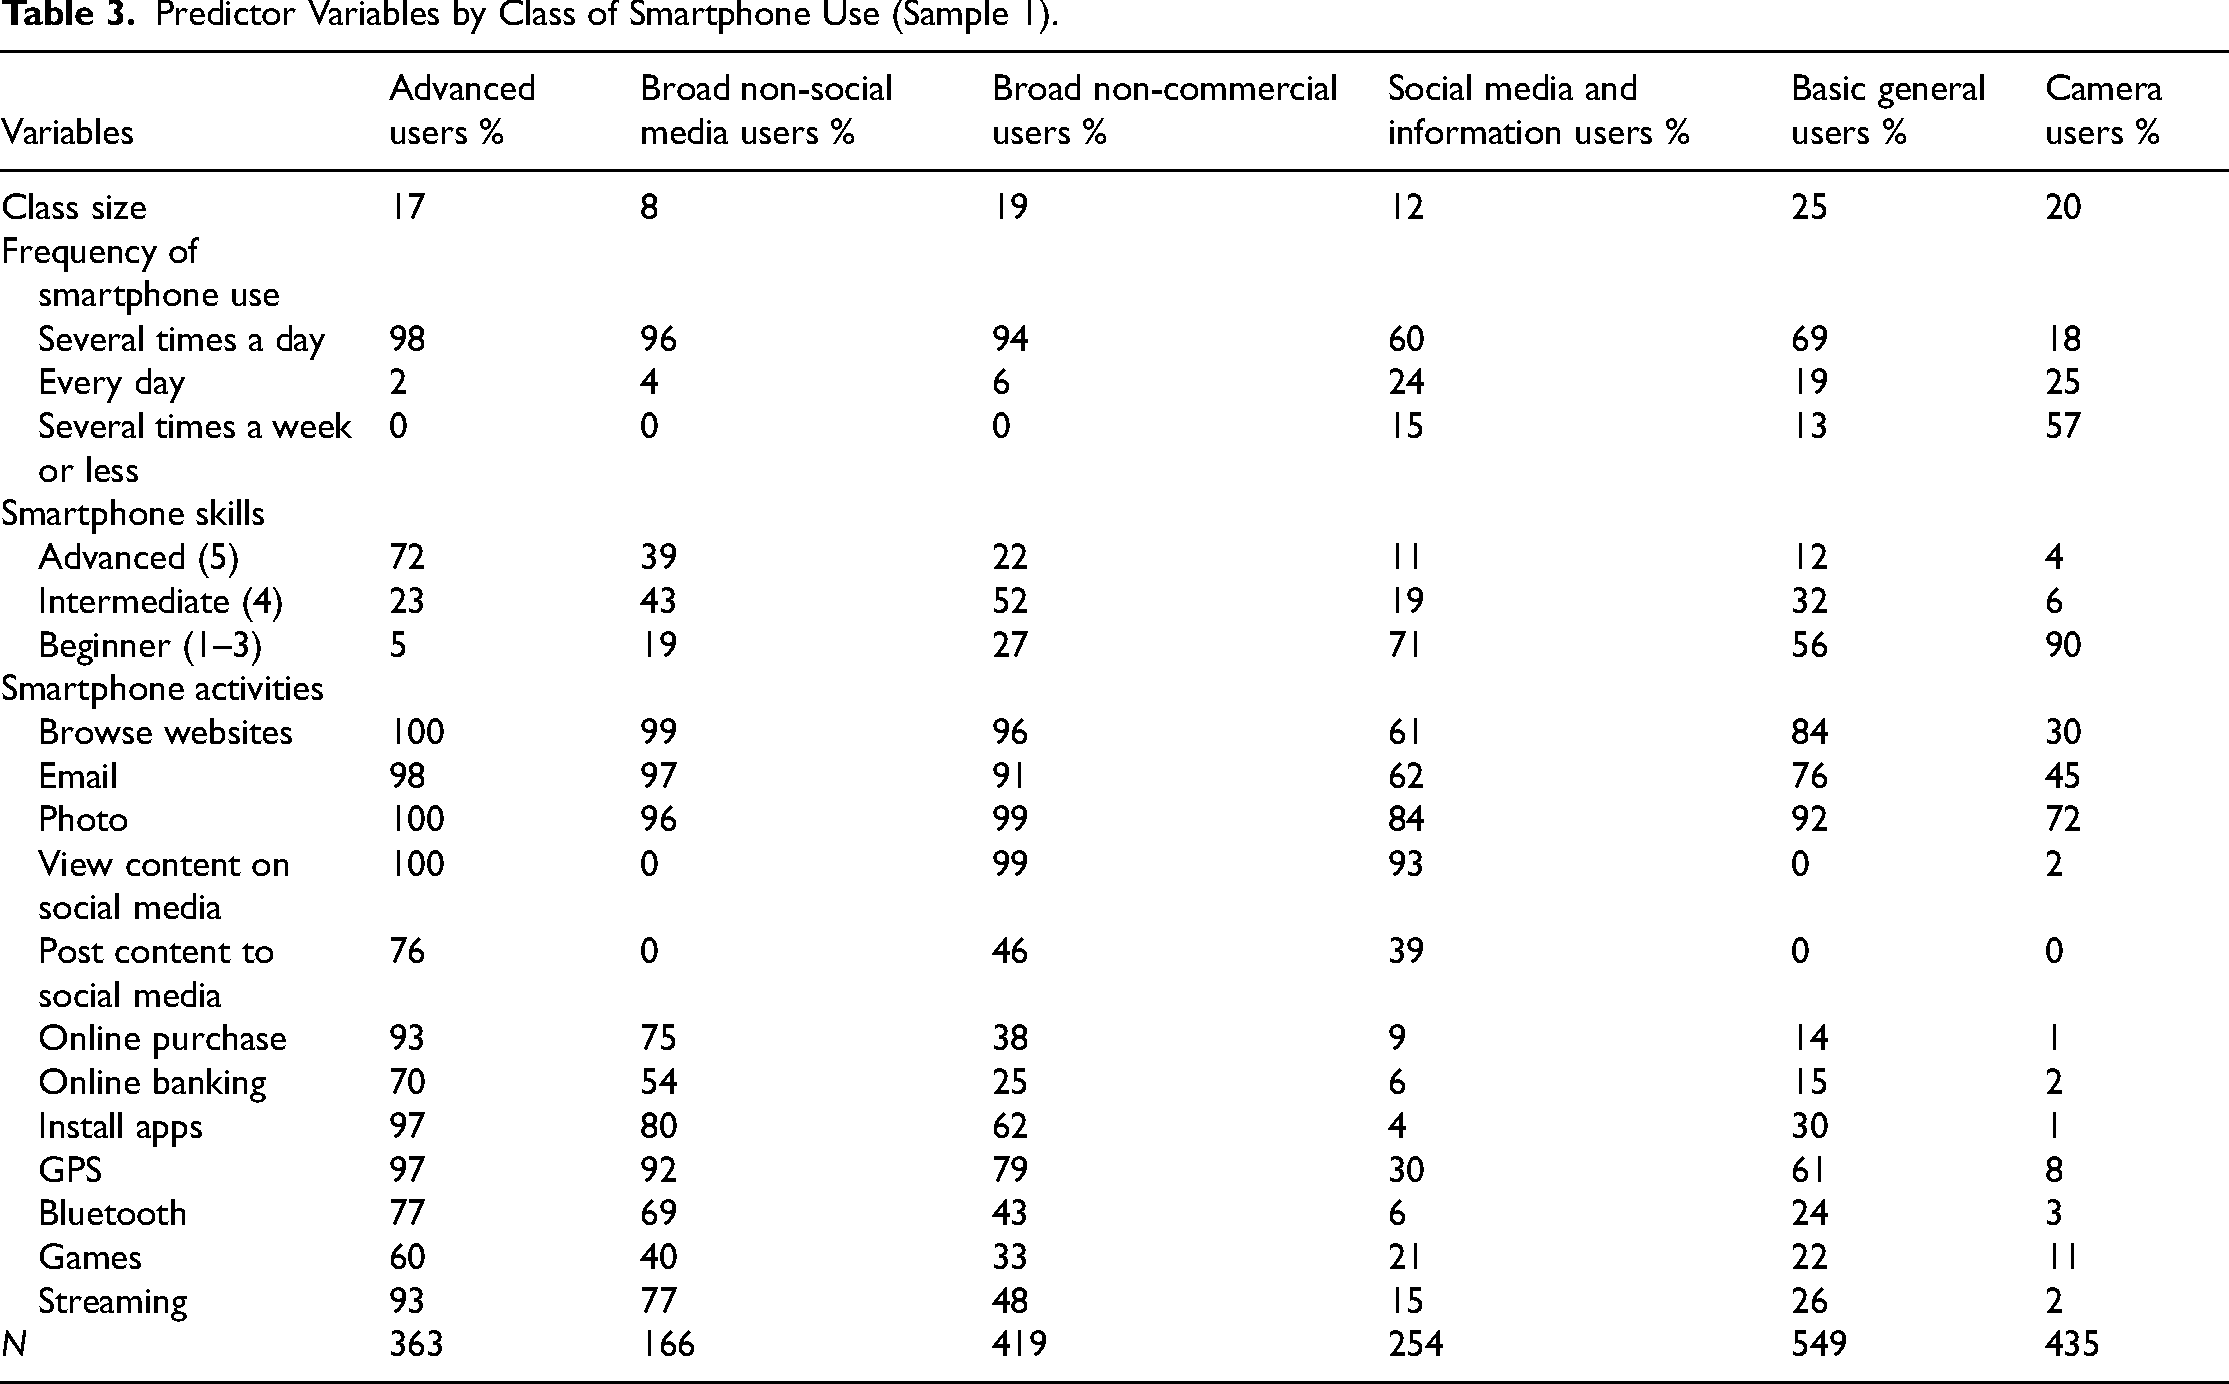
Advanced users used their smartphone several times a day (Sample 1: 98%; Sample 2: 82%) and mostly rated their smartphone skills as advanced (Sample 1: 72%; Sample 2: 59%). The majority of advanced users engaged in each of the 12 activities on their smartphone (Sample 1: each activity used by at least 60%; Sample 2: at least 87%), but there were a few differences across samples. Advanced users in Sample 1, compared with those in Sample 2, were less likely to post content on social media (76% vs. 93%), use Bluetooth (77% vs. 94%), engage with online banking (70% vs. 94%), or play games on their smartphone (60% vs. 87%). However, they were still much more likely to engage in these activities than the other types of smartphone users in Sample 1. Advanced users constituted the largest usage group in Sample 2, with almost half of the sample (44%) categorized into this group, but made up a considerably smaller proportion of Sample 1 (17%).
Broad non-social media users used their smartphone several times a day (Sample 1: 96%; Sample 2: 78%) and mostly rated their smartphone skills as intermediate (Sample 1: 43%; Sample 2: 40%) or advanced (Sample 1: 39%; Sample 2: 35%). They used their smartphone for a large variety of activities (Sample 1: each activity used by at least 40%; Sample 2: at least 58%), except for social media, with only 7% posting content and 24% viewing content on social media in Sample 2 and none of them viewing or posting content on social media in Sample 1. These users constituted 8% of Sample 1 and 9% of Sample 2.
Broad non-commercial users mostly used their smartphone several times a day (Sample 1: 94%; Sample 2: 67%) and rated their smartphone skills as intermediate (Sample 1: 52%; Sample 2: 40%), advanced (Sample 1: 22%; Sample 2: 30%), or beginner (Sample 1: 27%; Sample 2: 30%). They used their smartphone for a large variety of activities except for commercial activities, with only 25% using their smartphone for online banking in Sample 1 (37% in Sample 2), and 38% for online purchases in Sample 1 (45% in Sample 2). Similar to advanced users, this group showed some differences in usage patterns across samples. Broad non-commercial users in Sample 1, compared with Sample 2, were considerably less likely to use their smartphone for streaming videos or music (48% vs. 78%), playing games (33% vs. 61%), installing apps (62% vs. 90%), posting content on social media (46% vs. 71%), or using Bluetooth (43% vs. 59%). Broad non-commercial users constituted the second largest usage group in Sample 2, with almost one fourth of the sample (23%) categorized into this group, and they made up a similar proportion of Sample 1 (19%).
Social media and information users used their smartphone several times a day (Sample 1: 60%; Sample 2: 45%) and a majority rated their smartphone skills as beginner (Sample 1: 71%; Sample 2: 62%). They mainly used their smartphone to browse websites (Sample 1: 61%; Sample 2: 76%), read and/or write emails (Sample 1: 62%; Sample 2: 65%), take photos (Sample 1: 84%; Sample 2: 64%), or use social media, with 93% viewing content on social media in Sample 1 (74% in Sample 2). In Sample 2, this usage group also commonly posted content on social media (72%) although those in Sample 1 were much less likely to do so (39%). These users constituted 12% of Sample 1 but made up a smaller proportion of Sample 2 (6%).
Basic general users mostly used their smartphone several times a day (69%) in Sample 1, whereas frequency of use was more evenly distributed in Sample 2 (several times a day: 31%; every day: 35%; several times a week or less: 35%). In both samples, they mainly rated their smartphone skills as beginner (Sample 1: 56%; Sample 2: 47%) or intermediate (Sample 1: 32%; Sample 2: 39%). Almost all of them used their smartphone to take photos (Sample 1: 92%; Sample 2: 91%) and browse websites (Sample 1: 84%; Sample 2: 90%). Other popular activities included using GPS/location-aware apps (Sample 1: 61%; Sample 2: 83%) and reading and/or writing emails (Sample 1: 76%; Sample 2: 79%). Basic general users in Sample 2 also commonly installed new apps on their smartphone (80%), although those in Sample 1 were considerably less likely to do so (30%). These users constituted 25% of Sample 1, but made up a smaller proportion of Sample 2 (11%).
Camera users mostly used their smartphone several times a week or less (Sample 1: 57%; Sample 2: 62%), with only 25% using their smartphone every day in Sample 1 (23% in Sample 2) and 18% several times a day in Sample 1 (16% in Sample 2), and they rated their smartphone skills as beginner (Sample 1: 90%; Sample 2: 82%). They mainly used their smartphone to take photos (Sample 1: 72%; Sample 2: 77%). Other popular activities included browsing websites (Sample 1: 30%; Sample 2: 48%) and reading and/or writing emails (Sample 1: 45%; Sample 2: 45%). Only a small share of users (≤ 13% in both samples) were engaged with the other nine activities. They constituted 20% of Sample 1 but made up a considerably smaller proportion of Sample 2 (7%).
In summary, we identified six types of smartphone users with distinct patterns of smartphone usage frequency, self-rated smartphone skills, and activities carried out on their smartphone. Three of these types (advanced users, broad non-social media users, and broad non-commercial users) used their smartphone frequently, rated their skills as advanced or intermediate, and used their device for a large range of activities. The other three types (social media and information users, basic general users, and camera users) used their smartphone less frequently, rated their skills as beginner or intermediate, and used their device for a rather narrow set of activities.
How do the smartphone usage types differ in sociodemographic characteristics and in the operating system used?
Next, we examined how the smartphone usage types differ in sociodemographic characteristics and in the operating system. Table 4 shows the characteristics by smartphone usage class for Sample 1, and Table C2 in the Appendix shows the results for Sample 2. To test whether differences are statistically significant, we conducted Pearson's chi-squared tests and reported the p-values. We also carried out post-hoc analyses based on standardized residuals (Beasley & Schumacker, 1995) to detect which smartphone usage types most contributed to overall significant results, using the R chisq.posthoc.test package, version 0.1.2 (Ebbert, 2019).
Sociodemographic Characteristics by Class of Smartphone Use (Sample 1).
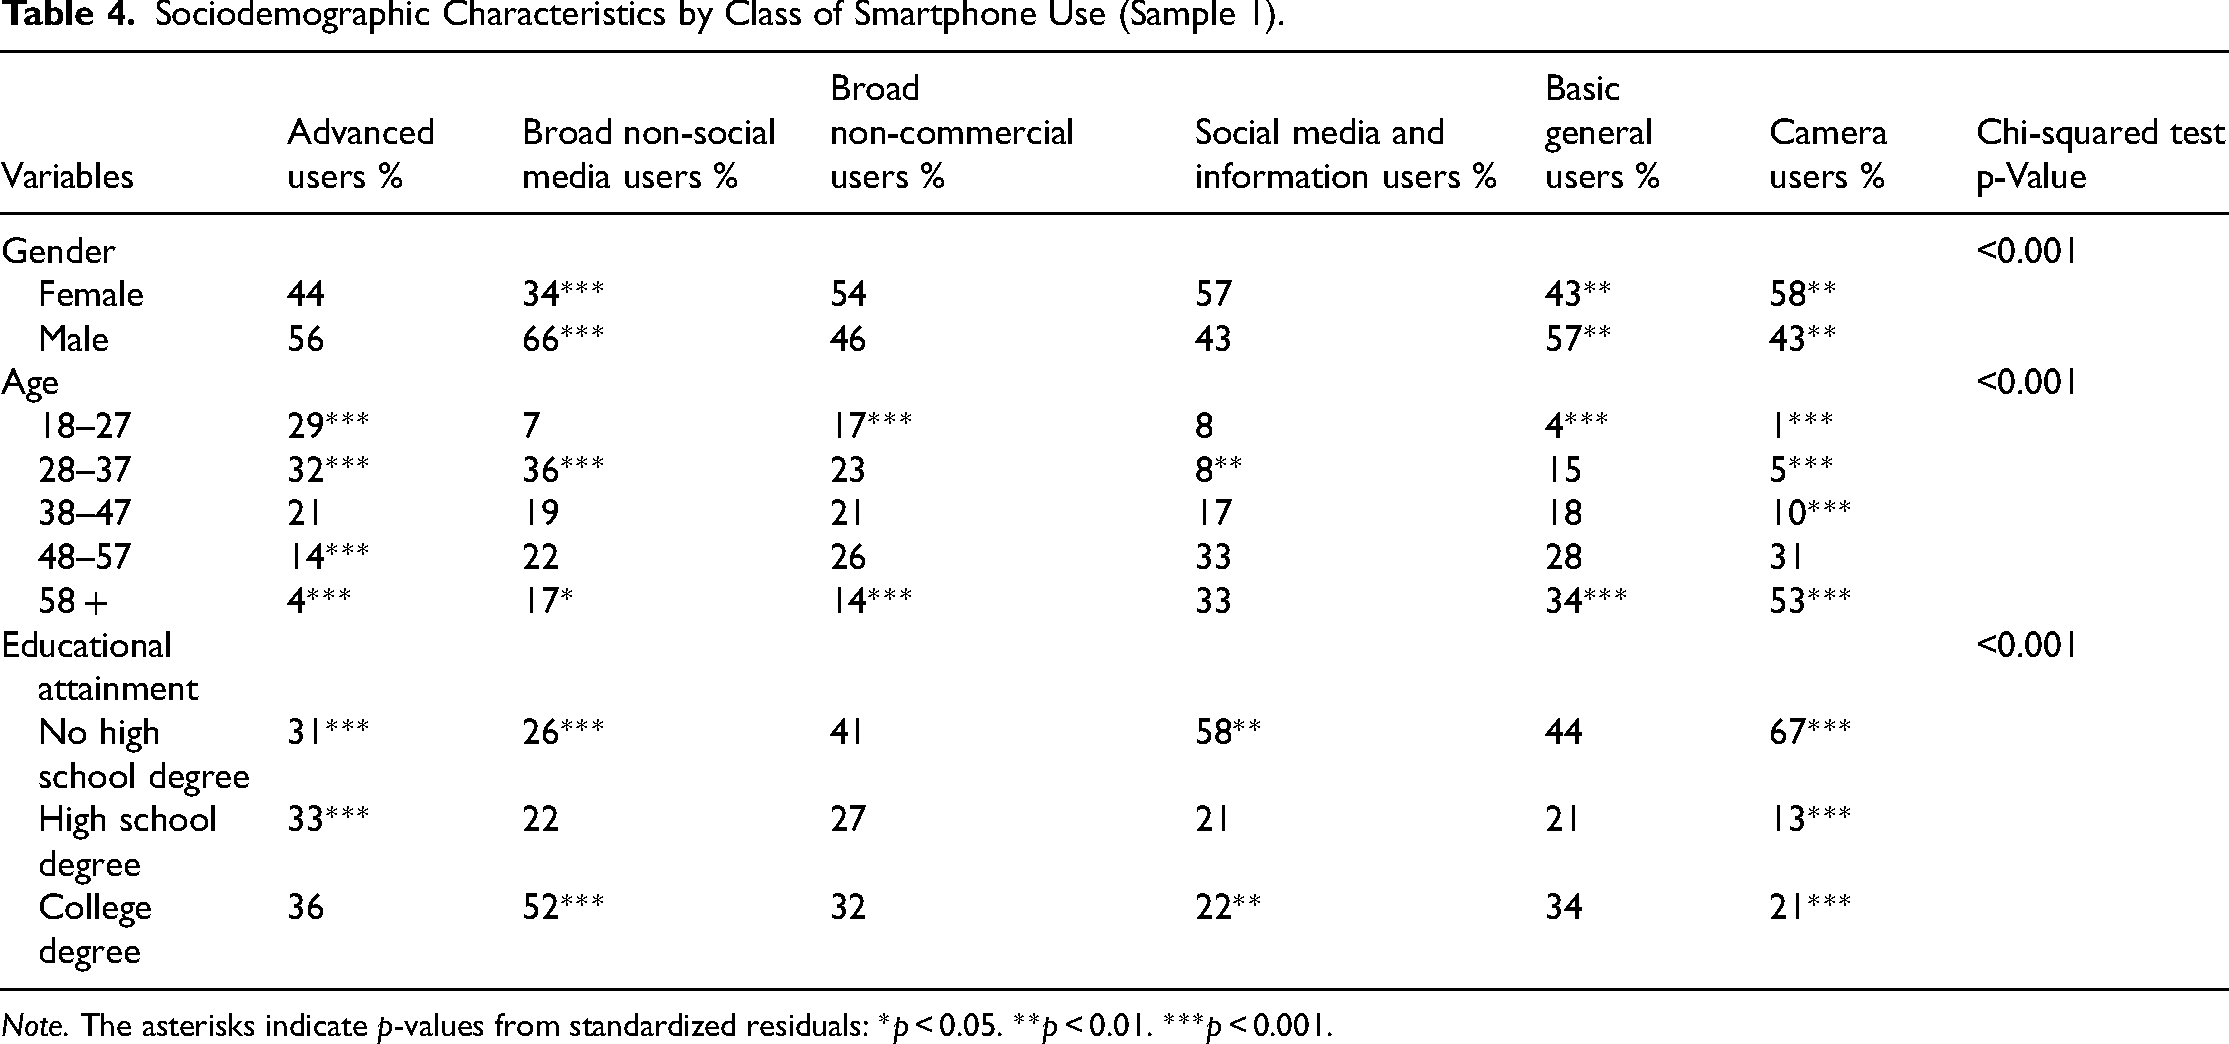
Note. The asterisks indicate p-values from standardized residuals: *p < 0.05. **p < 0.01. ***p < 0.001.
We found significant gender differences between the smartphone usage types (Sample 1: p < 0.001; Sample 2: p = 0.006). Specifically, basic general users were disproportionately male (Sample 1: 57%, p = 0.007; Sample 2: 59%, p = 0.043). Similarly, broad non-social media users were disproportionately male (Sample 1: 66%; Sample 2: 58%), although the difference was only significant for Sample 1 (p < 0.001). In contrast, camera users were disproportionately female (Sample 1: 58%; Sample 2: 53%) but, again, the difference was only significant for Sample 1 (p = 0.001). For the other four usage types, the gender distribution did not differ significantly from the entire sample.
The smartphone usage classes also had a significantly different age composition (p < 0.001 in both samples). The usage types reflecting more diverse and more frequent smartphone use were disproportionately younger. Advanced users were significantly more likely to belong to the youngest age group, with 29% of users aged 18–27 in Sample 1 (p < 0.001) and 38% aged 18–29 in Sample 2 (p < 0.001). They were also significantly less likely to belong to the oldest age group, with only 4% of users aged 58 and above in Sample 1 (p < 0.001) and 2% aged 60 and above in Sample 2 (p < 0.001). For broad non-social media users and broad non-commercial users, the age distribution was somewhat older, but they were still less likely to be part of the oldest age group, although the difference was only significant for Sample 1 (broad non-social media users: 17%, p = 0.042; broad non-commercial users: 14%, p < 0.001). In turn, the usage types reflecting more narrow and less frequent smartphone use were disproportionately older. Camera users were significantly more likely to be in the oldest age group (Sample 1: 53%, p < 0.001; Sample 2: 20%, p < 0.001) as were basic general users (Sample 1: 34%, p < 0.001; Sample 2: 16%, p < 0.001). Finally, the age composition of social media and information users did not significantly differ from the entire sample for most age groups, although they were significantly less likely to be aged 28–37 in Sample 1 (8%; p = 0.001).
The smartphone usage types also differed significantly by educational attainment (p < 0.001 in both samples). Advanced users were disproportionately more highly educated. They were significantly more likely to have a high school degree (Sample 1: 33%, p < 0.001; Sample 2: 30%, p = 0.004) and significantly less likely to be without a high school degree (Sample 1: 31%, p < 0.001; Sample 2: 38%, p < 0.001). Similarly, broad non-social media users in Sample 1 were significantly more likely to have a college degree (52%; p < 0.001) and less likely to have no high school degree (26%; p < 0.001), although the differences in educational attainment were not significant in Sample 2 for this type of smartphone user. In contrast, camera users had a disproportionately lower level of educational attainment. They were significantly more likely to be without a high school degree (Sample 1: 67%, p < 0.001; Sample 2: 57%, p = 0.013) and in Sample 1 significantly less likely to have a high school degree (13%; p < 0.001) or a college degree (21%; p < 0.001). Similarly, the proportion of people without a high school degree was disproportionately higher for broad non-commercial users in Sample 2 (51%; p = 0.020) and for social media and information users in Sample 1 (58%; p = 0.002). Finally, basic general users did not differ significantly from the entire sample in their level of educational attainment.
In Sample 2, we also found significant differences between the smartphone usage types by operating system (p < 0.001). Advanced users were disproportionately iPhone owners (33%; p < 0.001). In turn, most of the other usage types were disproportionately Android smartphone owners, including camera users (81%; p = 0.049), basic general users (79%; p = 0.030), and broad non-commercial users (76%; p = 0.014). Finally, the ratio of iPhone and Android smartphone owners among broad non-social media users and social media and information users did not differ significantly from the entire sample. The latter group, however, were disproportionately more likely to use an operating system other than iOS or Android on their smartphone (10%; p = 0.009).
In summary, we found that the smartphone usage types differed significantly by sociodemographic characteristics and operating system. The usage types reflecting more frequent and diverse smartphone use were generally younger, had higher levels of educational attainment, and were more likely to use an iPhone rather than an Android smartphone compared with the usage types that used their smartphone less frequently and for a narrower range of activities.
Discussion
Over the last decade, smartphones have become relevant for an increasing number of activities in people’s daily lives, from communication and information seeking to health- and work-related activities, some of which rely exclusively on smartphone technologies. Although a growing number of people in the general population have access to these devices, it is not yet understood to what extent they have the necessary usage experience and skills to take full advantage of their smartphone. In this paper, we contribute to the small body of research on the second-level smartphone divide by constructing a typology of smartphone users in the general population based on two nationally representative samples of smartphone owners collected in Germany in 2017 and 2020. We classify individuals based on their frequency of smartphone use, self-rated smartphone skills, and activities carried out on their smartphone, and identify six distinct types of smartphone users in both samples.
On the one hand, we identify types of smartphone owners who use their device frequently and mostly rate their smartphone skills as advanced or intermediate but differ in the types of activities they carry out on their smartphone: Advanced users use their smartphone for the full set of activities that we examined in the study, whereas broad non-social media users use their device for all activities but viewing and posting content on social media. Similarly, broad non-commercial users use their smartphone for a large variety of activities with the exception of online banking and making online purchases. Some of these groups reflect usage types that have also been identified in previous typologies of general digital media use, including advanced users (e.g., De Canio et al., 2016: “supersmartphoners”; Reisdorf & Groselj, 2017: “broad users”; Yates et al., 2020: “extensive users”) and broad non-social media users (e.g., Yates et al., 2020: “general (no social media) users”). Smartphone owners who belong to one of these usage types tend to be younger and have higher levels of educational attainment, which is in line with previous research in this area (Andone et al., 2016; Fortunati & Taipale, 2014; Serrano-Cinca et al., 2018). Advanced users also have the highest proportion of iPhone owners, which is consistent with recent research showing that iPhone users tend to be younger and have higher levels of educational attainment (Keusch et al., 2020).
On the other hand, there are other types of smartphone owners who use their device less frequently, mostly rate their smartphone skills as beginner or intermediate, and use their device for a rather specific set of activities: Camera users mainly use their smartphone to take photos, whereas social media and information users use their device to browse websites, read and/or write emails, take photos, and use social media. Finally, basic general users use their smartphone to take photos, browse websites, use GPS/location-aware apps, and read and/or write emails. Social media and information users have also been identified in previous typologies of general digital media use (e.g., Yates et al., 2020: “social and entertainment media only users”) as have basic general users (e.g., Yates et al., 2020: “utility users”). Smartphone owners who belong to these usage types tend to be older and have lower levels of educational attainment, consistent with previous research (Andone et al., 2016; Fortunati & Taipale, 2014; Serrano-Cinca et al., 2018).
Replicating the analysis in samples collected in November 2017 and January 2020 shows that the smartphone usage types identified and the correlates of smartphone use are robust, but there are a few notable differences between the samples. Overall, smartphone users in Sample 2 (2020) were more likely to engage in certain types of activities than users in Sample 1 (2017), for example, using Bluetooth to connect their smartphone to other electronic devices or engaging with online banking. This pattern points to the increasing popularity of such smartphone activities over the time frame. In addition, the size of the usage type groups identified is notably different across samples, probably due to the different age composition of the two samples. Smartphone usage types that typically consist of younger users, for example, advanced users, make up a larger proportion of Sample 2, which has a younger age distribution overall, than of Sample 1. The opposite is the case for usage types mostly consisting of older users, for example, basic general users or camera users that make up a larger proportion of Sample 1 than of Sample 2.
A key takeaway message from our study is that although smartphones have become deeply integrated into most people's daily lives, smartphone usage patterns continue to be highly diverse, and a sizable proportion of smartphone owners still use their device for a rather narrow set of activities. The observed variation in smartphone use highlights the importance of a more nuanced perspective on smartphone users that future research on the digital divide should take into account. As smartphones are increasingly required for digital activities, the differential usage patterns of smartphone owners also have implications for the potential benefits they can obtain from using their device, referred to as the third-level digital divide (van Deursen & Helsper, 2015). Even among the types reflecting more frequent and diverse use in our study, individuals varied in their experience with mobile banking, mobile payments, and mobile communication, and are potentially excluded from these activities in their everyday lives. A second key takeaway message from our study is that inequalities in smartphone use reflect existing social inequalities with regard to age and education, which replicates previous research on general Internet and digital media use. Smartphone owners using their device less frequently and for a narrower set of activities are disproportionately older and have lower levels of educational attainment than more advanced smartphone users.
Our study is not free of limitations. First, we relied on self-reported measures of smartphone use and smartphone-related skills that are susceptible to measurement error. Respondents might not be able to remember the frequency, duration, or variety of their smartphone use accurately, and the resulting self-reports are likely to be biased (Boase & Ling, 2013). Social desirability might also lead respondents to overrate their level of skills (Palczyńska & Rynko, 2021). Future research might consider replicating our analysis with passively collected or performance-based measures of smartphone use and skills (Festic et al., 2021; Hamka et al., 2014; Hargittai, 2002). Second, although we aimed to cover the most popular activities carried out on smartphones, our list of activities might not have been exhaustive. In addition, our measure of smartphone-related skills consists of one survey item and might not have fully captured the multidimensionality of digital skills. We would welcome future studies that implement more detailed versions of these measures. Third, although we investigated the robustness of our typology across multiple samples, we were only able to examine differences over a relatively short period of approximately two years. A potential avenue for future research would be to study changes in the second-level smartphone divide over a longer period of time.
Footnotes
Data availability statement
The data used in this study are publicly available at the GESIS Data Archive for the Social Sciences (Sample 1: https://doi.org/10.4232/1.13043; Sample 2: ![]() ). The analysis code is available at https://doi.org/10.17605/OSF.IO/X748K.
). The analysis code is available at https://doi.org/10.17605/OSF.IO/X748K.
Declaration of conflicting interests
The author(s) declared no potential conflicts of interest with respect to the research, authorship, and/or publication of this article.
Funding
The author(s) disclosed receipt of the following financial support for the research, authorship, and/or publication of this article: This work was supported by the German Research Foundation (DFG) through the Collaborative Research Center SFB 884 “Political Economy of Reforms” (Project A8) [139943784 to Annelies Blom, Florian Keusch, and Frauke Kreuter].
Notes
Author biographies
Alexander Wenz is a postdoctoral fellow at the Mannheim Centre for European Social Research at the University of Mannheim. His research examines the quality of novel methods of data collection, with a focus on mobile web surveys and passive measurement with smartphone apps and wearable sensors.
Florian Keusch is Professor of Social Data Science and Methodology at the School of Social Sciences at the University of Mannheim. In his research he develops, implements, and assesses the quality of novel methods of collecting data for the behavioral and social sciences.
Appendix A. Questionnaire
Variables Used in the Latent Class Analysis.
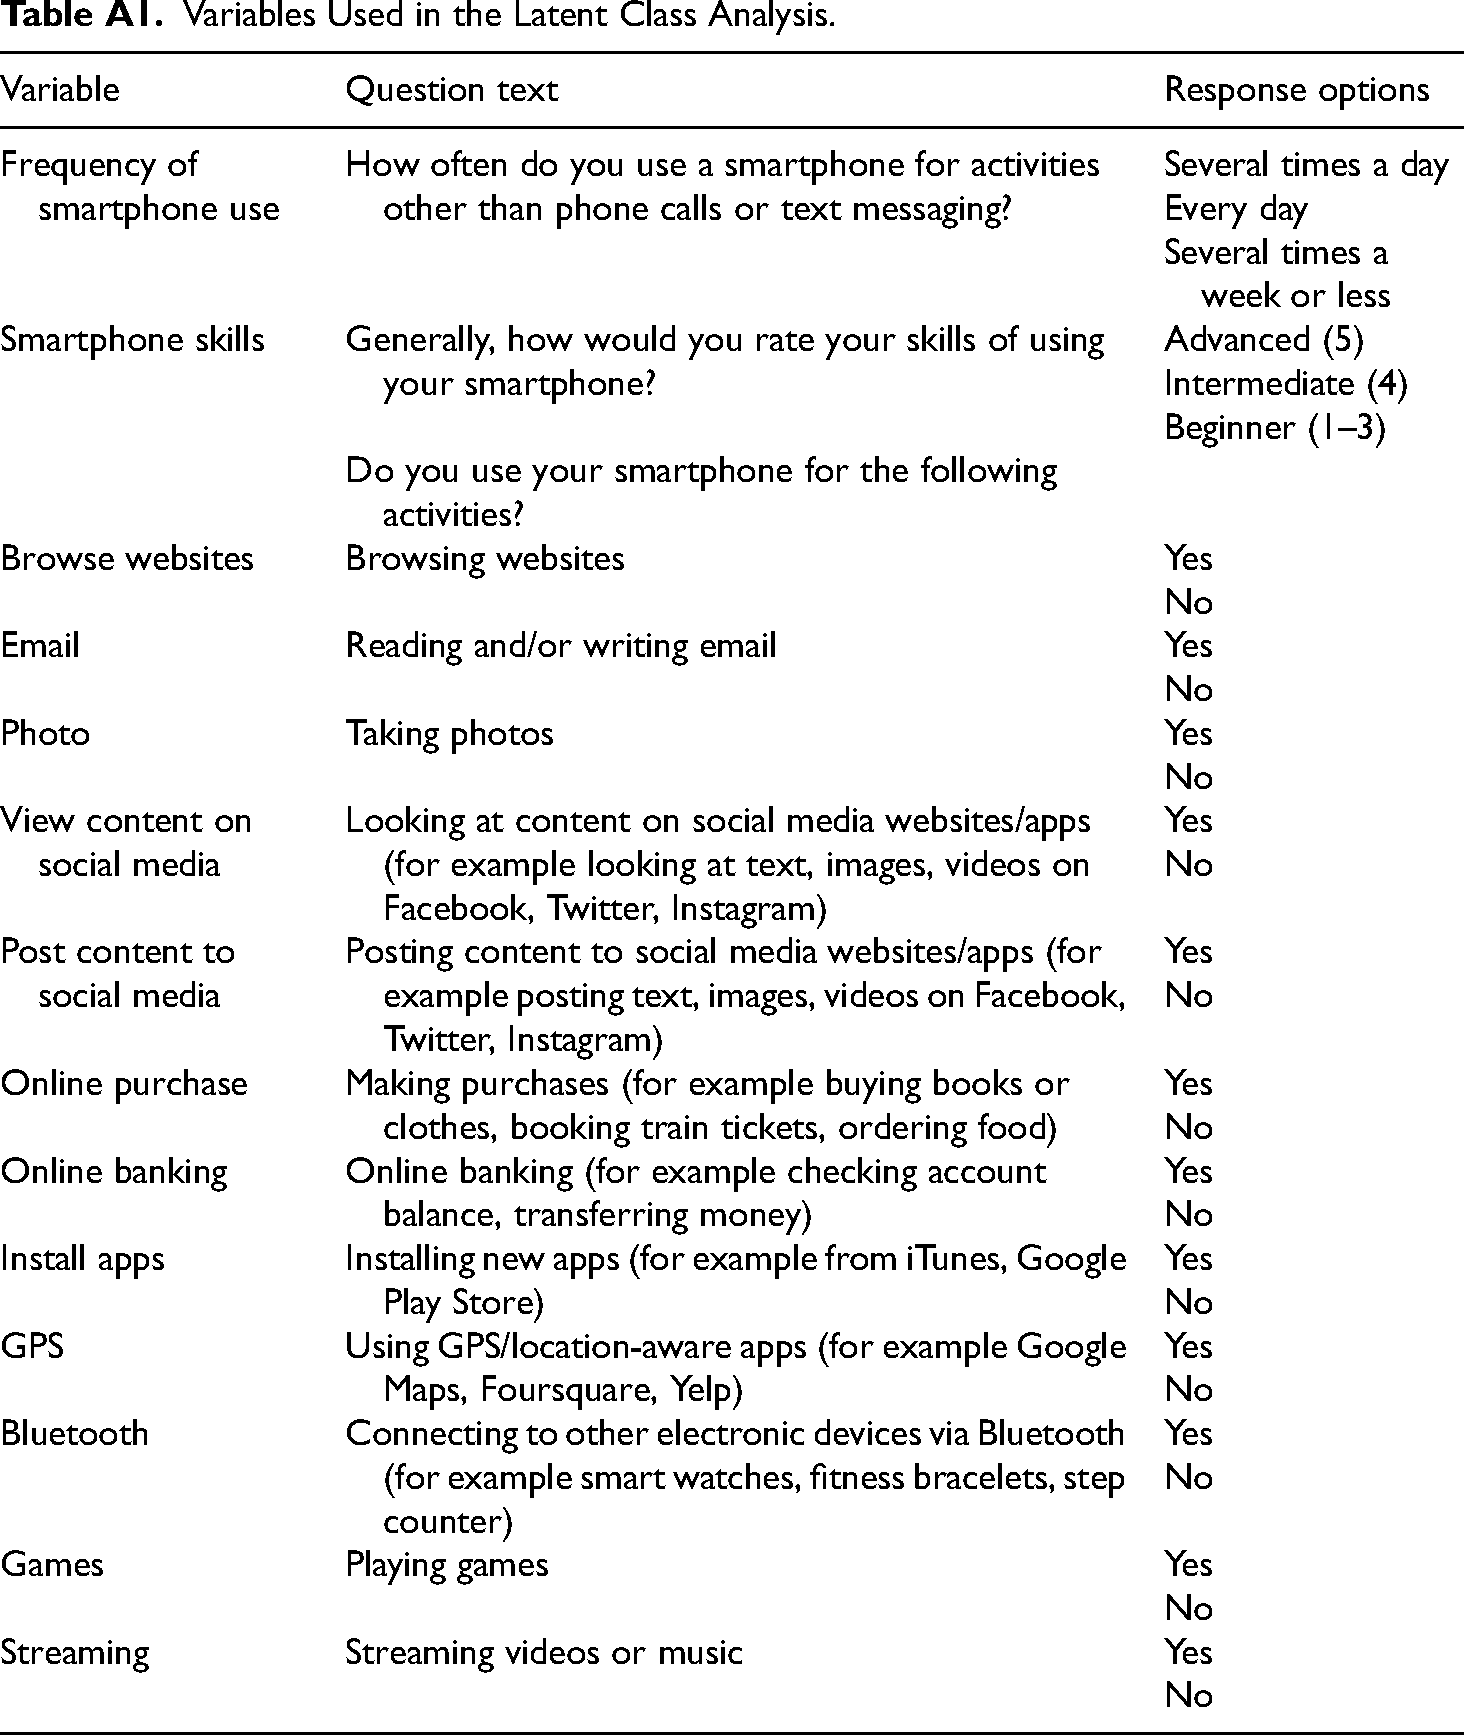
| Variable | Question text | Response options |
|---|---|---|
| Frequency of smartphone use | How often do you use a smartphone for activities other than phone calls or text messaging? | Several times a day |
| Every day | ||
| Several times a week or less | ||
| Smartphone skills | Generally, how would you rate your skills of using your smartphone? | Advanced (5) |
| Intermediate (4) | ||
| Beginner (1–3) | ||
| Do you use your smartphone for the following activities? | ||
| Browse websites | Browsing websites | Yes |
| No | ||
| Reading and/or writing email | Yes | |
| No | ||
| Photo | Taking photos | Yes |
| No | ||
| View content on social media | Looking at content on social media websites/apps (for example looking at text, images, videos on Facebook, Twitter, Instagram) | Yes |
| No | ||
| Post content to social media | Posting content to social media websites/apps (for example posting text, images, videos on Facebook, Twitter, Instagram) | Yes |
| No | ||
| Online purchase | Making purchases (for example buying books or clothes, booking train tickets, ordering food) | Yes |
| No | ||
| Online banking | Online banking (for example checking account balance, transferring money) | Yes |
| No | ||
| Install apps | Installing new apps (for example from iTunes, Google Play Store) | Yes |
| No | ||
| GPS | Using GPS/location-aware apps (for example Google Maps, Foursquare, Yelp) | Yes |
| No | ||
| Bluetooth | Connecting to other electronic devices via Bluetooth (for example smart watches, fitness bracelets, step counter) | Yes |
| No | ||
| Games | Playing games | Yes |
| No | ||
| Streaming | Streaming videos or music | Yes |
| No |
Appendix B. Descriptive statistics
Descriptive Statistics of Measures before Recoding.
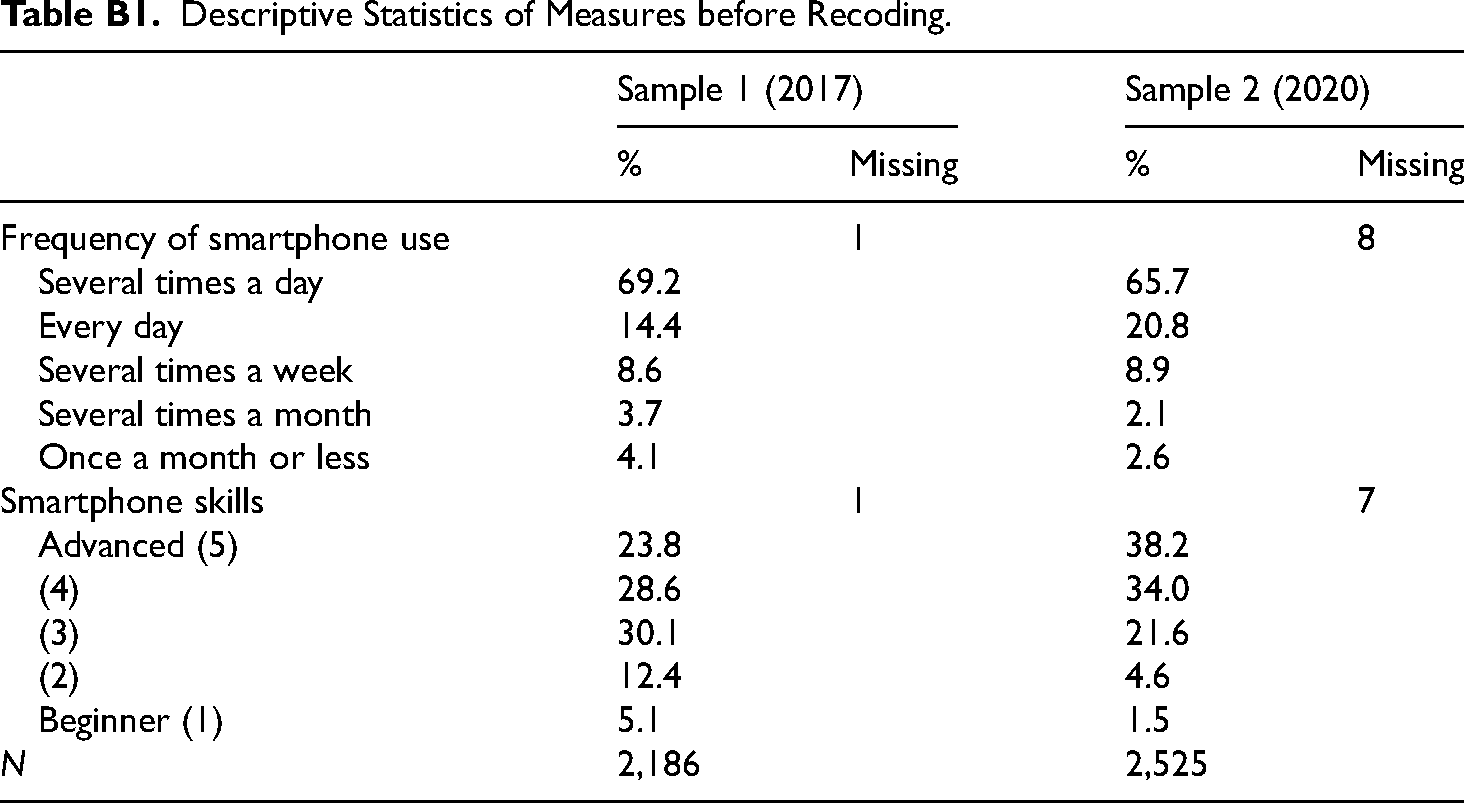
| Sample 1 (2017) | Sample 2 (2020) | |||
|---|---|---|---|---|
| % | Missing | % | Missing | |
| Frequency of smartphone use | 1 | 8 | ||
| Several times a day | 69.2 | 65.7 | ||
| Every day | 14.4 | 20.8 | ||
| Several times a week | 8.6 | 8.9 | ||
| Several times a month | 3.7 | 2.1 | ||
| Once a month or less | 4.1 | 2.6 | ||
| Smartphone skills | 1 | 7 | ||
| Advanced (5) | 23.8 | 38.2 | ||
| (4) | 28.6 | 34.0 | ||
| (3) | 30.1 | 21.6 | ||
| (2) | 12.4 | 4.6 | ||
| Beginner (1) | 5.1 | 1.5 | ||
| N | 2,186 | 2,525 | ||
Appendix C. Sample 2
Sociodemographic Characteristics and Operating System by Class of Smartphone Use (Sample 2).
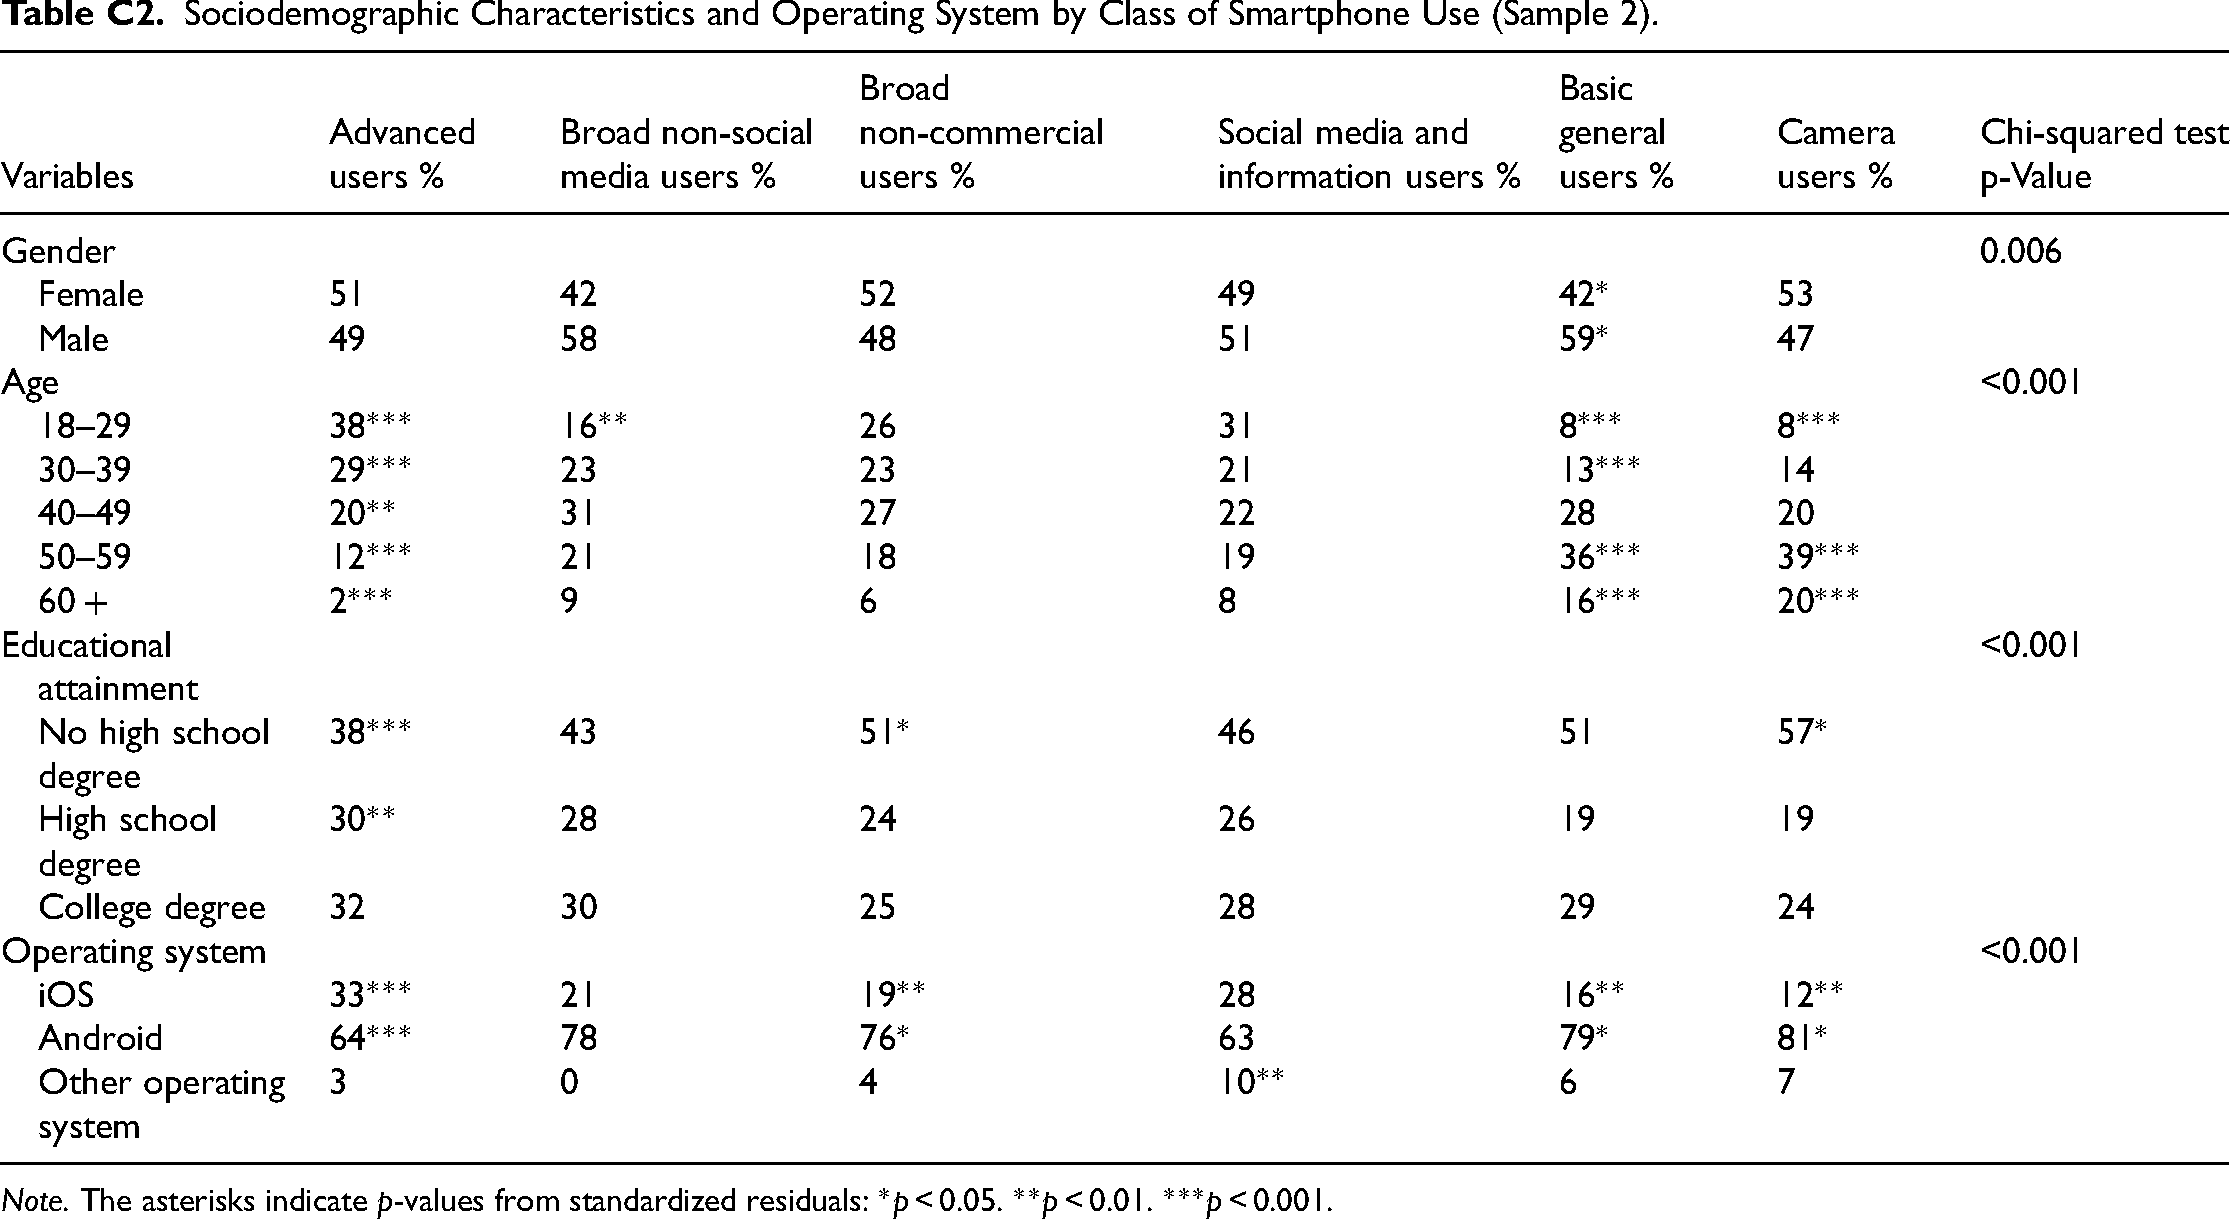
| Variables | Advanced users % | Broad non-social media users % | Broad non-commercial users % | Social media and information users % | Basic general users % | Camera users % | Chi-squared test p-Value |
|---|---|---|---|---|---|---|---|
| Gender | 0.006 | ||||||
| Female | 51 | 42 | 52 | 49 | 42* | 53 | |
| Male | 49 | 58 | 48 | 51 | 59* | 47 | |
| Age | <0.001 | ||||||
| 18–29 | 38*** | 16** | 26 | 31 | 8*** | 8*** | |
| 30–39 | 29*** | 23 | 23 | 21 | 13*** | 14 | |
| 40–49 | 20** | 31 | 27 | 22 | 28 | 20 | |
| 50–59 | 12*** | 21 | 18 | 19 | 36*** | 39*** | |
| 60 + | 2*** | 9 | 6 | 8 | 16*** | 20*** | |
| Educational attainment | <0.001 | ||||||
| No high school degree | 38*** | 43 | 51* | 46 | 51 | 57* | |
| High school degree | 30** | 28 | 24 | 26 | 19 | 19 | |
| College degree | 32 | 30 | 25 | 28 | 29 | 24 | |
| Operating system | <0.001 | ||||||
| iOS | 33*** | 21 | 19** | 28 | 16** | 12** | |
| Android | 64*** | 78 | 76* | 63 | 79* | 81* | |
| Other operating system | 3 | 0 | 4 | 10** | 6 | 7 |
Note. The asterisks indicate p-values from standardized residuals: *p < 0.05. **p < 0.01. ***p < 0.001.