
Abstract
Background:
At present, there is a need for more substantial real-world evidence on the factors influencing the effectiveness of tuberculosis (TB) treatment in HIV/TB co-infected patients.
Objectives:
This retrospective study aims to identify factors affecting TB treatment effectiveness in HIV/TB co-infected patients.
Design:
Retrospective cross-sectional study.
Methods:
We included 461 HIV/TB co-infected patients, deriving 742 samples based on each initial positive TB test period. A total of 7788 valid treatment records corresponding to 17 TB drug compositions and 150 clinical indicators (each > 100 records) were used for analysis. Data mining techniques were employed, including consensus clustering, Fisher’s exact test, stratified analysis, multivariate logistic regression analysis, and three modeling approaches (logistic regression, support vector machine, and random forest).
Results:
The TB treatment effectiveness of CD4+ T cell count ⩽ 42 is significantly lower than that of the sample group > 42 (aOR: 1.77, 95% CI: 1.15–2.74, p = 0.010). The TB treatment effectiveness of the “rifabutin and levofloxacin alone or in combination” group is significantly higher than that of the “other first- and second-line anti-TB drugs in combination” group (aOR: 0.10, 95% CI: 0.01–0.64, p = 0.022). Significant differences exist in factors between TB treatment effective and ineffective groups, including age (aOR: 2.12, 95% CI: 1.10–4.20, p = 0.027), pre-treatment high-density lipoprotein (HDL) cholesterol (aOR: 0.47, 95% CI: 0.25–0.89, p = 0.022), pre-treatment CD8+ T cell count (aOR: 0.55, 95% CI: 0.33–0.90, p = 0.019), pre-treatment neutrophil percentage (aOR: 0.68, 95% CI: 0.48–0.96, p = 0.030), rifabutin (aOR: 1.59, 95% CI: 1.09–2.32, p = 0.016), and cycloserine (aOR: 0.21, 95% CI: 0.03–0.77, p = 0.041). The best area under the receiver operating characteristic curve of the test set under three modeling methods is 0.560–0.763. Rate of lymphocyte percentage recovering to normal is significantly higher in the TB treatment-effective group than in the treatment-ineffective group (aOR: 1.83, 95% CI: 1.09–3.10, p = 0.022).
Conclusion:
CD4+ T cell count of 42/μL assists TB treatment effectiveness evaluation. Rifabutin and levofloxacin show more therapeutic benefits. Lymphocyte percentage can serve as an effective TB therapeutic and diagnostic target. Age, pre-treatment factors (HDL cholesterol, CD8+ T cell count, and neutrophil percentage), rifabutin, and cycloserine are significantly associated with TB treatment effectiveness. Factors affecting TB treatment effectiveness for HIV/TB co-infected patients need more evidence.
Plain language summary
Why was the study done? HIV/TB co-infection leads to worse disease progression, even deaths worldwide. It is essential to understand what factors influence TB treatment effectiveness for HIV/TB co-infected patients. What did the researchers do? We analyzed the TB therapeutic effectiveness, medication regimens, and clinical indicators of 461 HIV/TB co-infected patients to identify potential essential relationships. What did the researchers find? We found several key insights: CD4+ T cell count of 42 cells/μL can assist in evaluating TB treatment effectiveness. Rifabutin and levofloxacin, alone or in combination, are more effective than other first- and second-line anti-TB agents. Lymphocyte percentage can serve as an effective TB therapeutic and diagnostic target. Age, pre-treatment factors (HDL cholesterol, CD8+ T cell count, neutrophil percentage), rifabutin, and cycloserine relate to TB treatment effectiveness. Factors affecting TB treatment effectiveness for HIV/TB co-infected patients need more evidence. What did the findings mean? These findings provided valuable information on the clinical aspect of the relationship between clinical indicators/medication regimens and TB treatment effectiveness for HIV/TB co-infected patients.
Keywords
Introduction
Tuberculosis (TB) is the leading cause of death globally from a single infectious agent1,2 surpassing HIV. HIV/TB co-infection can accelerate disease progression, and its prevention and treatment have become a significant clinical challenge.3–5 In recent years, updates on the prevalence, mortality rate, and treatment guidelines for HIV/TB co-infection have mainly focused on drug resistance.6–8 For patients with drug-sensitive (DS)-TB, 9 multidrug-resistant (MDR)-TB,10–13 extensively drug-resistant (XDR)-TB, 14 and latent TB, ongoing clinical trials will hopefully transform the landscape of treatment by evaluating novel agents, repurposed agents, adjunctive host-directed therapies, and novel treatment strategies. 6 More real-world evidence to evaluate TB treatment effects and explore therapeutic influencing factors in co-infected patients. 15 A small amount of real-world research suggests that TB therapeutic outcomes are affected by the level of the immune system, based on which more precise TB medical strategies can be provided for co-infected patients with specific immune levels.16,17
Achieving the World Health Organization’s End TB strategy (a 90% decrease in TB incidence and a 95% decrease in TB mortality by 2035 compared with 2015) requires shorter and more effective treatment regimens, 18 especially for HIV/TB co-infected individuals. 19 According to guidelines for diagnosing and treating HIV in China, the main anti-TB drugs used are isoniazid, rifampicin, rifabutin, ethambutol, and pyrazinamide. If Mycobacterium tuberculosis (Mtb) is sensitive to first-line anti-TB agents, a 2-month intensive treatment with “isoniazid + rifampicin (rifabutin) + ethambutol + pyrazinamide” is followed by a 4-month consolidation treatment with “isoniazid + rifampicin (rifabutin).” 20 The treatment course should be extended to 9 months for patients with a delayed response to anti-TB therapy (the culture of Mtb remains positive after 2 months of treatment) and bone and joint TB and to 9–12 months for patients with central nervous system TB (ART should be started as early as 2 weeks after anti-TB therapy21–24). For co-drug-resistant TB (including MDR-TB and XDR-TB), ART therapy is initiated within 8 weeks of starting second-line anti-TB drugs. However, few retrospective studies evaluate the effectiveness and influencing factors of these treatment programs.25–27 The conclusions about factors that may influence therapeutic outcomes are unclear, 28 partly due to a lack of research innovation over the past few decades aimed at optimizing TB treatment guidelines for HIV patients. 29 Additionally, for patients who have been effectively treated for TB, insufficient research evidence supports the clinical indicators’ recovery to normal levels. Further research is necessary to identify potential clinical markers for diagnosis and treatment.
Based on in-patient and partial out-patient data on HIV/TB comorbidities from 2010 to 2020 at the Shanghai Public Health Clinical Center, this study focuses on immune levels, therapeutic regimens, and other potential clinical indicators that affect the effectiveness of TB treatment in HIV/TB co-infected individuals, providing more real-world research evidence. Machine learning algorithms are used to construct prediction models for effective TB treatment, supplementing the knowledge gap for personalized treatment in the future. For HIV/TB co-infected patients who have been effectively treated for TB, the preliminary screening of clinical indicators for apparent recovery to normal level offers a possible perspective for identifying potential therapeutic and diagnostic targets.
Methods
Guideline statement
This study conformed to the Strengthening the Reporting of Observational Studies in Epidemiology (STROBE) statement. 30
Retrospective study design
Periods of study
Data included medical records exported from the Shanghai Public Health Clinical Center’s Hospital Information System, Electronic Medical Record System, and Laboratory Information System, covering patient hospitalization and follow-up information from June 2010 to September 2020. The raw data were organized into a formatted EXCEL table in December 2020 by cleaning, splitting, integrating, transforming, and simplifying.
Patient enrollment and data collection
Criteria for TB disease
A patient is considered to have TB if any Mtb test result, including sputum, blood, lavage fluid, feces, cerebrospinal fluid, pleural fluid, secretion, urine, and other samples, is positive. 31
Criteria for effective anti-TB drug treatment
After taking anti-TB drugs for at least 1 week (⩾7 days), the changes from positive to negative Mtb test results are recorded as 1 (effective drug treatment). Contrastingly, persistently positive results are recorded as zero (ineffective drug treatment). Negative initial samples are excluded from the analysis.
Criteria for evaluating HIV status and efficacy
CD4+ T cell count and CD4+/CD8+ ratio are vital indicators to evaluate the immune function of HIV-infected individuals. In healthy people, CD4+ T cell count is higher than 500 cells/μL, and the range of CD4+/CD8+ is 1.5–2.5. 32
Screening model of valid samples and their relevant information
In this study, we designed a set of methods to define valid samples and to screen for sample information (Figure 1). Unlike conventional studies, in which one patient’s records are treated as one sample, we treated each interval between two adjacent Mtb test time points as one sample, allowing a single patient to correspond to multiple samples. The screening criterion of each clinical indicator was that the indicator test results were within 7 days before and after the TB test time point (values within the reference range were denoted as 0-normal, otherwise denoted as 1-abnormal). The clinical indicator was considered abnormal if one test record was abnormal (Figure 1(a)). Valid medication records were screened in each sample unit according to the relative position of the medication start time and previous TB test time, as well as the presence or absence of medication end-time records. For each patient’s first TB test period, the medication start time was the same as or later than the first TB test time (Figure 1(b)). For the patient’s other TB test periods except for the first one, the medication start time could be before or later than the pre-TB test time (Figure 1(c)). Drug records that lasted 7 days or more during the TB test period were included in the therapeutic regimen of each sample unit. When calculating the final duration of medication for the same drug that was repeatedly included, if there was only one drug record without an end time, the durations of medication for all the included records of the same drug were added together; if there was more than one drug record without an end time, the most prolonged duration among all the drug records without an end time was included, followed by adding it to the duration of other drug records with an end time (Figure 1(b) and (c)).

Model of effective sample screening and statistical information.
The original EXCEL data for this study included a total of 1566 HIV/TB patients, of whom 1483 had treatment records, and 1430 had TB test records. The test records from different tissues of the 1430 patients at the same time were unified into one record. The results of TB tests with an interval of ⩽7 days were combined (i.e., taking each test time as the “origin,” the records of the first positive test or the earliest negative test within 7 days before and after this point were recorded as the test results of this interval). When the interval between the two tests was >7 days, 1166 co-infected patients were detected after the screening. After excluding patients with only one TB test record, 743 co-infected patients remained and were divided into 1698 samples. After extracting sample information using the above screening model, only samples with positive initial TB test result were reserved, resulting in 742 effective samples corresponding to 461 patients for data mining.
Figure 1(a) shows the medications and clinical test information for each sample unit defined in this study. “Pre/Pro TB test time” represents the time point of Mtb test before and after treatment. The “Pre/Pro clinical indicators test period (±7d)” represents each clinical indicator’s test period before and after treatment. Figure 1(b) shows the screening conditions for the drug use records in the sample units corresponding to each patient’s first TB test period. Figure 1(c) shows the drug record screening conditions of the sample units corresponding to the other TB test periods, except for the first one, for patients with more than one TB test period.
Statistical analysis
R 4.1.3 Statistical Software was used for data processing. Demographics, clinical indicators, and drug use were discretized before analysis. Demographics were coded as follows: age < 60 as 0, age ⩾ 60 as 1; male as 0, female as 1; non-HBV as 0, HBV as 1; no smoking/drinking/drug-taking as 0, smoking/drinking/drug-taking as 1. Clinical indicator results were coded as 0 for normal (within reference range) and 1 for abnormal (outside reference range). Drug use was coded as 0 for no medication use and 1 for medication use. First, Fisher’s exact test and stratified analysis were used to test the treatment effectiveness among different immune level groups or drug regimen groups. We used the “stepwise method” based on CD4+ T cell counts to determine the best grouping criteria of immune levels. We conducted consensus clustering on the data of drugs in the samples containing drug records and initial CD4+ T cell counts. We selected the best drug classification number according to the Proportion of Ambiguous Clustering (PAC) method based on the duration of each drug used in the samples. We classified each sample into a drug regimen or combination drug regimen group according to the drug use condition. We showed the odds ratio (OR), 95% confidence interval (CI), and p-values of TB treatment effectiveness and confounding variables between groups in Fisher’s exact test. Second, we explored the potential factors affecting the TB treatment effectiveness and constructed prediction models using logistic regression (LR), support vector machine (SVM), and random forest (RF) algorithms. We used the area under the receiver operating characteristic curve (AUC), accuracy, precision, recall, specificity, and F1 score with five-fold cross-validation to evaluate the model performance comprehensively. When the test set accuracy was highest, we selected the corresponding data group and model to draw the ROC curve and displayed the corresponding optimal AUC. We reported the mean ± standard deviation results for other evaluation indicators by randomly splitting the train and test sets five times. We selected the most accurate and reliable prediction algorithm to construct separate models with the critical variables, which were evaluated using the model performance indexes presented above. Third, we explored potential TB therapeutic and diagnostic targets for HIV/TB co-infected patients by comparing the recovery of the clinical indicators between the effective and ineffective treatment groups. All difference analysis results excluded the confounding variables of sex and age. We performed multivariable LR analysis to exclude the confounding variables to generate the adjusted odds ratio (aOR), 95% CI, and p-values.
Results
Characteristics of valid samples
Demographics information
In this study, we collected 461 HIV/TB patients who included two or more Mtb test and medication records, deriving 742 valid sample intervals with positive initial Mtb test results (Table 1). For the 742 valid samples, the average interval length was 74.6 days, with 80.5% of samples lower than 74.6 days and 96.64% lower than 1 year. The average duration of medication was 11.75 days, and the period of drug treatment ⩾7 days accounted for 58.3%.
Summary of basic information on the 742 valid samples.

Within 742 valid samples, 568 samples contained drug records definitely during the TB test period, the average length of which was 78.4 days, satisfying the standards of routine examination. The average duration of medication was 76.1 days, meeting the criterion of TB drug treatment rules. Within 568 samples, 547 samples with less than 1 year of TB test period were selected to analyze the relationship between clinical indicators (excluding immunity indicators) and TB treatment effectiveness. Within 547 samples, 347 samples with the initial CD4+ T cell counts were selected to investigate the relationship between immune levels/drug regimens and treatment effectiveness (Figure 2).

Work flow of the analysis.
Figure 2 shows the sample filtering and the three analysis parts used in this study. 742 TB valid samples were filtered based on the screening conditions and methods shown in Figure 1, and 568 samples containing drug records were obtained. The 547 samples with less than 1 year of TB test period among the 568 samples were selected as primary valid samples for follow-up research on specific issues. PART I comprehensively explores the influence of patients’ immune levels and medication regimens on TB treatment effectiveness using univariate analysis and stratified analysis. PART II shows the details of constructing the prediction model of “TB treatment effectiveness - clinical indicators/drug regimens” based on univariate analysis and three machine learning algorithms. PART III describes the univariate analysis to explore the clinical indicators that significantly recover from abnormal to normal conditions in the effective TB treatment group compared with the ineffective group. All the results of Fisher’s exact test were adjusted by multivariable LR analysis for sex and age.
Medication information
For the cleaned drug records, 4755 (61%) records included both the start and end times of medication, while 3033 (39%) missed the end times. According to the clinicians’ instructions, the 17 anti-TB drugs were classified into six categories based on their core chemical compositions, including rifamycin antibiotics (3), isoniazid (1), ethambutol (1), pyrazinamide (1), fluoroquinolone (1), and other second-line anti-TB drugs (10) (Figure 3).
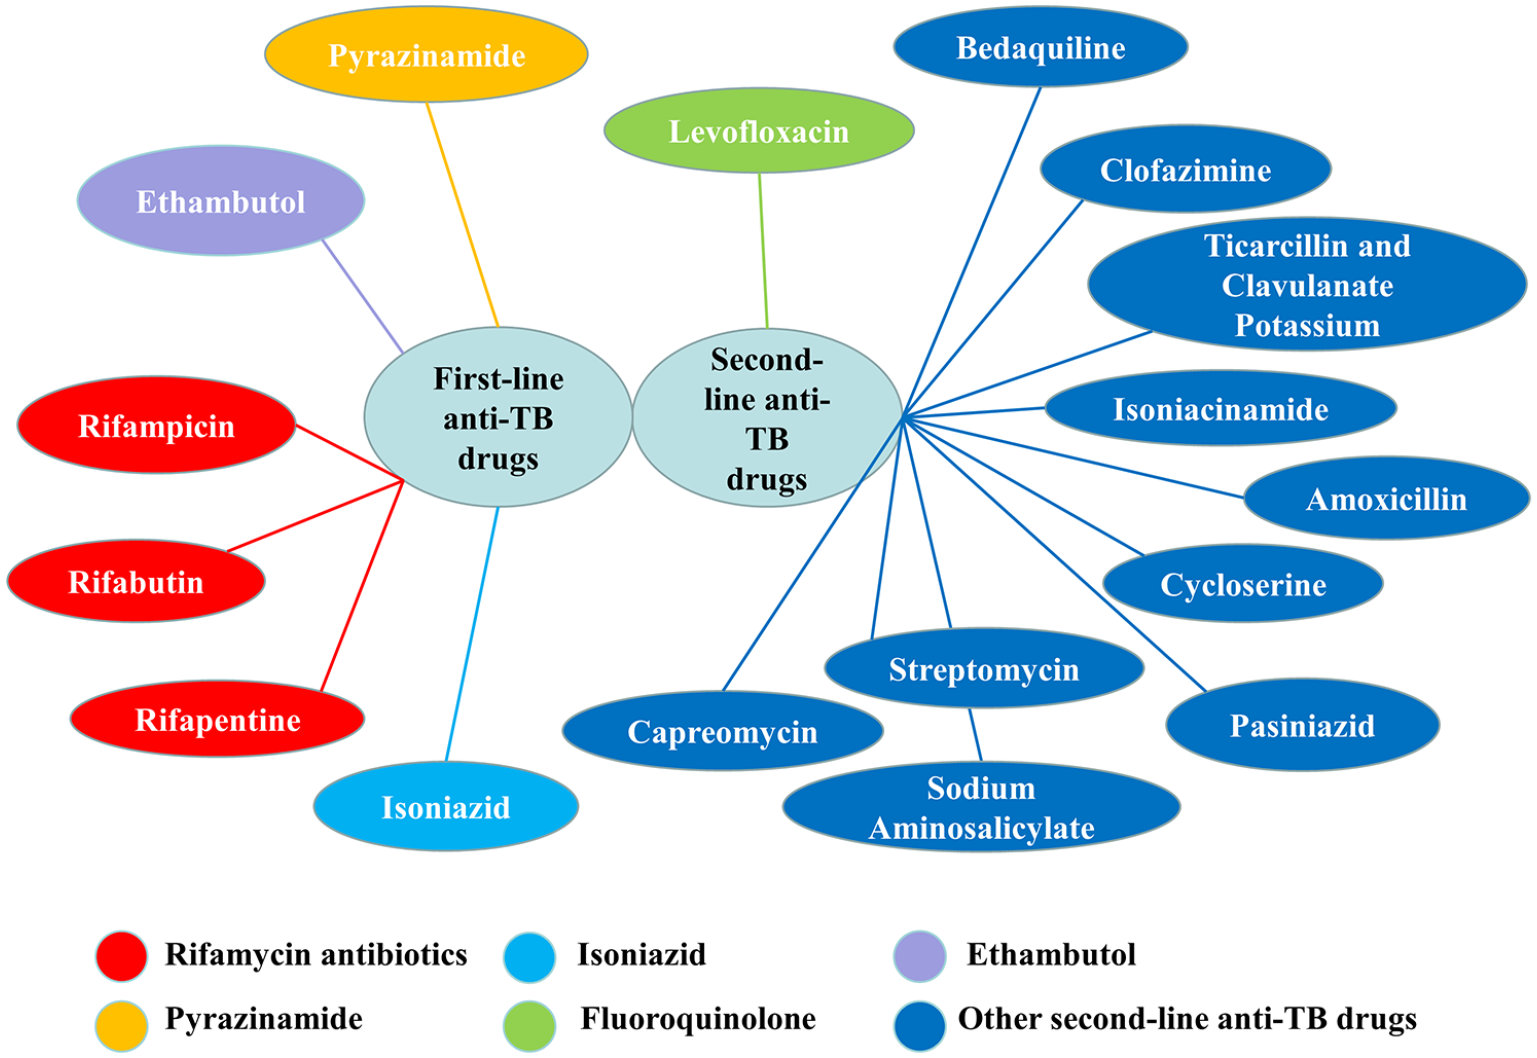
Summary of chemical constituents of anti-TB drugs.
Clinical information
The clinical information of the 742 samples included demographics and routine clinical tests, which were divided into eight categories: demographics (6), routine blood examination (20), routine urine examination (11), blood biochemical examination (76), cerebrospinal fluid (CSF) examination (22), nucleic acid test (4), immunologic test (4), and routine microbiological examination (7). The number of clinical indicators with more than 100 records in each category is shown in parentheses. A total of 150 clinical indicators with >100 records were included in the follow-up studies (Figure 4).

150 clinical indicators from eight categories (including demographics).
Effects of drugs and immune levels on TB treatment effectiveness
Effects of CD4+ T cell counts
In our study, for the 347 samples containing initial CD4+ T cell counts, we showed the grouping criteria of CD4+ T cell count, the number of samples in each group, and the top ten results of difference analysis in treatment effectiveness between the two groups divided by different CD4 levels (ordered by p-values of Fisher’s exact test) (Table 2). Based on the consideration of p-value (the smaller, the better) and sample balance (the more robust, the better), we chose 42 cells/µL as the optimal grouping criterion of CD4+ T cell count for subsequent stratified analysis. The samples with effective treatment accounted for 37.71% in the group (CD4 ⩽ 42), which significantly increased to 52.33% in the group (CD4 > 42) (OR: 1.81, 95% CI: 1.16–2.84, p = 0.007). After excluding the two confounding factors, age (OR: 1.24, 95% CI: 0.47–3.29, p = 0.665) and sex (OR: 1.73, 95% CI: 0.79–3.90, p = 0.151), the TB treatment effectiveness difference between two groups was still significant (aOR: 1.77, 95% CI: 1.15–2.74, p = 0.010).
Difference analysis results between the two groups divided by CD4+ T cell counts with stepwise method.
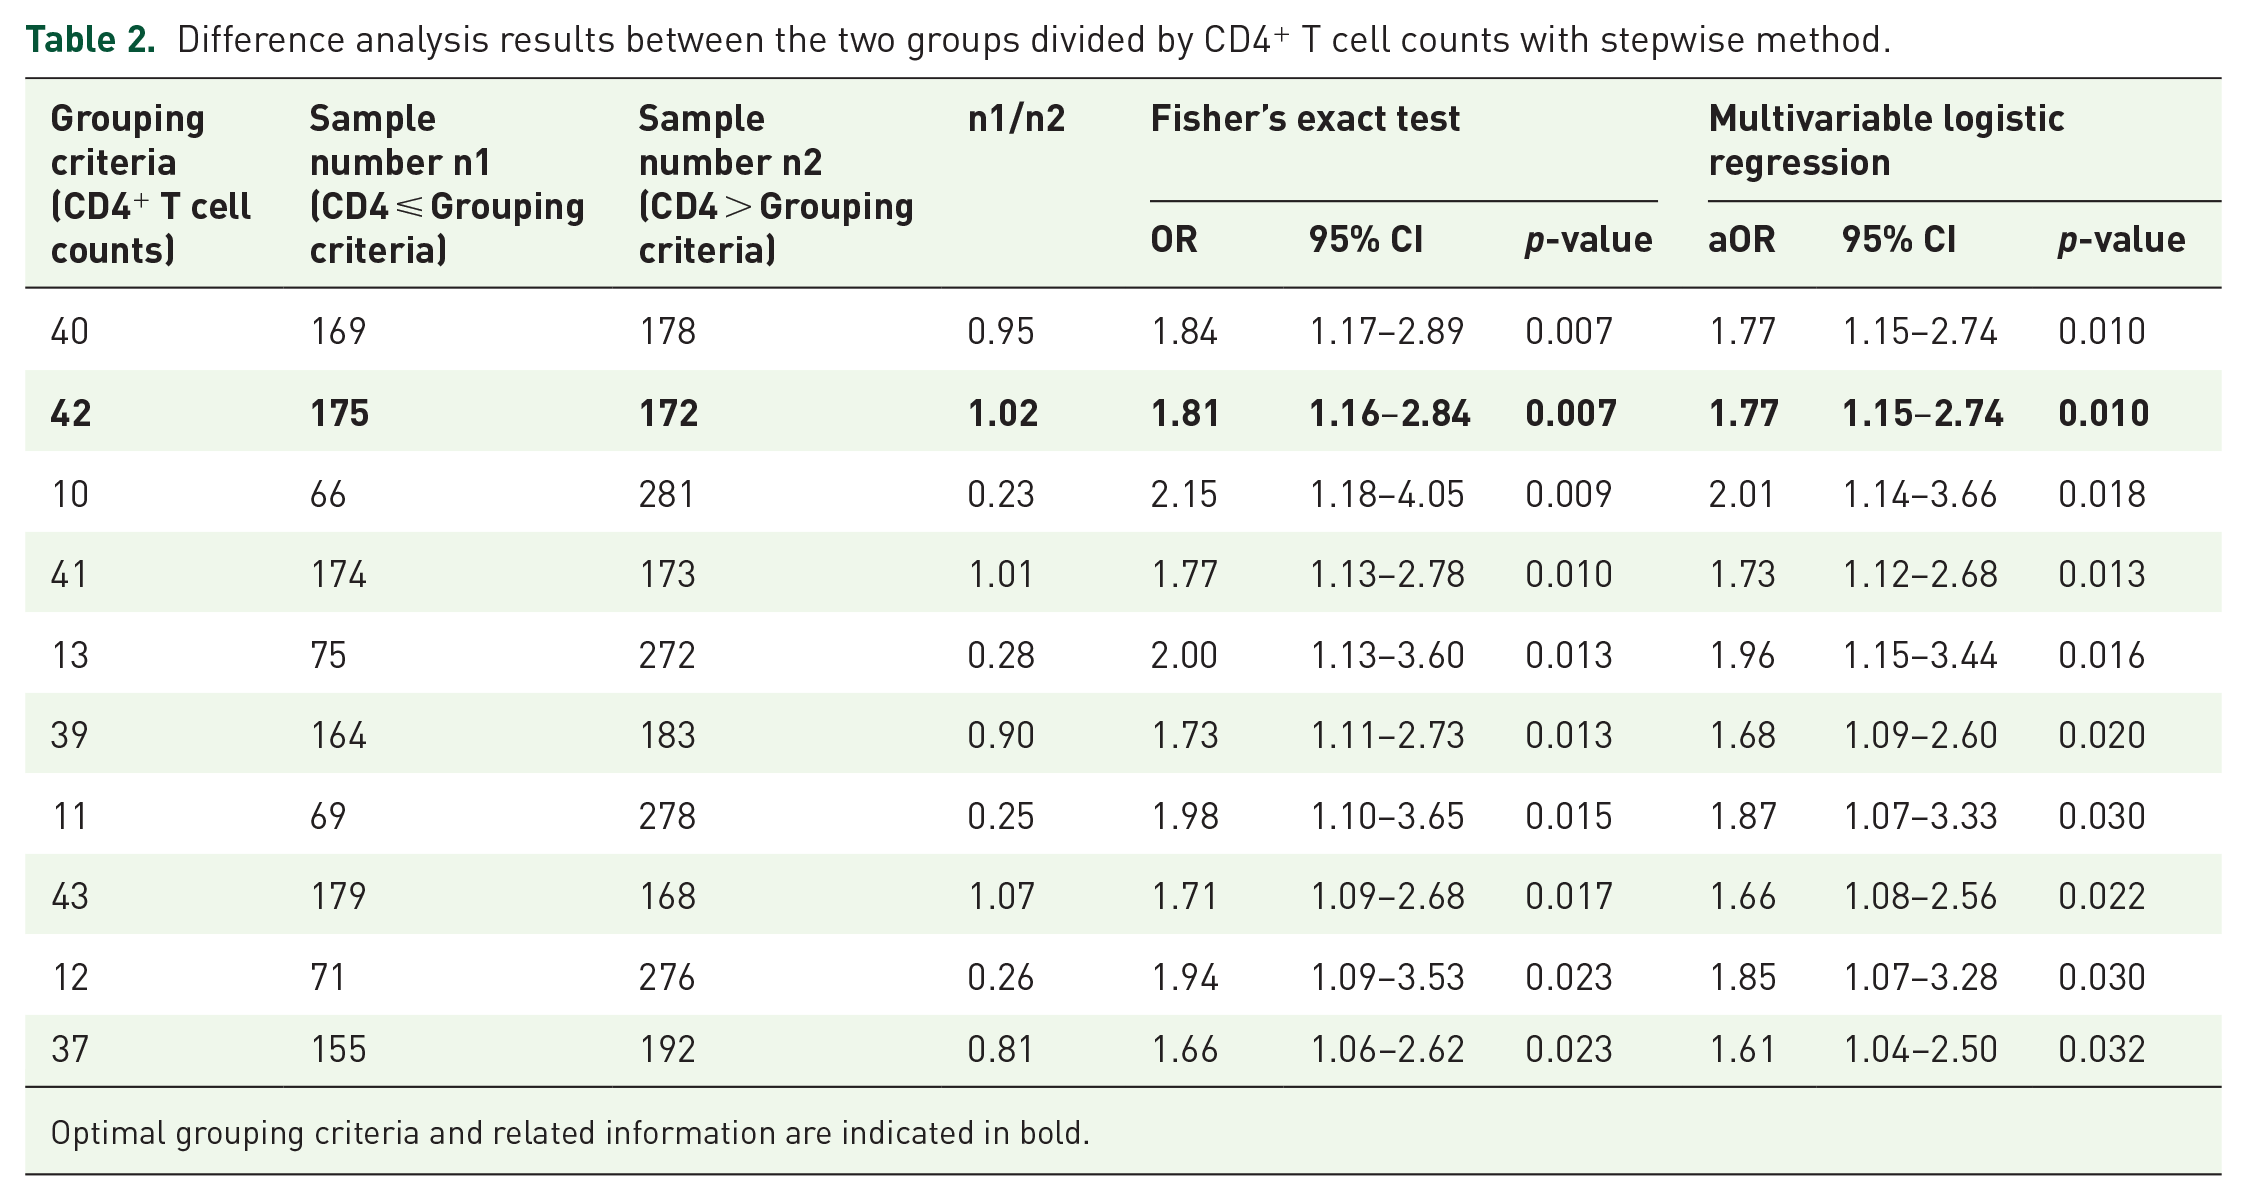
Optimal grouping criteria and related information are indicated in bold.
Effects of drug regimens
In the next step, based on PAC, consensus clustering results showed that three drug groups from the combination of 17 drug compounds were determined to represent the drug regimens in our study (Table 3). We showed the TB treatment effectiveness differences among different treatment groups in the 347 samples based on the three drug regimen groups alone or in combination (Table 4). The class2 group (rifabutin and levofloxacin alone or in combination) showed a significant difference (OR: 0.12, 95% CI: 0.01–0.92, p = 0.037) with the class1/3 group (other first- and second-line anti-TB drugs in combination) in TB treatment effectiveness. The samples with effective treatment in the class2 group accounted for 77.78%, while 27.78% in the class1/3 group. After excluding the two confounding factors, age (OR: 0.00, 95% CI: 0.00–19.50, p = 0.333) and sex (OR: Inf, 95% CI: 0.01-Inf, p = 1.000), the TB treatment effectiveness difference between the two drug groups was still significant (aOR: 0.10, 95% CI: 0.01–0.64, p = 0.022).
Optimal results of consensus clustering of 17 anti-TB drug compounds.

p-values of difference analysis in TB treatment effectiveness between different drug regimens in seven groups.

“/” represents drug combination. For instance, “class1/2” represents class1 and class2 in combination, and all that.
Statistically significant p-values are indicated in bold.
The p-values outside the brackets indicate the results of Fisher’s exact test, while those inside the brackets represent the p-values adjusted for sex and age using multivariable LR.
Interaction effect of CD4+ T cell counts and drug regimens
Furthermore, we separately investigated the treatment effectiveness difference among different drug regimens within CD4+ T cell count ⩽42 group and >42 group (Tables 5 and 6). The class2 group (100% therapeutic effectiveness observed in three samples) showed a significant difference with the class1/2 group (35.2% therapeutic effectiveness observed in 91 samples) in treatment effectiveness (OR: 0.00, 95% CI: 0.00–1.40, p = 0.049) in the group (CD4 ⩽ 42), while no significant difference (OR: 0.78, 95% CI: 0.07–5.94, p = 1.000) in the group (CD4 > 42). The class2 group showed no significant difference with the class1/3 group in treatment effectiveness neither in the group (CD4 ⩽ 42) (OR: 0.00, 95% CI: 0.00–1.88, p = 0.143) nor in the group (CD4 > 42) (OR: 0.24, 95% CI: 0.02–2.52, p = 0.319). No significant differences were found in age and sex between each of the two groups above (Table S1). When CD4 ⩽ 42, due to the sample size limitation, exporting the aOR (class2 and class1/2; class2 and class1/3) leads to overfitting results (Table 5). When CD4 > 42, after excluding age and sex, the TB treatment effectiveness difference between class2 group and class1/2 group was still insignificant (aOR: 0.76, 95% CI: 0.10–4.23, p = 0.759), so did the difference between class2 group and class1/3 group (aOR: 0.17, 95% CI: 0.02–1.29, p = 0.101).
p-values of difference analysis in TB treatment effectiveness between different drug regimens in five groups when CD4 ⩽ 42.

“/” represents drug combination. For instance, “class1/2” represents class1 and class2 in combination, and all that.
Statistically significant p-values are indicated in bold.
The p-values outside the brackets indicate the results of Fisher’s exact test, while those inside the brackets represent the p-values adjusted for sex and age using multivariable LR.
p-values of difference analysis in TB treatment effectiveness between different drug regimens in six groups when CD4 > 42.

“/” represents drug combination. For instance, “class1/2” represents class1 and class2 in combination, and all that.
The p-values outside the brackets indicate the results of Fisher’s exact test, while those inside the brackets represent the p-values adjusted for sex and age using multivariable LR.
Effects of extensive factors on TB treatment effectiveness
Univariate analysis
We conducted a univariate analysis using Fisher’s exact test, showed the pre-treatment clinical indicators or drugs which exhibited significant differences (p < 0.05) between the effective and ineffective treatment groups (Table 7), and presented the corresponding difference analysis results of confounding factors (Table S2). After excluding the age and sex, significant associations were found between TB treatment effectiveness and age (aOR: 2.12, 95% CI: 1.10–4.20, p = 0.027), cycloserine (aOR: 0.21, 95% CI: 0.03–0.77, p = 0.041), rifabutin (aOR: 1.59, 95% CI: 1.09–2.32, p = 0.016), pre-treatment high-density lipoprotein (HDL) cholesterol levels (aOR: 0.47, 95% CI: 0.25–0.89, p = 0.022), pre-treatment CD8+ T cell count (aOR: 0.55, 95% CI: 0.33–0.90, p = 0.019), and pre-treatment neutrophil percentage (aOR: 0.68, 95% CI: 0.48–0.96, p = 0.030). No significant associations were found between TB treatment effectiveness and pre-treatment bicarbonate radical levels (aOR: 1.19, 95% CI: 0.50–2.87, p = 0.696).
Difference analysis results of pre-treatment clinical indicators and drug regimens between the effective and ineffective treatment groups in 547 samples.

The variable “time interval between two Mtb tests” is discretized into a binary variable in the univariate analysis, and the classification standard is based on its average value. Less than or equal to the average value is recorded as 0, and greater than the average value is recorded as 1.
“/” represents ratio. For instance, “1/(0 + 1)” represents the ratio of the number of samples with binary variables of 1 to those with binary variables of 0 and 1.
Multifactor prediction model construction
We attempted to use factors from univariate analysis as independent variables to construct a TB treatment effectiveness prediction model, but it was not well-evaluated because of the small sample size. To ensure the capacity of the model, we constructed two multifactor models using factors that showed little consistency with univariate analysis results to predict patients’ TB treatment effectiveness.
Prediction model I
For the 547 samples, we excluded variables that contained only one category or a total number of classes (or non-zero recorded values) of less than five. We obtained 347 samples containing demographic information, time interval for TB detection, duration of medication, CD4+ T cell count, CD8+ T cell count and CD4+/CD8+ ratio, resulting in a total of 18 variables (Figure 2) without missing values for prediction model I construction. Under five-fold cross-validation, we selected the train set samples corresponding to the test set with the highest prediction accuracy to construct therapy-effective LR prediction model I, SVM-prediction model I, and RF-prediction model I. We drew the ROC curves of the train and test sets. The ROC curve of the train set showed serious overfittings in RF modeling. The best AUC values of the test sets under the three algorithms were SVM (0.763), LR (0.659), and RF (0.653) from high to low (Figure 5(a)). We showed the coefficient parameters of the LR prediction model I constructed by stepwise regression (Table S3) and the importance ranking of the variables in the RF prediction model I (Figure S1A). The “age” and “CD8+ T cell count” (two positive correlations) significant contributed to prediction in the LR model. The top two important variables were “cycloserine” and “age” in the RF model.

The ROC curve and AUC of the prediction model I & II based on LR/SVM/RF.
Prediction model II
For the 547 samples, we selected 169 variables with more than 500 records and excluded variables that contained only one category or the total number of a category under five. We obtained 527 samples containing 32 (Figure 2) variables without missing values for prediction model II construction. Under five-fold cross-validation, we selected the corresponding train set samples with the highest prediction accuracy of the test set to construct the therapy-effectiveness LR prediction model II, SVM prediction model II, and RF prediction model II. We drew the ROC curves of the train and test sets. The ROC curve of the train set showed serious overfittings in RF modeling. The best AUC values of the test sets under the three algorithms were SVM (0.686), RF (0.650), and LR (0.560) from high to low (Figure 5(b)). We showed the coefficient parameters of the LR prediction model II constructed by stepwise regression (Table S4) and the importance ranking of the variables in the RF prediction model I (Figure S1B). The “time interval for TB detection,” “rifabutin,” “sodium aminosalicylate” (three positive correlations) and “cycloserine,” “neutrophil percentage” (two negative correlations) significant contributed to prediction in the LR model. The top two important variables were “cycloserine,” and “sodium para-aminosalicylate” in the RF model.
We showed the performance evaluation results of the two prediction models using the three machine learning algorithms (Table 8). We drew the boxplot for the accuracy of test set result of prediction models I and II, which were built using the three algorithms (Figure 6). From the results, we noticed the same algorithm showed no significant difference in accuracy between the two prediction models. However, when comparing different algorithms, we observed that the accuracy of the prediction model built using LR was significantly higher than using SVM. Then, we re-constructed the univariate model based on the LR algorithm, which had the highest accuracy and reliability, using the variables which showed significant contribution in the prediction model I and model II (“age” and “CD8+ T cell count” for model I; “time interval for TB detection,” “rifabutin,” “sodium aminosalicylate,” “cycloserine,” and “neutrophil percentage” for model II). The modeling evaluation results indicated that all the univariate models did not lead to improvements in model performance compared with the multivariable LR models I/II (Table S5).
Results of evaluation indexes of prediction model I/II based on three machine learning algorithms.

The results of mean ± standard deviation are reported by randomly splitting the train and test sets for five times.
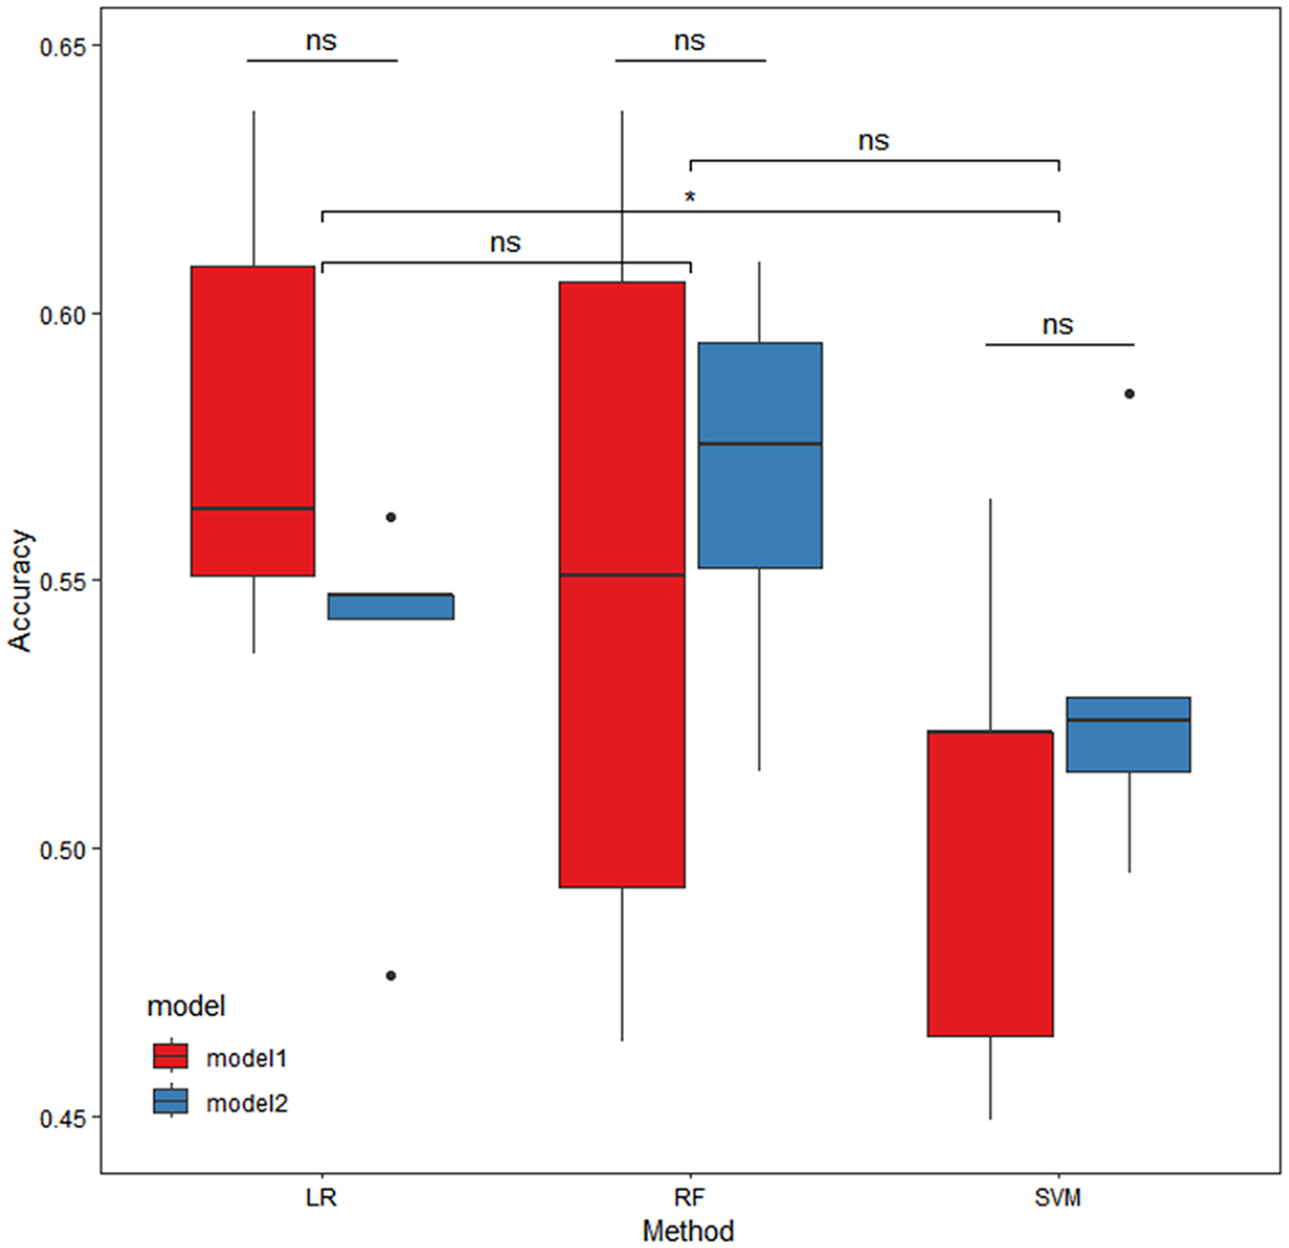
Box plots of accuracy comparison of the test set of prediction model I/II based on three machine learning algorithms (five-fold cross-validation).
Association of abnormal clinical indicator recovery rate with TB treatment effectiveness
We explored the difference in abnormal clinical indicator recovery rate between the effective and ineffective treatment groups using Fisher’s exact test and showed the results of the top five clinical indicators (ordered by p-values of Fisher’s exact test) (Table 9). The samples with the “lymphocyte percentage” indicator recovered accounted for 43.55% in the effective treatment group, which significantly decreased to 30.08% in the ineffective treatment group (OR: 0.56, 95% CI: 0.32–0.96, p = 0.028). After excluding the two confounding factors, age (OR: 0.29, 95% CI: 0.08–0.86, p = 0.018) and sex (OR: 0.60, 95% CI: 0.20–1.66, p = 0.353), the association of “lymphocyte percentage” recovery rate with TB treatment effectiveness is still significant (aOR: 1.83, 95% CI: 1.09–3.10, p = 0.022). When considering the patients’ age under 60 and excluding the cofounding factor sex, the samples with “lymphocyte percentage” recovered accounted for 45.87% in the effective treatment group, which significantly decreased to 28.91% in the ineffective treatment group (aOR: 2.08, 95% CI: 1.22–3.58, p = 0.007). No significant difference existed in samples aged 60 years and older (aOR: 0.25, 95% CI: 0.02–2.07, p = 0.203).
Difference analysis results of clinical indicators from abnormal to normal between the effective and ineffective TB treatment groups.

Statistically significant p-values are indicated in bold.
Discussion
HIV patients have a high probability of developing TB, and co-infection accelerates disease progression and increases the mortality rate. Effective prevention and treatment of HIV/TB-related complications are urgently needed. Currently, there is a lack of innovative and high-quality retrospective studies on factors influencing the TB treatment effectiveness in HIV/TB co-infected patients. Due to this gap, our study collected comprehensive clinical records of HIV/TB co-infected patients from the Shanghai Public Health Clinical Center system, spanning from 2010 to 2020. We developed a new strategy to screen valid samples, which differed from other studies in terms of sample definition and disease course segmentation. Then, through comprehensive statistical tests among multiple comparison groups and model construction, we analyzed various drug regimens, clinical indicators, and their combinations, which were significantly associated with TB treatment effectiveness in HIV/TB co-infected patients.
At first, we explored the influence of immune levels and drug regimens on TB treatment effectiveness. For the CD4+ T cell count, which measures an individual’s immune level, 33 we demonstrated that TB treatment effectiveness is limited when the CD4+ T cell count is below 42. When assessing the effect of drug regimens, we showed that the class2 drug group had a better effect on TB treatment compared to the class1/3 combined group. This aligns with previous studies, which illustrated that rifabutin and levofloxacin in class2 are more effective than other first- and second-line anti-TB drugs in class1/3.34–36 It may also be that the class1/3 group had more extensive drug resistance, making treatment more difficult. The comprehensive influence of immune levels and drug regimens showed less reliable results due to the limitations of sample size and balance, which require more evidence in future studies.
Next, we explored the contribution of clinical indicators to the TB treatment effectiveness. Univariate analysis results showed significant differences in age, pre-treatment factors (HDL cholesterol, CD8+ T cell count, and neutrophil percentage), rifabutin, and cycloserine between the effective and ineffective treatment groups. Multifactor modeling results showed that the important variables contributing significantly to the model prediction were partially consistent with the results of the univariate analysis. The index results of the model performance evaluation showed that the best AUC of the two models under the three methods was less than 0.7. In other words, the prediction effect was average. It is worth noting that the accuracy of the prediction model built using LR was significantly higher than that of the model built using SVM for both models I and II, while the RF model exhibited serious overfitting. Therefore, LR is the best choice for creating the prediction model for this dataset. Furthermore, we separately modeled using the independent variables with significant contributions to prediction in multivariable LR models I and II to investigate the predictive ability of these significant factors. The results showed that predictive performance did not improve significantly, indicating that the relationship between these important features and treatment effectiveness is not easily explained by the current models and requires further research and validation. The results of the optimal model evaluation in this study were still unsatisfactory, highlighting some important issues. The goal of obtaining an effective prediction model for TB treatment that is applicable across a wide range of treatment segments, without considering the disease course, was not sufficiently reasonable. In addition, the three machine learning algorithms, including LR with the best modeling performance, may be too rigid to fully interpret the relationship between clinical indicators, drug regimens and TB treatment effectiveness.
Finally, we analyzed the differences in abnormal clinical indicator recovery rates between the TB treatment-effective group and the ineffective group. The univariate analysis results showed that the lymphocyte percentage in the TB treatment-effective group was significantly higher than in the treatment-ineffective group, particularly in samples under 60 years of age. In comparison, there were no significant differences in samples over 60 years, which indicated that age could be a strong influencing factor for lymphocytes percentage recovery. We demonstrated that lymphocyte percentage could be a potential therapeutic and diagnostic target for TB in HIV/TB co-infected patients.
The innovation of this retrospective study lies in defining the interval between every two Mtb test time points for patients as one sample. A sample with positive test results at the previous time point and negative test results at the later time point was defined as an effective treatment (denoted as 1). Samples with positive test results at both time points were defined as ineffective treatments (denoted as 0). The factors affecting treatment effectiveness were then explored over a shorter period based on real data. This approach differs from the vast majority of studies that treat a patient as a sample, define disease cure criteria based on one or several standard courses of treatment, and explore trial designs that affect treatment effectiveness, uncovering valuable information that may have been overlooked. Additionally, the grouping criteria for therapeutic drugs were based on this clinical dataset, using the duration of use of each drug and a consistent clustering method to identify the combinations of drugs prescribed by doctors in real-world conditions, offering rare realism.
However, several areas of improvement in this study need to be addressed. First, due to the limitations of the data source and the retrospective study design, the sample size was determined through screening without using a formula for calculations. Consequently, the research findings require further verification through more extensive testing. Second, dividing drug intervals to define samples ignores the differences in the effect of the same treatment regimen at different stages of disease progression, which is likely to introduce bias in the study conclusions. Furthermore, further time-series analysis would be complex and of low feasibility. Third, several essential data inclusion criteria require more robust literature or clinical support, such as the minimum duration of drug use for sample inclusion (defined as 7 days according to doctor’s instructions) and TB test criteria (according to doctor’s instructions, one of the Mtb test results from any sample type and test type must be positive, not limited to sputum specimens). This deficiency results in a weak foundation for the experimental design. Fourth, due to the lack of complete viral load data, it was difficult to accurately measure the HIV progression in the patients and samples included in this study. Only CD4+ T cell counts could be used to assess and stratify the patient’s immune system status (or ART treatment level), thus reducing the richness and reliability of the research conclusions. Fifth, the lack of complete drug resistance data hinders further research on drug recommendations for precision therapies. Sixth, when including the clinical data in this study, the ART treatment data only included inpatient data, and most outpatient data were missing. Unfortunately, a survey of complementary treatments for ART and TB treatment could not be conducted. Finally, the interpretability of routine clinical test indicators regarding their effect on drug effectiveness requires further mechanistic exploration, proof, and clinical confirmation. The focus of extensive medical data research in the real world is how to use data with uneven structures to draw conclusions with as much reference value as possible. In future work, with regard to the treatment of HIV and its complication TB, prospective experiments can be designed, continuous, complete, and quantitative HIV/TB inpatient and outpatient medication data can be collected and recorded, and interactive analysis between ART therapy and TB therapy can be conducted. This will lay a theoretical foundation for the development and application of personalized treatments in the era of precision medicine.
Conclusion
TB is the most common cause of HIV-related deaths worldwide. Evidence from real-world studies on TB treatment for HIV/TB co-infected patients is insufficient. This retrospective study comes to several critical conclusions. First, CD4+ T cell count of 42 cells per μL can serve as an essential and sensitive classification criterion for the immune level to assist in evaluating or predicting the effectiveness of TB treatment in comorbidities. Second, rifabutin and levofloxacin alone or in combination are more effective than other first- or second-line anti-TB agents. Third, age, pre-treatment factors (HDL cholesterol, CD8+ T cell count, and neutrophil percentage), rifabutin, and cycloserine can influence the effectiveness of TB treatment. Fourth, more evidence is needed to support the relationship between pre-treatment clinical indicators, drug regimens, and TB treatment effectiveness. Fifth, the lymphocyte percentage can be used as a promising therapeutic and diagnostic target in HIV/TB patients. These perspectives can help supplement the knowledge gaps in relevant clinical aspects and increase the amount of relevant research evidence.
Supplemental Material
sj-docx-1-tai-10.1177_20499361241308641 – Supplemental material for Treatment response of patients with tuberculosis and HIV co-infection: a retrospective analysis of secondary data from Shanghai, China, 2010–2020
Supplemental material, sj-docx-1-tai-10.1177_20499361241308641 for Treatment response of patients with tuberculosis and HIV co-infection: a retrospective analysis of secondary data from Shanghai, China, 2010–2020 by Chenyu Dong, Renfang Zhang, Shenyang Li, Jun Chen, Yunhe Liu, Xiaoqiong Xia, Gang Liu, Yinzhong Shen, Lei Liu and Liyan Zeng in Therapeutic Advances in Infectious Disease
Supplemental Material
sj-docx-2-tai-10.1177_20499361241308641 – Supplemental material for Treatment response of patients with tuberculosis and HIV co-infection: a retrospective analysis of secondary data from Shanghai, China, 2010–2020
Supplemental material, sj-docx-2-tai-10.1177_20499361241308641 for Treatment response of patients with tuberculosis and HIV co-infection: a retrospective analysis of secondary data from Shanghai, China, 2010–2020 by Chenyu Dong, Renfang Zhang, Shenyang Li, Jun Chen, Yunhe Liu, Xiaoqiong Xia, Gang Liu, Yinzhong Shen, Lei Liu and Liyan Zeng in Therapeutic Advances in Infectious Disease
Footnotes
Acknowledgements
We acknowledge the support provided by everyone who contributed to this article. We also acknowledge the support of the Medical Science Data Center in Shanghai Medical College of Fudan University for providing the analysis platform.
Declarations
Supplemental material
Supplemental material for this article is available online.
References
Supplementary Material
Please find the following supplemental material available below.
For Open Access articles published under a Creative Commons License, all supplemental material carries the same license as the article it is associated with.
For non-Open Access articles published, all supplemental material carries a non-exclusive license, and permission requests for re-use of supplemental material or any part of supplemental material shall be sent directly to the copyright owner as specified in the copyright notice associated with the article.