
Abstract
The availability of whole-genome sequencing (WGS) as a tool for the diagnosis and clinical management of tuberculosis (TB) offers considerable promise in the fight against this stubborn epidemic. However, like other new technologies, the best application of WGS remains to be determined, for both conceptual and technical reasons. In this review, we consider the potential value of WGS in the clinical laboratory for the detection of Mycobacterium tuberculosis and the prediction of antibiotic resistance. We also discuss issues pertaining to data generation, interpretation and dissemination, given that WGS has to date been generally performed in research labs where results are not necessarily packaged in a clinician-friendly format. Although WGS is far more accessible now than it was in the past, the transition from a research tool to study TB into a clinical test to manage this disease may require further fine-tuning. Improvements will likely come through iterative efforts that involve both the laboratories ready to move TB into the genomic era and the front-line clinical/public health staff who will be interpreting the results to inform management decisions.
Introduction
Owing to advances in technology and reductions in cost, whole-genome sequencing (WGS) has been transformed from a centralized service used by a select few to interrogate single genomes into a relatively decentralized lab technique used by many to detect and track infectious pathogens [Long et al. 2014; Price et al. 2014; SenGupta et al. 2014; Snitkin et al. 2012; Quick et al. 2014, 2015]. This transformation has not spared the mycobacterial genus, with a number of papers presenting its application to the characterization of Mycobacterium tuberculosis cases and outbreaks [Walker et al. 2013; Bryant et al. 2013; Gardy et al. 2011; Lee et al. 2015; Casali et al. 2014; Jamieson et al. 2014b; Stucki et al. 2015; Roetzer et al. 2013; Guerra-Assuncao et al. 2015]. In this review, we will consider the opportunities presented by WGS for clinical management of tuberculosis (TB) across two conceptual spaces: diagnosis (M. tuberculosis detection) and treatment (prediction of antibiotic resistance). We recognize that the greatest utility for WGS will likely lie in countries with the highest TB burdens; however, as WGS requires substantial financial and technical infrastructure, we have situated this review in the setting of a high-resource country where this method may be more imminently implemented.
A brief description of WGS
WGS begins at the bench, with the extraction and purification of genomic DNA. In very brief detail, this DNA is typically fragmented into shorter pieces, which are then sequenced in ‘reads’ of 100–500 base pairs (bps) for bench-top sequencers. There are a number of different sequencing platforms available [Loman et al. 2012a; Kwong et al. 2015; Heather and Chan, 2015]. The choice of platform depends largely on the question, which in turn is dictated by clinical needs. If the aim is to identify unknown organisms or to characterize a novel bacterium, one might prefer a sequencer that generates longer reads (such as the PacBio RS by Pacific Biosciences, Menlo Park, CA, USA), as such reads enable more accurate de novo assembly [Loman et al. 2012a]. If the goal is to speciate the microorganism, determine drug resistance or resolve transmission networks, sequencers producing short reads can be used. Among the benchtop sequencers generating short read data, the most accurate platform currently available is the Illumina MiSeq (Illumina, San Diego, CA, USA) [Loman et al. 2012b] (though whether the difference in accuracy compared with another platform, the Ion Torrent PGM from ThermoFisher Scientific, Waltham, MA, USA, ultimately affects clinical inferences has been questioned [Harris et al. 2013]). In the analysis of such short read data, a reference-based approach is preferred [Loman et al. 2012a], wherein these reads are aligned (‘mapped’) to a reference genome. This is ideal for analysis of M. tuberculosis, given the absence of horizontal gene transfer in this species and the existence of complete, well-annotated reference genomes. Such a workflow for M. tuberculosis is illustrated in Figure 1.
WGS workflow for Mycobacterium tuberculosis. In brief, whole-genome sequencing (WGS) begins in the wet lab (top panel), wherein genomic DNA (gDNA) is extracted. For a M. tuberculosis culture, this is done in a biosafety level 3 laboratory. After DNA extraction, library preparation is conducted, wherein genomic DNA is fragmented into pieces. Uneven ends of gDNA are blunted and adaptor sequences are added. After passing quality control, libraries are advanced to sequencing. Further analysis occurs in the dry lab (bottom panel). Potential contamination is assessed and the quality of sequencing is evaluated on a per isolate basis, including the examination of Phred quality scores of the sequenced bases (where Phred = –10*logPerror). FastQC, for example, is a software that can be used for such quality control, and is applied directly on raw sequence data (available from http://www.bioinformatics.bbsrc.ac.uk/projects/fastqc/, shown in the screenshot). Adaptors (and potentially low-quality base pairs) are trimmed and reads of length under a prespecified limit (e.g. 70 base pairs used by the 1000 Genomes Project) may be excluded (not shown). High-quality reads are aligned to a reference genome (this can be visualized in Integrative Genomics Viewer, also shown in screenshot [Thorvaldsdottir et al. 2013]), and metrics such as genome coverage (the percentage of the reference genome that has at least one read mapped to it) and depth of coverage (the average number of reads mapped to each locus) are evaluated. Isolates are retained if a priori quality measures are met. Reads are excluded if they map to more than one locus in the genome, and additional quality measures may be applied such as removing polymerase chain reaction duplicates and local realignment around indels. Once quality control steps are conducted, single-nucleotide polymorphisms and indels can then be ‘called’ compared with the reference genome. Low-quality variants are then removed using various filtering parameters to reduce the number of false positives. Genes are then annotated and repetitive regions and mobile elements may be filtered out of further analyses.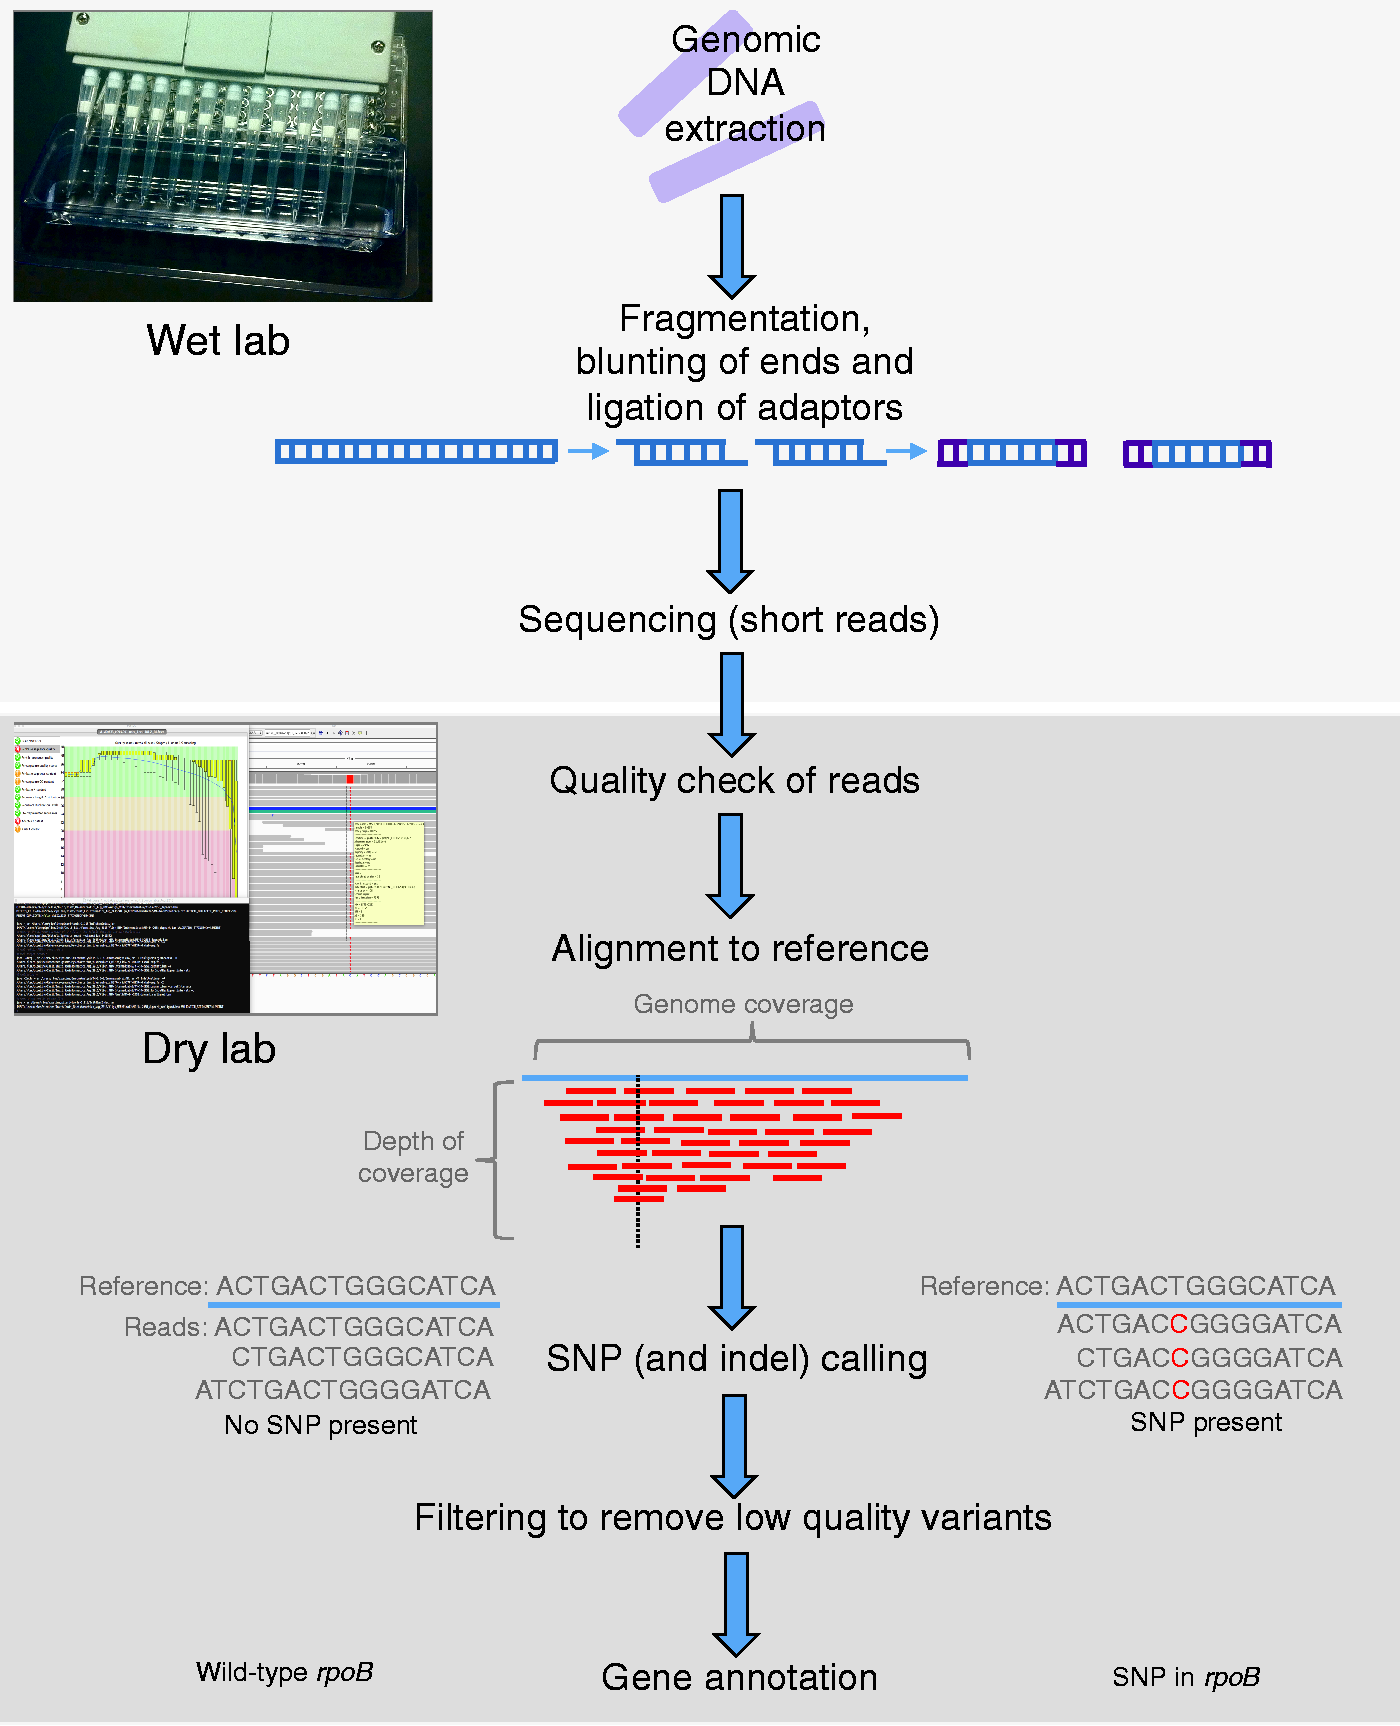
With the Illumina MiSeq platform, short reads of up to 300 bps in length are produced. To identify the microorganism in question based on these reads, a variety of tools can be utilized. The Basic Local Alignment Search Tool (BLAST [Altschul et al. 1990]) compares reads with existing microbial DNA databases and uses an algorithm to identify the most likely microorganism. Other methods include classifying the microorganism based on how well reads align to conserved coding sequences within phyla or species (‘clade-specific marker sequences’ [Segata et al. 2012]) or k-mer-based approaches [Wood and Salzberg, 2014]. In the latter, reads are divided into segments of k bases in length (called ‘k-mers’) that are compared with a database of known k-mer sequences from selected microorganisms. The best identification is determined as the microorganism with the highest proportion of matching k-mers.
Once reads have been assigned the identity ‘M. tuberculosis’, they are subsequently mapped to the corresponding sequence on the reference genome to identify differences (i.e. variants) in the sample compared with this reference. There are several key considerations when performing such reference-based analyses. First, the choice of an appropriate reference genome is crucial; if the reference is too dissimilar from the isolate in question, large numbers of reads will not be mapped and these data (and all variation therein) will be ignored. Second, alignment to GC-rich repetitive regions can be difficult, as reads may map to more than one location, thereby producing inconclusive matches. Such regions include the PE-PPE family proteins, which comprise ∼10% of the coding sequence of M. tuberculosis [Cole et al. 1998]. To reduce the risk of false-positive results, the PE-PPE regions and mobile elements are typically excluded from analyses [Comas et al. 2010; Roetzer et al. 2013]. Alternatively, one could perform targeted sequencing using a platform capable of generating longer reads that span repetitive regions. However, this would incur additional expense, as well as technical/bioinformatics requirements, and may not provide additional information of use for clinical applications.
Using a reference-based approach, single nucleotide polymorphisms (SNPs; i.e. a difference in a single base in the genome compared to the reference) and insertions/deletions (indels) present in the test isolate can be identified (‘called’) compared with the referent. This process, the quality control steps therein and the different tools used for identifying SNPs are reviewed in detail elsewhere in [Pabinger et al. 2014; Olson et al. 2015]. For the purposes of this work, we have focused on the utility of WGS for the clinician and, in particular, the use of these SNPs to predict drug resistance. In M. tuberculosis research, SNPs have also been used to extensively to delineate transmission networks, however, an in-depth discussion of this utility is beyond the scope of this review. The interested reader is directed to the several examples in the literature of its use in TB outbreak investigations [Gardy et al. 2011; Stucki et al. 2015; Lee et al. 2015; Torok et al. 2013; Kato-Maeda et al. 2013; Schurch et al. 2010; Ocheretina et al. 2015; Walker et al. 2013; Roetzer et al. 2013]. It is worth noting at this point that genotyping is occasionally required for clinical care, for instance, to rule out laboratory cross-contamination as a false-positive cause of a positive culture, or when trying to determine when a TB recurrence is due to relapse of the original infection versus exogenous reinfection. For both of these applications, the lessons of outbreak investigation indicate that WGS has higher resolution than traditional typing methods, such as spoligotyping, mycobacterial interspersed repetitive units (MIRUs), or restriction fragment length polymorphism (RFLP) [Gardy et al. 2011; Lee et al. 2015; Walker et al. 2013; Roetzer et al. 2013]. Therefore, it can be inferred that, for both situations, if the traditional method returns a result of ‘different strain’, WGS is not necessary to answer the clinical question. If, however, the traditional typing method returns a matched pattern, WGS may be required to confidently distinguish a related strain due to ancestry from a true match, with the latter being observed during laboratory cross-contamination or relapse.
Regardless of the application, the quality of WGS data depends on a number of factors, including the desired length of the sequencing reads and the cycle time [Quick et al. 2015]. These parameters in turn affect the turnaround time for results. Considering the most frequently used bench-top sequencers, raw sequencing results can be available in a clinically attractive span of just a few hours (for the Ion Torrent PGM) to as much as 39 hours with MiSeq for paired end 250 bp reads. By adjusting the sequencing protocol for MiSeq, it may be feasible to reduce this time frame without affecting key inferences, such as species and strain assignments [Quick et al. 2015]. An important consideration when making such adjustments is the ‘depth of coverage’; the more reads that span a position in the reference genome, the more support there is for the base identified. The optimal depth of coverage to detect clinically relevant variants needs to be determined.
Another factor influencing the time to obtain these data is whether samples are batched or run independently. According to Quick and colleagues [Quick et al. 2015], the MiSeq can sequence up to ∼100 isolates simultaneously. In our experience, the MiSeq 250-bp paired-end sequencing can generate a minimum of 10 million reads; if 20× coverage is desired, only ∼57 isolates of M. tuberculosis can be run simultaneously [Lander and Waterman, 1988]. A batched approach such as this is typical in research labs and is clearly less expensive on a per-unit basis, as running a single isolate would cost the same as the whole collection of samples. Unfortunately, waiting until a queue of specimens has accumulated is not ideal for clinical labs, which need to process samples immediately on arrival and send reports 24 hours a day. A newer method, the Nanopore MinIon (Oxford Nanopore Technologies, Oxford, UK), offers much promise in addressing this problem. The MinIon runs a single sample at a time and was able to correctly speciate two Salmonella enterica isolates as well as place them in epidemiologic context within 2 h [Quick et al. 2015]. Earlier diagnosis and detection of SNPs connoting drug resistance could allow for more rapid initiation of treatment, compared with waiting for results from a batched analysis. However, the advantage of rapid results offered by the MinIon is currently offset by high error rates as reported by [Laver et al. 2015; Mikheyev and Tin, 2014; Quick et al. 2015]. While sequencing chemistry is improving and bioinformatics approaches are being developed to increase accuracy [Jain et al. 2015], further studies are needed to evaluate this method. As of yet, the MinIon has not been utilized for M. tuberculosis. It might be that these different platforms offer complementary opportunities for the clinical lab, for instance by using the Nanopore technology to rapidly speciate pathogenic organisms and the MiSeq for ongoing epidemiologic surveillance.
WGS for detection of M. tuberculosis, including the prediction of drug resistance
In the clinical mycobacteriology lab, the goal is to secure a diagnosis of active TB and to provide clinicians with guidance on which antibiotics they should or should not prescribe for their patients. These two goals have classically been achieved with phenotypic tests, some dating to the 19th century. This begs the obvious question of whether WGS can help modernize the TB lab, with the goal of offering faster and more accurate results.
The current clinical workflow for detection of M. tuberculosis in Canada is illustrated in Figure 2. Variations of this pathway may be seen in comparable high-resource countries. For more detailed reviews of M. tuberculosis laboratory diagnosis, the reader is referred to the literature [Parrish and Carroll, 2008, 2011; Drobniewski et al. 2013; Noor et al. 2015]. In brief, specimens from TB suspects are sent for smear microscopy to ascertain the presence of acid-fast bacilli. This test identifies the most infectious patients (i.e. with ‘smear-positive’ disease) [Behr et al. 1999]. Results of smear microscopy should be available within 24 h of receipt [Parrish and Carroll, 2011], however this method has low sensitivity [Steingart et al. 2006a, 2006b] and cannot distinguish M. tuberculosis from non-TB mycobacterium. Regardless of the results of microscopic examination, the same specimens are processed for culture, as detailed by Parrish and Carroll [Parrish and Carroll, 2011]. The culture is usually done using both solid and liquid media (typically mycobacterial growth indicator tubes [MGITs]), with growth usually observed in 1–3 weeks, depending on the mycobacterial inoculum in the sample [Chihota et al. 2010; Fadzilah et al. 2009]. Once growth is observed (on solid media) or flagged by the machine (in the case of MGITs), a positive culture can be assigned a presumptive identification as M. tuberculosis complex using a DNA probe, usually within 24 h [Ichiyama et al. 1997]. Cultures are then sent to a reference laboratory for formal species confirmation and for drug susceptibility testing (DST) by phenotypic (i.e. growth-based) assays.
Clinical diagnostic workflow for Mycobacterium tuberculosis. The three main steps in the current diagnostic workflow for M. tuberculosis are shown. As described in the text, whole-genome sequencing may have a potential role at each of these steps: (1) by being applied directly to the unprocessed clinical specimen or (2) by being conducted on the positive culture to predict drug resistance.
Superimposed on this classic workflow (smear microscopy, culture, then DST), laboratories have overlaid molecular testing over the past two decades, using a variety of different platforms and clinical strategies. The first molecular tests approved were only licensed for the speciation of smear microscopy-positive samples [Parrish and Carroll, 2011], so their key role was in assigning a microbial name to such a sputum sample [Vuorinen et al. 1995; Carpentier et al. 1995]. Then, with time and experience, it became recognized that nucleic acid amplification testing could be offered on smear-negative samples where there was a high clinical suspicion of TB [Centers for Disease Control and Prevention (CDC) 2009]. To reduce costs of controls, these ‘rapid’ first generation tests were generally batched and as a result, might only have been done twice or three times per week, depending on laboratory volume. More recently, the GeneXpert (Cepheid Inc., Sunnydale, CA, USA) has offered a random-access real-time nucleic acid amplification test, which can be done on a single sample, without having to wait for samples from other patients. GeneXpert is conducted directly on the clinical specimen to detect both the presence of M. tuberculosis DNA and mutations in the rpoB gene that predict resistance to the first-line drug, rifampin. In principle, results can be available in under 2 h [Boehme et al. 2010]. In practice, turn-around time depends on logistics; most testing is done in laboratories rather than clinics, necessitating delays due to shipping and handling [Alvarez et al. 2015]. The specificity of GeneXpert for M. tuberculosis detection is high, reported at >98%, but the sensitivity varies by smear status [Boehme et al. 2010; Steingart et al. 2014; Sohn et al. 2014], site (e.g. respiratory versus extrapulmonary) and type of sample (e.g. lymph node versus pleural [Maynard-Smith et al. 2014; Denkinger et al. 2014]). While GeneXpert is currently the fastest and arguably most useful diagnostic test in many parts of the world, it may be that its enduring legacy is catalyzing a paradigm shift away from phenotypic testing, towards genetic detection of M. tuberculosis as the primary goal of the TB lab. If true, then the same pre-analytic principles (collecting sputum, delivering to lab, rendering the sample safe, extracting DNA) can serve as the basis for a more comprehensive interrogation of the mycobacterial genome, going beyond the rpoB gene to characterize the complete genome of the causative organism.
WGS for diagnosis
Until recently, the utility of WGS for de novo diagnosis of M. tuberculosis was unclear. WGS had relied exclusively on enriched DNA obtained from a pure bacterial culture, at which point the patient would have already been diagnosed. More recently, studies have examined the feasibility of sequencing M. tuberculosis directly from the clinical specimen [Doughty et al. 2014; Brown et al. 2015]. Sequencing eight smear positive samples, Doughty and colleagues obtained only 0.002× to 0.7× depth of coverage, with 20–99% of reads sequenced mapping to the human genome rather than M. tuberculosis [Doughty et al. 2014]. Brown and colleagues obtained similar results when sequencing directly from clinical samples, but when an oligonucleotide enrichment protocol was applied, they were able to obtain at least 20× depth of coverage on 20/24 smear positive, culture positive isolates, providing sufficient sequence depth to confidently speciate the organism present [Brown et al. 2015].
If WGS is to be applied on the patient sample, the conceptual advantage is a more rapid result. However, the vast majority of samples are negative for M. tuberculosis, even in a high-incidence setting [Demers et al. 2012], so some form of triage is needed to select the samples most likely to benefit from direct WGS. Furthermore, sputum is contaminated with host and other bacterial DNA, complicating bioinformatic analyses and reducing the overall depth of coverage obtained for the M. tuberculosis genome [Doughty et al. 2014]. While low coverage may not preclude the ability to confidently detect M. tuberculosis, it could seriously undermine the capacity to detect mutations associated with drug resistance (as shown by Doughty and colleagues [Doughty et al. 2014]), where the greatest clinical value of WGS may lie. In sum, these studies provide proof-of-principle that WGS of M. tuberculosis directly from clinical specimens is feasible, but the cost of the enrichment protocol (USD$350 per sample), the requirement for technical expertise and equipment, and the need for real-time bioinformatics to convert sequence files into clinically meaningful lab reports all present challenges to WGS supplanting smear microscopy and nucleic acid amplification as the primary test performed on clinical specimens.
If instead WGS is applied on the positive culture, then the benefit of rapidity has been lost, as the patient should already be isolated and started on treatment, based on either smear microscopy, a nucleic acid amplification test or the Accuprobe result on the culture. In this case, WGS may offer a different opportunity, which is a more rapid identification of antibiotic resistance.
WGS for resistance
Examples of molecular diagnostics for drug resistance in M. tuberculosis.

For meta-analyses: if available, ranges are shown in addition to pooled estimates, to indicate potential heterogeneity. All tests shown, with exception of GeneXpert, are line probe assays. Where no sensitivity is reported, no isolates were identified with resistance to the target drug. *Includes studies using MTBDR (first-generation). **Results not shown for second-line drugs, as only testing was only conducted on the 3 samples with resistance to first-line drugs. AID predicted 3/3 isolates to be susceptible to second-line, confirmed with phenotypic DST. ***Study did not report separate test results for positive RIF and INH resistance.
CI, confidence interval; CrI, credible interval; INH, isoniazid; RIF, rifampin.
As most rifampin-resistant isolates are also isoniazid-resistant, the GeneXpert uses rpoB mutations associated with rifampin-resistance as a proxy for multi-drug resistance. However, not all rifampin-resistant organisms are isoniazid-resistant (i.e. there can be rifampin mono-resistance) and indeed, not all isolates predicted to be rifampin-resistant are confirmed on phenotype-based testing [Steingart et al. 2014]. In addition, not all rifampin-resistant isolates are detected based on the currently assessed mutations [Sanchez-Padilla et al. 2015; Jamieson et al. 2014a]. Finally, GeneXpert may fail to detect hetero-resistance, i.e. resistance-connoting mutations present in subpopulations within the patient [Zetola et al. 2014]. For all of these reasons, a broader-based assay, such as WGS, could offer the greatest clinical utility at this point in the diagnostic process, by looking beyond the targets of the current molecular assays.
By sequencing the whole genome, in theory all resistance-connoting mutations that can guide clinical treatment can be identified by comparing the genome of the patient isolate with detailed databases of known resistance markers [Sandgren et al. 2009; Flandrois et al. 2014]. In practice, this will work, if (a) these markers accurately predict in vitro phenotypic resistance, and (b) these markers predict clinical outcome. For the latter, we are unaware of studies that have directly assessed the utility of WGS data for predicting patient response to treatment. For the proximal goal of linking WGS to phenotypic resistance, there are emerging data which present a mixed message. Using online databases, supplemented with an updated search of the literature, Coll and colleagues [Coll et al. 2015] developed a mutation library and examined the concordance between genotypic predictions and phenotypic data for 788 isolates from diverse geographic settings. Among the drugs with sufficient phenotypic data (rifampin (RIF), isoniazid (INH), ethambutol (EMB), pyrazinamide (PZA) and streptomycin (STR)) as well as second-line drugs (amikacin (AMK), capreomycin (CAP), ethionamide (ETH), kanamycin (KAN), moxifloxicin (MOX), ofloxacin (OFX)), the sensitivity of WGS for predicting resistance was highest for INH and RIF at 92.8% (95% CI 89.9–95.7) and 96.2 (95% CI 93.9–98.5). At the other end of the spectrum, the sensitivity of WGS for PZA-resistance was only 70.9% (95% CI 62.4–79.4). Thus, if WGS replaced phenotypic testing, one-twelfth of INH-resistant and one-third of PZA-resistant cases would receive these potentially hepatotoxic drugs, with little or no benefit. Specificity of WGS was highest for INH and RIF at 100% (95% CI 100–100%) and 98.1% (95% CI 96.8–99.4%), respectively, but for other drugs, specificity was as low as 81.7% (EMB).
In the same manuscript [Coll et al. 2015], Coll and colleagues also compared the performance of their database with KvarQ, a software that uses pre-specified ‘testsuites’ of known resistance-connoting mutations and other regions of interest to predict resistance [Steiner et al. 2014]. Using phenotypic data as the gold standard, sensitivity was substantially lower for nearly all drugs using the KvarQ method (though 95% CIs overlapped for all except EMB and KAN). Among first-line drugs, only RIF yielded similar point estimates to those obtained with Coll and colleagues’ mutation library, with sensitivity of 95.8% (95% CI 93.4–98.2%), while sensitivity for INH was only 86.9% (95% CI 83.1–90.7%). No results were available for ETH and CAP using the KvarQ software. Specificity was generally higher using KvarQ, though this difference was only significant for EMB and STR. Specificity for RIF was similar to that obtained with the mutation database, at 97.9% (95% CI 96.5–99.3%).
In a similar study [Walker et al. 2015], Walker and colleagues selected 23 candidate resistance-associated genes from the literature [Sandgren et al. 2009] and then used an algorithm to characterize mutations (SNPs and indels) within these genes and their promoter regions as resistance-connoting or benign. In a training dataset of 2099 isolates, 120 resistance-connoting mutations were identified, 772 were classified as benign and 101 could not be classified as either (called ‘uncharacterized’). The resistance-connoting and benign mutations identified in this training dataset were then used in a validation study on an additional 1552 genomes, 29% of which were resistant to at least one drug on drug susceptibility testing (DST). Using these mutations, authors were able to predict 89.2% of phenotypes as resistant or susceptible. 10.8% of phenotypes could not be predicted, as these contained mutations that had not been characterized. Among those where phenotype could be predicted and considering predictions for each drug independently, 112 of 6892 with drug-sensitive DST were predicted to be resistant based on WGS (1.6%), while 94 of 1221 with drug-resistant DST were erroneously predicted to be drug-sensitive (7.7%). The latter may be due to mutations with unknown function outside the 23 candidate genes interrogated. This is similar to Farhat and colleagues [Farhat et al. 2013]; in this study, authors performed targeted deep sequencing of known resistance genes to verify that resistance mutations were absent in subpopulations within isolates. They found that 13/47 isolates with phenotypic resistance had no previously known mutations. Unexplained resistance, wherein phenotypic resistance is present but known resistance-connoting mutations are absent has been most pronounced for PZA [Hewlett et al. 1995] and second-line drugs. For example, Farhat and colleagues [Farhat et al. 2013] found that, among isolates resistant to ciprofloxacin, KAN and CAP, 2/3, 6/18 and 1/6 isolates, respectively, had unexplained resistance. As the reliability of phenotypic testing is least well established for these drugs [Horne et al. 2013], this is where there is the greatest need for WGS, but presently also the greatest knowledge gap.
In clinical medicine, the physician wants to know whether the isolate has a resistance-connoting mutation or not, so that treatment can be tailored accordingly. Indeterminate test results offer little clinical guidance, and often steer clinicians to other antibiotics, where feasible. While it is logical to exclude isolates with uncharacterized mutations from a scientific paper that aims to understand resistance, in a clinical laboratory, these have to reported one way or the other. Analyses that classified such uncharacterized mutations as predictive of phenotypic susceptibility greatly affected test parameters; the sensitivity of WGS for INH and RIF resistance dropped from 94.2% (95% CI 91.1–96.5%) and 96.8% (95% CI 94.1–98.5%) with uncharacterized mutations excluded to 85.2% (95% CI 81.1–88.7%) and 91.7% (95% CI 87.9–94.5%) with uncharacterized mutations included, respectively. Sensitivity for PZA resistance in the latter analysis was the lowest overall, at only 24% (95% CI 17.9–30.9%). Until such mutations can be confidently assigned to the appropriate phenotype, it would seem that parallel, or at the least, sequential phenotypic testing should remain part of the diagnostic pathway.
Furthermore, these publications generally included biased samples, with relatively high proportions of drug-resistant isolates. As many clinical labs identify primarily drug-sensitive isolates, the operating parameters of WGS for this purpose may change when evaluated against more representative samples. While authors had generally high specificity for most drugs, the predictive value depends on the underlying prevalence of drug resistance. In a country such as Canada, which detected RIF resistance among only 17 of 1380 M. tuberculosis complex isolates analyzed in 2013 [Public Health Agency of Canada, 2015], a specificity of 98.1–99.2% and sensitivity of 91.7–96.2% based on the results of Coll and colleagues [Coll et al. 2015] and Walker and coworkers [Walker et al. 2015] would equate to ∼18 false positives per year, with a positive predictive value of only ∼46%. Without subsequent phenotypic testing, these cases would be subject to second-line treatment, with prolonged, unnecessary hospitalization. Thus, WGS may be best reserved only for individuals in which there was a higher pretest probability of resistance (based on some a priori criteria for the use of WGS, e.g. previous treatment).
Despite these limitations, it is clear that WGS offers magnitudes more information than the molecular methods listed in Table 1, with the potential of greatly advancing clinical diagnostics for M. tuberculosis. While the WGS database of Coll and colleagues [Coll et al. 2015] performed similarly to GeneXpert for RIF resistance, it also allowed for determination of INH mutations, and had an overall accuracy of 95.8%, as compared to 93.1% for MTBDRplus (Hain Lifescience, Nehren, DE) (p < 0.0004). Accuracy was also higher for second-line drugs compared with MTBDRsl (Hain Lifescience, Nehren, DE) (96.3% versus 93.7%, p < 0.0047). Walker and colleagues [Walker et al. 2015] showed similar sensitivity and specificity of their algorithm for determining the correct phenotype using WGS as the collective results of MTBDRplus, MTBDRsl and AID (AID Diagnostika, Strassberg, DE) line probe assays (LPAs). In addition, while synonymous SNPs can present as false positives on both LPA or GeneXpert, Walker and colleagues were able to classify these as benign.
Overall, these data support the great potential of WGS as a tool to predict resistance. However, databases of M. tuberculosis genomes, along with associated phenotypic data, are essential to identify unrecognized and emerging mutations. In addition, our ability to accurately predict phenotypic resistance is limited by our understanding of epistasis (the interaction between mutations, which can influence phenotype [Trauner et al. 2014]); mutations associated with resistance have been found in phenotypically sensitive bacteria [Walker et al. 2015], in some cases potentially due to interaction with other mutations in the genome. Until additional data are gathered, it can be foreseen that WGS may serve as an added, rather than a replacement test, on the diagnostic pipeline (Figure 2). This would incur added costs to the lab, something that is clearly less attractive than WGS simply replacing drug susceptibility testing (DST), with all its labor and reagent costs. One need look no further than the example of HIV treatment to imagine a world where genotype-based data are used to predict drug resistance, and hence treatment decisions. However, for all of the aforementioned reasons, we submit that reference labs need to maintain competence in phenotypic DST for the foreseeable future.
Another issue for clinical application of WGS is timeliness of reporting. As of yet, two papers reported on the application of WGS in ‘real-time’ to clinical cases: a case report of a patient [Köser et al. 2012] with extremely drug-resistant (XDR) TB (defined as MDR TB plus resistance to an injectable second-line drug and a fluoroquinolone) and a prospective cohort of patients in the United Kingdom suspected of having XDR TB [Witney et al. 2015]. Köser and colleagues successfully obtained sequence data from a 3-day-old MGIT culture, identifying two concurrent but distinct strains of M. tuberculosis [Köser et al. 2012]. Predicted resistance and sensitivity concurred with phenotypic results for all drugs tested, while WGS predicted resistance to an additional five drugs. While WGS results had no impact on treatment, WGS did identify a mutation in the gene activating PAS in the minority strain, despite a phenotypic determination of PAS-S. Unfortunately, the functional impact of this was unknown. Witney and colleagues [Witney et al. 2015] selectively applied WGS to six cases with potential XDR TB, identified over 6 years in London, with multiple isolates sequenced per patient. Results for five out of six cases were available in a clinically actionable time frame. Genotypic and phenotypic resistance were 100% concordant for INH and RIH, while discrepancies were reported in PZA, EMB, fluoroquinolones (OFX and MOX), AMK, KAN, CAP, PRO and PAS. In terms of clinical utility, WGS data helped guide treatment decisions by confirming PZA resistance in one case, and refuting an XDR diagnosis in favor of MDR in another. For another case, clinicians decided to continue with treatment with EMB, despite development of phenotypic resistance, as WGS failed to identify mutations in embA or embB that could explain the change in DST.
The Witney and colleagues study also illustrated that for WGS data to be used clinically, the results need to be analyzed rapidly and presented in a clear, easily interpretable manner. Several groups have produced online tools (e.g. ‘PhyResSE’ [Feuerriegel et al. 2015] and ‘TB Profiler’ [Coll et al. 2015]) wherein raw sequencing data for an isolate can be uploaded and analyzed for resistance-connoting mutations. As mentioned previously, the KvarQ software can also predict resistance from raw sequencing data; in contrast to PhyResSE and TB Profiler, this can be done on a local server [Steiner et al. 2014]. Yet, despite efforts to make these reports accessible to the wider scientific community, a knowledge of genomics and/or bioinformatics is still required to interpret results. As an example, the quality of SNPs is provided with details such as depth of coverage, a parameter that most clinicians would be uncomfortable judging. Presently, PhyResSE and TB profiler are explicitly for research purposes only, which poses regulatory hurdles to the delivery of results destined for the clinical chart. Witney and colleagues [Witney et al. 2015] piloted a WGS report during the course of their study, but, unfortunately, clinician perception of this report and its interpretability was not assessed. Furthermore, though ‘best practices’ have been proposed for identifying SNPs [Olson et al. 2015], the current bioinformatics workflows used to analyze WGS data remain largely unstandardized. For implementation in the clinical lab, appropriate quality control measures [Clinical and Laboratory Standards Institute, 2014] and a standardized workflow need to be established. The lessons of the past five decades of emerging antibiotic resistance have demonstrated that even a simple dichotomous test result, i.e. resistant or susceptible, does not always predict appropriate care. Therefore, the application of WGS-based results to clinical care may benefit from evaluations done by experts in implementation science, rather than genomics or microbiology.
Conclusion
Offering increased resolution and substantially more data compared with conventional methods, WGS has revolutionized the arena of molecular epidemiology. Now, it seems poised to do the same for the clinical microbiology laboratory. The appeal of WGS for M. tuberculosis (and other pathogens) lies in the quantity of data provided; with one test, an organism can be speciated, resistance mutations can be detected and the strain can be placed in the context of the local epidemiology. The challenge of WGS also lies in the quantity of data provided; the same test can occupy a team of bioinformaticians, yet generate results that few clinicians can currently interpret. Furthermore, for WGS data to be clinically useful, results must be available in sufficient time to guide patient care. Recent advances such as sequencing directly from clinical samples and the rapid workflow of the Nanopore MinIon may facilitate this. The decision to whom this ‘test’ will be applied is also critical. Though no studies to date have examined cost-effectiveness of implementing WGS, it can be predicted that application of this test to all, unselected samples without removing other steps in laboratory workflow could be prohibitively expensive. Therefore, it can be foreseen that WGS will be applied selectively, for instance, on patients with Rifampin resistance mutations detected by the GeneXpert assay.
The issues raised above are only further amplified when contemplating the countries of the world that suffer the greatest burden of TB and have the highest prevalence of drug-resistant strains. While it is clearly feasible to ship sequencing machines around the world, as has already been done with the GeneXpert platform, it is not as simple to distribute the technical and bioinformatic expertise required for next-generation sequencing where it is needed. A potential solution to the latter is open-source coding and online data treatment, but this is currently lacking for clinical use, even in settings with expertise in these methods. Ultimately, what is needed is an easy-to-use software complete with a graphical user interface that is capable of converting data-intense sequence files into a simple, concise clinical message. As done with GeneXpert [Theron et al. 2014b], these outputs then need to be field-tested in settings with a sufficient burden of drug-resistant TB to enable evaluation of whether test results altered treatment decisions and clinical outcomes. The relatively small number of MDR TB patients in countries such as Canada may preclude a formal evaluation of patient outcomes, simply due to sample size considerations. In order to assess its clinical utility for resource-rich countries where its use has been pioneered, we may need to first embed WGS in treatment studies conducted in the developing world, where the challenge posed by TB and drug resistance remains the greatest.
Footnotes
Funding
The author(s) disclosed receipt of the following financial support for the research, authorship, and/or publication of this article: M. tuberculosis genomic epidemiology work in the laboratory of MAB is supported by the Canadian Institutes of Health Research (MOP# 125858).
Conflict of interest statement
The author(s) declared no potential conflicts of interest with respect to the research, authorship, and/or publication of this article.