
Abstract
Objective
Trajectories of physiomarkers over time can be useful to define phenotypes of disease progression and as predictors of clinical outcomes. The aim of this study was to identify phenotypes of the time course of late-onset sepsis in premature infants in Neonatal Intensive Care Units.
Methods
We examined the trajectories of a validated continuous physiomarker, abnormal heart rate characteristics, using functional data analysis and clustering techniques.
Participants
We analyzed continuous heart rate characteristics data from 2989 very low birth weight infants (<1500 grams) from nine NICUs from 2004–2010.
Result
Despite the relative homogeneity of the patients, we found extreme variability in the physiomarker trajectories. We identified phenotypes that were indicative of seven and 30 day mortality beyond that predicted by individual heart rate characteristics values or baseline demographic information.
Conclusion
Time courses of a heart rate characteristics physiomarker reveal snapshots of illness patterns, some of which were more deadly than others.
Introduction
Clinical features of neonatal sepsis can be non-specific, hampering the ability to intervene early in the course of disease. Continuous monitoring can identify subtler signs of infection and facilitate earlier detection of sepsis.1,2 Neonates have a unique physiological response to infection, manifested as reduced heart rate variability and transient decelerations in heart rate. 3 These heart rate characteristics (HRCs) can be calculated from routine bedside monitoring data, and have been developed into a predictive monitoring score as the HRC index, allowing real-time computation of fold-risk for sepsis in the next 24 hours. 4 A previous randomized controlled trial (RCT) demonstrated that display of the HRC index at the bedside alongside its five-day historic trend reduces infant mortality. 5 The mean HRC index trajectory from this multicenter trial plots as a flat line with a rise in the day before a blood culture, 6 but not all individual patients followed this trajectory before sepsis diagnosis.
While the instantaneous HRC index is well calibrated to provide the fold-risk of sepsis at a given time, it is not known whether the trajectory of the index could provide additional clinical utility. Clinical intuition suggests an upward spike in the index should lead the physician to consider obtaining a blood culture, and this has borne out to be a high yield strategy. 7 However, identification of other common trajectories has not been explored and might add further information to the clinical picture.
Functional data analysis is a body of statistical tools which allow for the identification and analysis of common trajectory shapes seen in a dataset. These methods were developed to leverage the information contained in a patient’s entire time series as a “function” variable without the loss of information inherent in creating summarized variables at a given time point. We hypothesized that utilizing functional data analysis alongside unsupervised clustering to identify and classify common trajectories in the HRC index would add value in predicting mortality, sepsis, or culture result beyond the raw HRC index and basic demographic information. This may further assist in identifying neonates at risk of impending clinical deterioration.
Methods
The HRC Index
The HRC index combines mathematical algorithms to detect reduced heart rate variability and transient decelerations in heart rate into a single fold-risk score for sepsis. It is computed via a normalized logistic regression algorithm that combines the standard deviation (indicator of reduced variability), sample asymmetry (indicator of transient decelerations), 8 and sample entropy (a measure of pattern regularity that reflects both variability and decelerations) 9 of the RR intervals from the bedside monitor. 4 The HRC index has been mapped to clinical events and shown to support decisions of neonatologists and nurses in saving lives.2–5,10–12
The commercial HRC index monitor used in this study was the HeRO (Heart Rate Observation) monitoring system (Medical Predictive Science Corporation, Charlottesville, VA). It calculates the HRC index components from bedside monitor data and displays the current fold-risk alongside a time series plot of the hourly HRC index from the past five days.
Because the HRC index is a fold-risk score, the population mean of the index over all time is set at one. Consequently, a HRC index of two should be understood as a twofold risk of sepsis compared to baseline in the next 24 hours. The HRC index is truncated at a maximum value of seven and waxes and wanes throughout the NICU stay. Infants with persistently low HRC indices tend to have smooth clinical courses, while infants with severe chronic lung disease or brain injury can have persistently high HRC indices.10,13,14 We studied the HRC trajectory shapes in the five day period leading up to blood culture orders. The five day window was chosen to match the five day historic HRC index trend shown to clinicians on the display.
Dataset
HRC index data from very low birth weight infants (<1500 grams) from nine NICUs were collected from 2004–2010 in a randomized control trial (RCT) where half of the infants had their HRC indices displayed and the other did not. 5 Parents provided written informed consent when necessary to participate in the trial. This study re-analyzes the data recorded in the trial.
Since most of the survival benefit occurred in infants who had sepsis, the benefit of the monitoring display was attributed to early warning of impending illness, leading to earlier intervention (Fairchild, 2013).12 Importantly, the display group might exhibit a different time course leading to blood culture than the non-display group due to this early warning. To investigate whether the HRC index trajectory added valuable information to the current HRC index, we developed a model based on the five days of data from the display group. Then, we applied a version of that model (described below in the Comparison to Non-Display Group Infants section) to the non-display group as an out-of-group comparison.
The analytic sample consisted of HRC index data five days prior to every bacterial, yeast, and/or fungal culture with at least 50% of the measurements available. Data leading to both positive and negative cultures were analyzed. All blood cultures taken in the seven days after a positive culture were excluded except for new positive cultures of a different organism. Cultures obtained on the day of admission, when the infant was less than three days old, and those which returned an unknown or questionable result were also excluded.
Identification of Characteristic Trajectory Phenotypes
We used functional data analysis 15 to model the HRC index trajectories of display group infants in the five days leading up to a blood culture. Functional data analysis refers to a branch of statistical techniques that can identify and analyze the unique shapes seen in a dataset of trajectories. We used functional principal component analysis16,17 to reduce the dimensionality of the five days of data from each patient while maintaining the essential features of the curvature of the trajectory. This works by finding a set of principal component curves which represent most of the variability in the dataset. Each individual trajectory can then be represented by the sum of these principal component curves multiplied by a set of corresponding coefficients. This reduction in the dimensionality of the dataset allows for the use of clustering (see the Clustering subsection) to find the coefficients that are most commonly seen together. Then, we multiplied the principle component curves by these sets of characteristic coefficients and summed the curves to generate visualizations of the most common curves seen in the dataset (see Characteristic Curves subsection).
Functional Data Analysis
In functional data analysis, each trajectory is represented by a linear combination of basis functions that captures the time-varying components. A variety of basis functions can be selected based on the characteristics of the original trajectories, the most familiar being the Fourier series, which is useful for fitting periodic data. Here we chose a B-spline basis because we sought to capture the subtleties of non-periodic trajectories.
Hourly HRC indices over the five day period were captured, yielding up to 121 data points per infant. Infants with missing data at either end of the five day window were extrapolated to the window edge by repeating the most proximal HRC index value. Interior missing values were filled with linear interpolation.
The HRC index monitor algorithm uses the past 12 hours of patient data to generate a single score per hour. Thus, HRC indices 12 samples apart are independent. In order to capture enough information about the curvature of these independent samples we chose to fit one B-spline per six samples (plus one due to the odd number of input data points), resulting in a choice of 21 B-splines. In order to be able to look at the acceleration function, which requires trajectories to be smooth to the fourth derivative, we used fifth order B-splines with equally spaced knots. 18
Functional principal component analysis16,17 was used to determine the dominant variability in the HRC index trajectories. The top four principal components were selected since they explained 89% of the data’s variability. The functional principal components were then used to represent each infant’s data by a linear combination of the four component curves. This generated a smoothed version of the infant’s original curve, and reduced the dimensionality of each infant’s data from 121 hourly HRC indices to four principal component coefficients. These above steps were completed using modified code from J.O. Ramsay.19,20
Clustering
To find the common characteristics of these sets of principal component coefficients, we used an unsupervised ensemble clustering technique. This method uses a k-means cluster generation mechanism with different values of k; the ensemble members were refined using selective clustering by cluster entropy; and the consensus function was locally weighted evidence accumulation (LWEA), a version of hierarchical agglomerative clustering.21,22
Characteristic Curves
To generate a visualization of the characteristic curve from each cluster, we found the coordinates of the centroid of each cluster. The linear combination of these coordinates (which are coefficients of the four principal components) with the corresponding principal component curves yielded the characteristic curve. We recognize that, given this is ensemble clustering, the clusters are not necessarily spherical, so the centroid has less meaning than it would in a k-means clustering and is not necessarily the ideal representative curve for the cluster. However, our hope was that the curve would allow us to pair statistical outcomes with a rough visualization of a clinical trajectory.
Model Comparison
In premature infants, baseline risk of late onset neonatal sepsis is correlated with birthweight and days of age. The HRC index at time of blood culture adds further information. 6 We investigated the additional information that cluster (trajectory phenotype) membership added to the risk of a variety of outcomes. Outcomes investigated were all binary in nature: positive vs negative blood culture, mortality within 30 days vs survival for 30 days, mortality within seven days vs survival for seven days, culture-proven sepsis vs clinical sepsis or sepsis ruled out, positive blood culture (excluding coagulase negative staphylococcus species (CONS)) vs negative culture or CONS, and gram-negative organism cultured vs gram positive organism cultured or negative culture. These outcome labels were determined based on detailed data collected by research personnel and manual neonatologist corrections as part of the randomized clinical trial. 12
Baseline risk of each outcome for each infant was calculated as the discrete prior probability of the outcome given birthweight and days of age. Bins were created for birthweight in 200 g intervals from 200 to 1600 g (since the max birthweight was 1500 g, the last bin contained infants only between 1400 and 1500 g) and for age in four day intervals from zero to 224 days. Baseline risk was calculated as the rate of the outcome in that infant’s bin excluding the infant of interest.
Logistic regression was used to determine whether the cluster category provided additional information about any of the outcomes. The inputs to the logistic regression model were the prior probability of the outcome given birthweight and days of age, the HRC index at the time of blood culture, and a binary variable indicating the cluster to which the infant was assigned. We repeated this process with each of the different outcomes, with the number of clusters ranging from two to 12. The number of clusters included in each model is denoted by “+ [number] Clusters” in the model name.
Re-seeded Clustering
To rule out the possibility of the seed skewing our modeling results, we re-ran the clustering algorithm with 100 different seed values for every model. These cluster results were used for the logistic regression procedure and an average Akaike information criterion (AIC), Bayesian information criterion (BIC), and area under the receiver operating characteristic curve (AUC) (across seeds) were computed for each model.
Comparison to Non-Display Group Infants
Validity of the results was investigated by applying the display group infants’ functional principal components and clustering to the non-display group infants. While non-display group infants might not have the same decision point for cultures as the display group infants, changes in cluster membership percentages and outcomes risks by trajectory phenotypes might help quantify the utility of HRC index display. Because the clustering method we used for the display group infants was a hierarchical agglomerative clustering method, new samples could not be incorporated into the clustering algorithm without altering the model itself. Therefore, we used the principal component coefficients and cluster labels from the display group infants in Matlab’s bagged trees classifier to create a classification algorithm. This algorithm took in the four principal component coefficients for each infant and output a cluster label.
Results
The original RCT data set included 4379 blood cultures on 1500 infants randomized to HRC index monitoring display that met the inclusion criteria. Of these, 3800 (80.2%) had 50% or more data availability in the five days prior to the culture and were included in the analysis. 1489 infants were randomized to the non-display group. In the non-display group, there were 3827 blood cultures. Of these, 3211 had 50% or more data availability, and thus were included in the analysis. There was a great deal of variability among HRC index trajectories (Figure 1a). Figures 1b-d show the transformation of this high dimensional dataset into a four principal component representation.

Examples of the Dimension Reduction Procedure
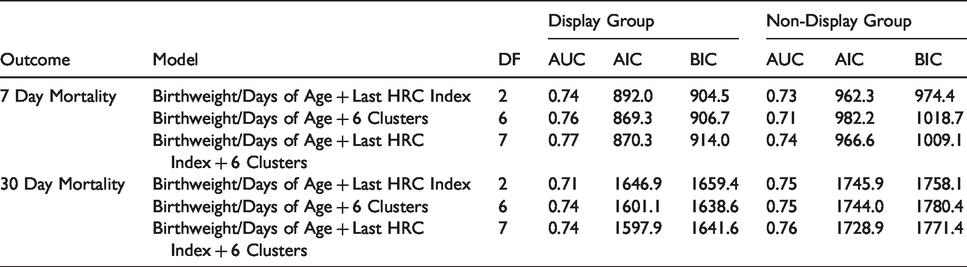
With six clusters we achieved the best tradeoff between adding information and variable parsimony. Additionally, the most consistent performer in the model fitting across all outcomes was the model with Birthweight/Days of Age + Last HRC index + 6 Clusters when varying the number of B-splines, the number of basis functions, the starting seed, and the outcome parameter. Mortality prediction (both seven day and 30 day) was bolstered by the cluster assignment information. The improvement in prediction using six trajectory phenotypes is shown in Table 1 (for a table showing all models tested, including comparisons to alternative simple models such as maximum HRC Index, see Supplemental Table 1). AUC and AIC improved for both display and non-display groups for both seven and 30 day mortality with addition of the 6 Clusters to the model. Characteristic curves are shown in Figure 2 along with the associated mortality risk. Figure 3 shows the Receiver Operating Characteristic (ROC) Curves for each of the models in Table 1, along with the baseline ROC curve for birthweight/days of age alone (an augmented version of this figure including more alternative models is included as Supplemental Figure 1). Clusters 3 and 6 have higher seven day mortality risk, while Clusters 5 and 6 have higher 30 day mortality risk. The regression results for the non-mortality outcomes are shown in Table 2.
The cluster assignments added predictive value to both seven and 30 day mortality outcomes. The Birthweight/Days of Age + Last HRC Index + 6 Clusters model shows an improvement in AUC and AIC over the baseline Birthweight/Days of Age + Last HRC Index model for both seven and 30 day mortality outcomes for both the display and non-display groups. DF = degrees of freedom. AUC = area under the receiver operating characteristic curve. AIC = Akaike information criterion. BIC = Bayesian information criterion.

Characteristic HRC Index Trajectories Leading to Blood Culture in Display Group Infants.

ROC Curves for 7 and 30 Day Mortality
AUCs for non-mortality outcomes show that the clusters did not add predictive value to identifying any of the other outcomes tested other than mortality. DF = degrees of freedom. CONS = coagulase negative staphylococcus.

Re-running each of the models with 100 different cluster seeds supported our selection of six clusters. The Birthweight/Days of Age + Last HRC Index + 6 Clusters model had the lowest mean AIC of all the models for seven day mortality, and the second lowest mean AIC for 30 day mortality – superseded only by the Birthweight/Days of Age + Last HRC Index + 5 Clusters model. For all of the models that excluded the Last HRC Index, the Birthweight/Days of Age + 6 Clusters model had the lowest AIC for both seven and 30 day mortality. The mean AIC, BIC, and AUC values are shown in Supplemental Tables 2 and 3. Across the 100 cluster seeds, the addition of the six clusters maintained its improvement in AUC. The Birthweight/Days of Age + Last HRC Index model and the Birthweight/Days of Age + Last HRC Index + 6 Clusters model returned 7 day mortality AUC values of 0.735 and 0.761 ± 0.008, respectively (an improvement of 0.026 ± 0.008) with the addition of the six clusters. 30 day mortality AUC values improved as well with the addition of the six clusters, increasing from 0.714 to 0.735 ± 0.004 (an improvement of 0.021 ± 0.004).
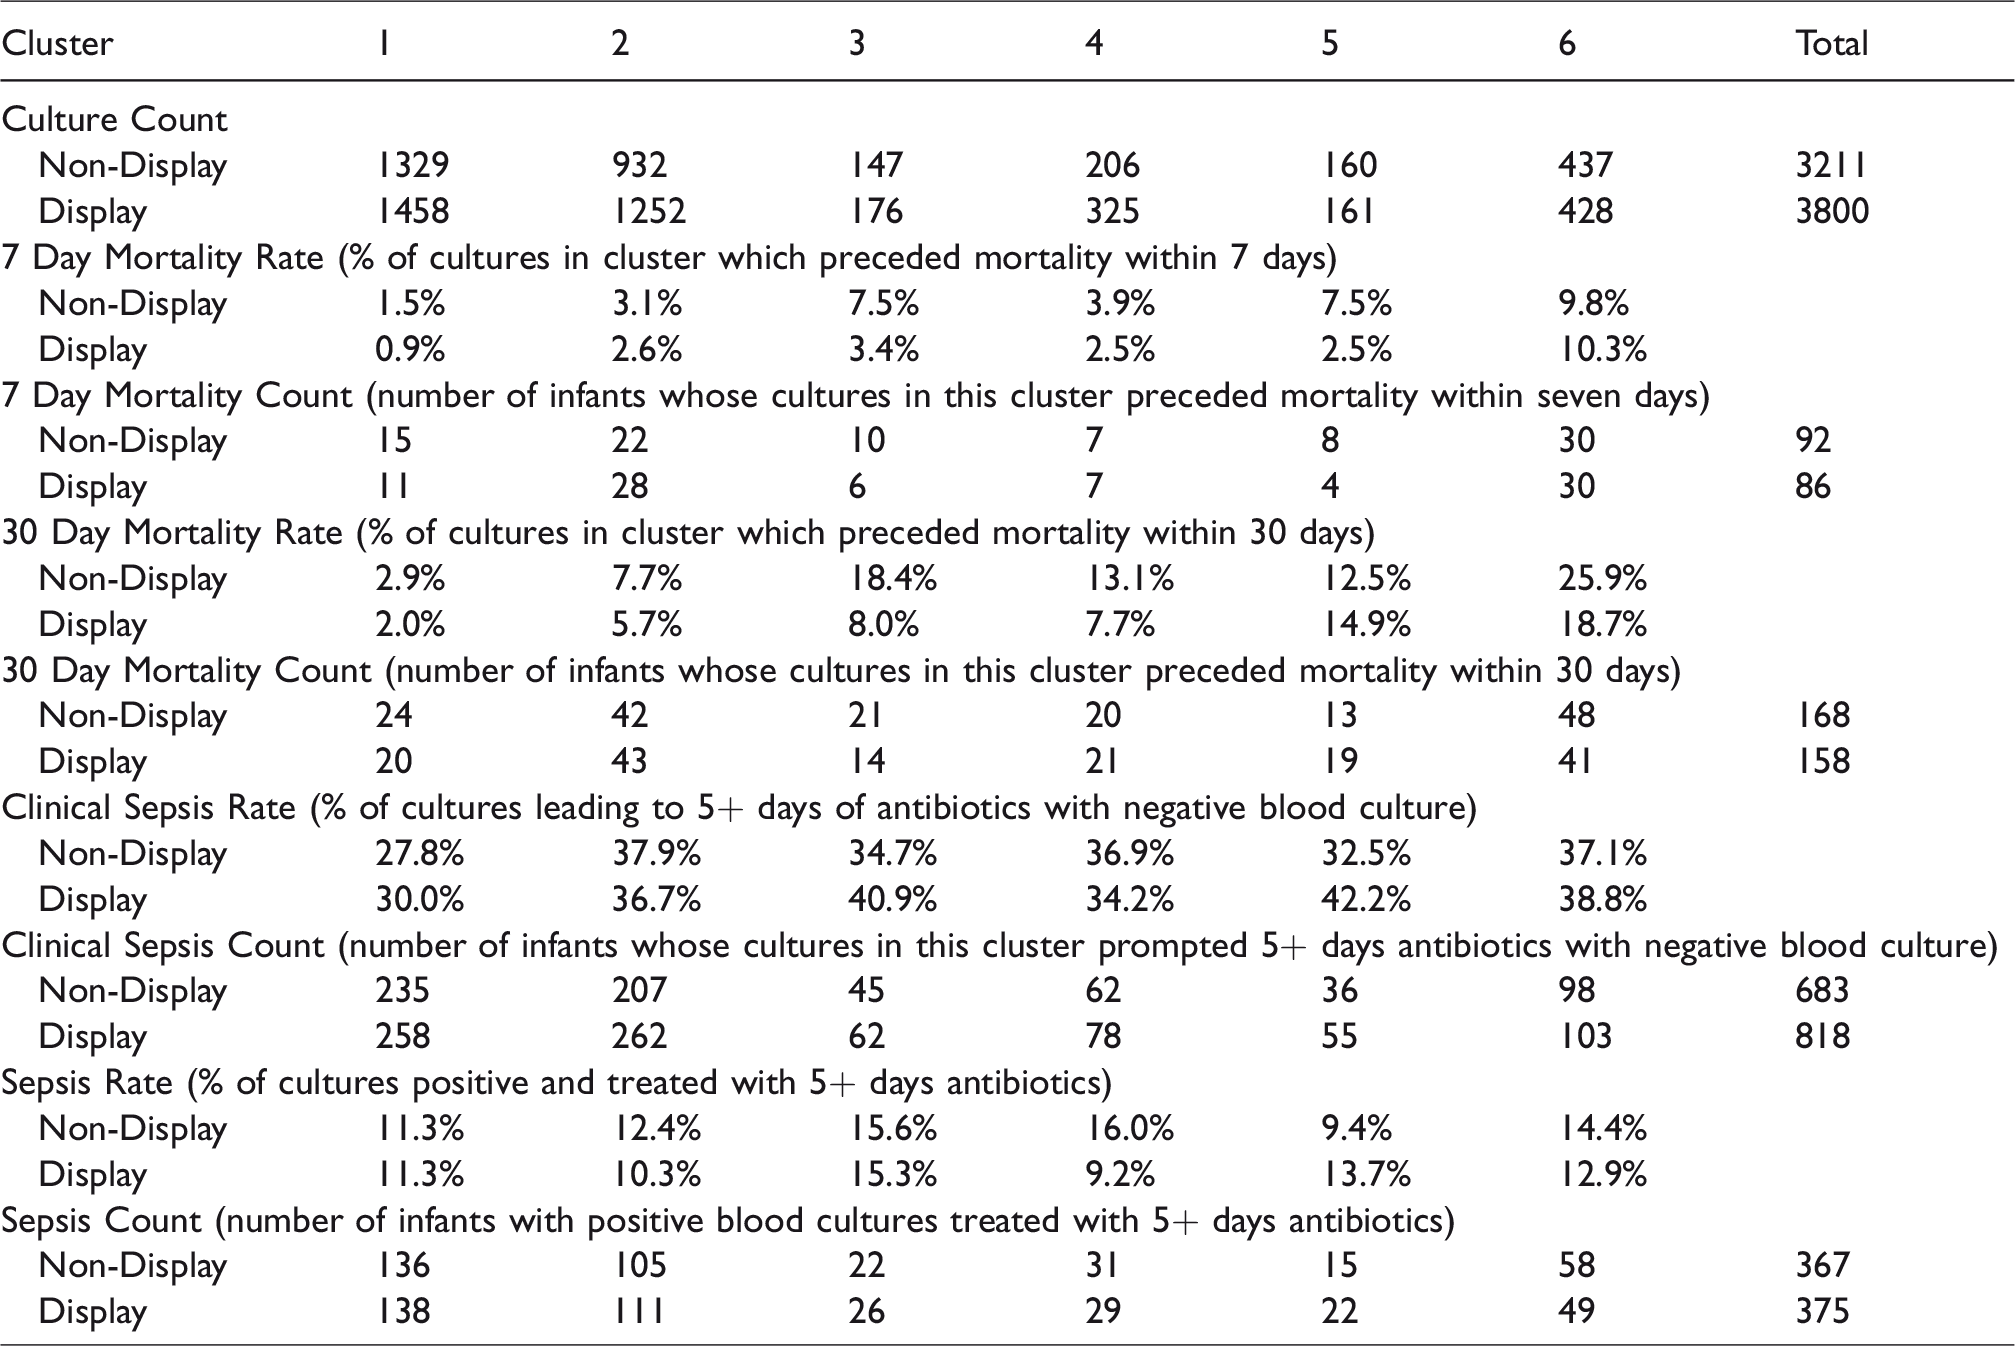
Display group infants had a higher overall culture count (Table 3), which might be attributable to clinicians reacting to high scores by obtaining cultures. These additional cultures were especially prevalent in infants belonging to Clusters 2 through 4. Only the display group infants in Cluster 6 had a lower number of cultures.
Cluster-Specific Event Distribution Reviewing both the event counts and rates is essential because an overall increase in the number of cultures in a HRC index display cluster can lead to an increased event count but also a decreased event rate. A targeted increase in culture rate could be warranted in a particular cluster because of the increased event rate, but the justification for such an increase could be washed out if only reviewing the percentage.
Discussion
We studied trajectories of the heart rate characteristics index, the fold-increase in risk of sepsis in the next 24 hours, in a large cohort of infants from a multicenter randomized trial. The findings expand considerably on our prior work to examine how risk trajectories are related to clinical events. Sullivan et al. previously reported that a rise from a stable and low risk five-day baseline to a high risk (more than threefold increase in HRC index) had a more than 50% positive predictive value for suspected or clinical infection. 7 Here, we have used sophisticated mathematical methods of functional data analysis and unsupervised clustering to discover relevant trajectories beyond the simplified approach of analyzing large spikes.
We found six trajectory clusters that are consistent with clinical scenarios ranging from small increases from a low baseline score to large decreases from a high baseline score. Non-display group infants showed similar trajectory clusters distributions as the display group infants. These trajectories added predictive value for mortality risk beyond that provided by the instantaneous HRC index, birthweight, and days of age. This finding underscores the utility of considering trajectories rather than spot checks of risk estimates in the field of predictive analytics monitoring.
Moorman et al. did not directly investigate the mechanism of mortality reduction in the display group infants in the randomized controlled trial, but hypothesized that it was due to early detection of sepsis or other systemic inflammation. 5 This hypothesis was supported by the Fairchild et al. 12 finding that the mortality reduction was greatest in septic infants. Here we look at the changes in the distribution of cluster assignments for both the display and non-display infants in Table 3 to help elucidate places where the HRC index monitor may have led to changes in clinical practice, resulting in mortality reduction.
The six distinct trajectories in Figure 2 each tell a story when paired with our clinical experience working alongside these monitors and the outcomes computed in Table 3. The clinical vignettes we deduce from these sources provide a first glimpse toward explaining how clinicians interacted with the HRC index monitor system to reduce mortality.
Additionally, the clinical sepsis rate and counts were higher for the display than the non-display infants in Cluster 3. This points to the possibility that the HRC index trajectory may have been used as an early warning or tiebreaker in the face of early, equivocal clinical signs of sepsis, possibly influencing clinicians’ decisions to continue antibiotics despite negative blood cultures. While it is also important to avoid antibiotic overuse for unproven sepsis, there may have been a mortality benefit from empiric treatment for display group infants with this trajectory, given that display group infants showed a decrease in both the mortality rate and count.
It is noteworthy that this is the only cluster where the 30 day mortality rate increased in comparison to the non-display group. This points to a potential danger that a high score (5) dropping down to a lower score (3), could unintentionally promote a false sense of security, despite the score of 3 still indicating a threefold risk in comparison to baseline.
Conclusion
The results of our analysis inform use of HRC index monitoring for clinical care in several ways. First, we found that the most notable mortality advantage in patients randomized to HRC index display occurred in infants with a rise in HRC index from a low baseline that preceded blood culture by almost two days (Cluster 3) and therefore may have encouraged antibiotic administration in a situation with equivocal clinical signs of illness. Second, different HRC index trajectories are associated with different patterns in practice, measured by rates of blood cultures and clinical sepsis diagnoses, or the decision to extend antibiotics in the face of a negative blood culture. Furthermore, mortality and sepsis rates associated with each of six distinct HRC index trajectories provide information on mortality risk associated with different patterns in the manifestation of abnormal physiology. Finally, our analysis shows that knowing the trajectory cluster adds information on mortality risk over that predicted by birthweight, days of age and last HRC index.
Supplemental Material
sj-pdf-1-cvd-10.1177_2048004020945142 - Supplemental material for Trajectories of the heart rate characteristics index, a physiomarker of sepsis in premature infants, predict Neonatal ICU mortality
Supplemental material, sj-pdf-1-cvd-10.1177_2048004020945142 for Trajectories of the heart rate characteristics index, a physiomarker of sepsis in premature infants, predict Neonatal ICU mortality by Amanda M Zimmet Brynne A Sullivan J Randall Moorman Douglas E Lake Ratcliffe
Footnotes
Acknowledgements
We would like to thank the original HeRO trial clinical investigators: Waldemar A. Carlo, MD, John Kattwinkel, MD, Robert L. Schelonka, MD, Peter J. Porcelli, MD, Christina T. Navarrete, MD, Eduardo Bancalari, MD, Judy L. Aschner, MD, Marshall Whit Walker, MD, Jose A. Perez, MD, Charles Palmer, MD, George J. Stukenborg, PhD, and Thomas Michael O’Shea, MD. We are grateful to the original HeRO trial study coordinators as well: Stella Parolisi, Cathy Horton, Terri Smoot, Patty Brown, Monica Collins, Shirley Cosby, Daniela Castano, Steven Steele, Amy (Law) Beller, Nikki Barrett, Charlene Wells, Catherine Wilson, Paige Wilson, Judy Vallati, and Amy Blackman.
Contributorship
AZ, SR, and DL conceived the study. DL provided the data and support for using it. AZ analyzed the data. SR and DL provided guidance in the data analysis process. AZ and RM wrote the first draft of the paper. BS provided clinical expertise regarding interpretation of the data. All authors reviewed and edited the manuscript and approved the final version of the manuscript.
Data
Data and code are posted to the University of Virginia Dataverse:https://dataverse.lib.virginia.edu/dataset.xhtml?persistentId=doi:10.18130/V3/2XENWC. 24
Declaration of Conflicting Interests
The author(s) declared the following potential conflicts of interest with respect to the research, authorship, and/or publication of this article: RM and DL have equity shares in Medical Predictive Science Corporation, Charlottesville, VA. RM is an officer and owns equity in Advanced Medical Predictive Devices, Diagnostics, and Displays. The other authors declare no conflicts of interest.
Ethical approval
This was approved by the University of Virginia Institutional Review Board - Health Science Research #21985.
Funding
The author(s) disclosed receipt of the following financial support for the research, authorship, and/or publication of this article: Translational Health Research Institute of Virginia. National Institutes of Health R01- HD48562. Medical Predictive Science Corporation, Charlottesville, VA.
Guarantor
SR
References
Supplementary Material
Please find the following supplemental material available below.
For Open Access articles published under a Creative Commons License, all supplemental material carries the same license as the article it is associated with.
For non-Open Access articles published, all supplemental material carries a non-exclusive license, and permission requests for re-use of supplemental material or any part of supplemental material shall be sent directly to the copyright owner as specified in the copyright notice associated with the article.