
Abstract
To comprehensively address global environmental challenges such as biodiversity loss, citizens need an understanding of the socio-economic fundamentals of human behaviour in relation to natural resources. We argue that Global Citizenship Education and Education for Sustainable Development provide a core set of socio-economic competencies that can be applied to tackle such challenges. As a central concern of this article, we report on the development of a competence model and its use in an empirical study. The study analyses the ability of German students (n = 268: 232 pupils in senior secondary school and 36 student teachers) to evaluate solutions for real-world Sustainable Development challenges quantitatively. In doing so, we investigate a theoretically described competence dimension, that is, ‘Evaluating and Reflecting Solutions Quantitatively-Economically’.
A Rasch partial credit model indicates that ‘Evaluating and Reflecting Solutions Quantitatively-Economically’ can be modelled as a one-dimensional competence. Grade level, general educational performance and high performance in subjects addressing Education for Sustainable Development positively affect ‘Evaluating and Reflecting Solutions Quantitatively-Economically’ scores. Although applying basic economic insights in a quantitative manner to Sustainable Development challenges is within the mathematical skill set of most students, even older or better-performing students find it difficult to do so. Thus, these findings underscore the need for economic competencies to be incorporated in Education for Sustainable Development and Global Citizenship Education.
Keywords
Introduction
Real-world cases of Sustainable Development (SD) at local and global scales, and in relation to phenomena such as climate change or biodiversity loss, are multifaceted (Gresch et al., 2015; Kolstø, 2006; Ratcliffe and Grace, 2003; Sadler et al., 2007). They pose multiple challenges not only to decision-makers and related professionals but also to citizens wishing to participate in public debate. To help overcome these challenges, a broad set of analytic and decision-support tools have been developed. These tools addressing SD challenges are characterized by a high degree of interdisciplinarity, as – at least – environmental, social and economic aspects need to be integrated. The tools include multi-criteria analysis, cost-effectiveness analysis and cost-benefit analysis. If educational research and practice aim to foster learner competencies in relation to these challenges, they need to apply these specific types of interdisciplinary approaches similar to research in the sciences as well as sociopolitical issues. These interdisciplinary approaches are strongly required in Global Citizenship Education (GCE) and Education for Sustainable Development (ESD). Both aim at education for mature and responsible citizens.
GCE and ESD
In international educational research, attention to GCE and ESD has been increasing as these practices aim to prepare learners for the multifaceted challenges of the twenty-first century (Jorgenson and Shultz, 2012; Streitwieser and Light, 2009; Wintersteiner et al., 2014). In what follows, we will adopt the following definition of GCE, given by the United Nations Educational, Scientific and Cultural Organization (UNESCO, 2014: 9; Wintersteiner et al., 2014): ‘GCE … recognizes the relevance of education in understanding and resolving global issues in their social, political, cultural, economic and environmental dimensions’. This definition of GCE can be compared to the relatively similar, and similarly vague, definition of ESD by UNESCO (Venkataraman, 2009: 8) – which illustrates that GCE and ESD are multidimensional (complementary and overlapping) approaches to issues in different areas instead of additional subjects or areas of concern (UNESCO, 2015): ‘ESD equally addresses all three pillars of sustainable development – society, environment and economy – with culture as an essential additional and underlying dimension. … ESD enables all individuals to fully develop the knowledge, perspectives, values and skills necessary to take part in decisions …’.
Thus, both GCE and ESD are revitalized again and again through knowledge produced by science and through political and social developments. A problem for GCE and ESD arises from this situation, however, specifically from the fact that social ideas can change (Deutsche Bundestag, 1998: 40; e.g. the political atmosphere during the current refugee crisis in Europe or the nuclear power phase-out in Germany). Thus, the question arises how both normative ideas of education, GCE and ESD, can be conceptualized. As for SD, one solution has been to understand it as a ‘regulative idea’ (Deutsche Bundestag, 1998: 60; Grunwald and Kopfmüller, 2006: 40), that is, a heuristic or guiding principle within a process (Homann, 1996: 38; quoted after Rauch and Steiner, 2013: 12). ‘Regulative ideas … steer the searching, research and learning process in a given direction and direct it to a given focus …’. In our opinion, the conceptualization as a regulative idea can be applied to nearly the same extent to GCE.
Both GCE and ESD can in fact be used as umbrella terms (Jorgenson and Shultz, 2012; Wintersteiner et al., 2014: 9), overlapping in several crucial areas, such as questions of political participation, democratic responsibility or global justice (Wintersteiner et al., 2014: 33). The most pivotal aspect they have in common is the requirement of a new – more sustainable and more just – perspective of the public resulting in a transformation of citizen thinking and lifestyle. This new perspective strongly depends on the educational level and domain-specific competencies of citizens (Koeppen et al., 2008) including civic competencies necessary to generate political pressure (Remmele and Seeber, 2012).
Challenges for GCE and ESD in dealing with socioscientific issues
In Germany, global development has been identified as a pedagogically neglected area (Sekretariat der Ständigen Konferenz der Kultusminister der Länder in der Bundesrepublik Deutschland und Bundesministerium für wirtschaftliche Zusammenarbeit und Entwicklung (KMK-BMZ), 2015). Furthermore, curricula in political education differ between the German federal states because of the federally structured educational system.
Science education in general and ESD and GCE in particular need to empower students to deal with pressing Global Citizenship (GC) and SD challenges (Bögeholz and Barkmann, 2014: 29; Bögeholz et al., 2014; Kolstø, 2006; Ratcliffe and Grace, 2003; Sadler et al., 2007) such as climate change and biodiversity loss (Intergovernmental Panel on Climate Change-Working Group II (IPCC-WGII), 2014; Jenkins, 2003). Literature in the field refers to the environment as a suitable context for GCE (Dobson, 2003; Tarrant, 2010; UNESCO, 2015). As Noddings (2005: 9) states, ‘(p)rotecting the Earth is one of the most important tasks facing global citizens’.
Solving SD issues requires the integration of multiple (often controversial) perspectives (for economic and civic education see Weber, 2015) in addition to interdisciplinary knowledge, that is, they lack a single perfect solution (Bögeholz and Barkmann, 2005; Bögeholz et al., 2014; Ratcliffe and Grace, 2003; Sadler et al., 2007; Zohar and Nemet, 2002). For the GC and SD challenges mentioned above, there is intense public and political debate on the best or most acceptable solutions (‘instruments’). In this regard, Remmele and Seeber (2012) mention that ‘Civic power of judgement without … general economic expertise is not convincing and effective, because to achieve one’s political objectives in a democratic society it is necessary to be in possession of the relevant arguments’ (p. 189). For instance, politicians and citizens who cannot be convinced by ethical or moral arguments might see an economic incentive to protect natural resources, for example, via Payments for Ecosystem Services (PES). Thus, political instruments are characterized by their quantitative effects (Bögeholz et al., 2014), and this requires an understanding of basic socio-economic mechanisms and institutions regulating human behaviour – and not only of natural resources (Sadler et al., 2007).
In sum, ESD, GCE and science education need to promote more than ethical argumentation skills. GCE and especially ESD also need to foster the ability to analyse the viewpoints of different stakeholders and evaluate pro and con arguments qualitatively. The ESD aim is ‘… to negotiate technically and economically viable, environmentally sound, and morally just solutions’ (Bögeholz et al., 2014: 237), which also implies an understanding of GC and SD challenges from a quantitative point of view. Therefore, insight is needed into the following: (1) basic economic concepts on their own account and in (2) application of quantitative economic analysis of alternative courses of action, (3) reflection on the suitability of policy instruments, and (4) analysis of socio-ecological dilemmas (Bögeholz et al., 2014). So far, German ESD has not adequately considered the quantitative abilities that are needed to solve real-world GC and SD decision-making challenges in the twenty-first century (Bögeholz and Barkmann, 2014: 32; Böhm et al., 2013). This highly relevant quantitative challenge is just starting to be addressed in educational research on competencies (Bögeholz and Barkmann, 2014).
Economic competencies required
Nearly all definitions of GCE and related concepts such as citizenship education, civic education, and so on, highlight the importance, inter alia, of economic considerations in public discourse and, consequently, as an educational topic. For example, Parker and Jarolimek (1984: 6) demand that an informed ‘democratic citizen’ be able and willing to participate in economic processes. Along these lines, the curricular knowledge incorporated in democratic citizenship education includes economic knowledge as one of five key components (Doğanay, 2012). Economic knowledge should include knowledge of the following topics (Doğanay, 2012: 31): economic rights, economic principles and consequences of economic development, key financial matters and associated economic literacy and SD locally and internationally. Moreover, both GCE and ESD refer to basic economic aspects (UNESCO, 2014). Considering integrative economic competencies as part of general education enables learners and the future citizens to ‘politically contribute to society … thus, they can explain, interpret and assess government action in a market-based system’ (Remmele and Seeber, 2012: 198; Seeber et al., 2012: 68).
Regarding economic competencies, we refer to the combined model on economic competencies of Sälzer and Prenzel (2014). The combined model describes the structure of economic competencies. It consists of two ‘precursor’ models. It can therefore be described by (1) three basic competence areas (Seeber et al., 2012: 76; own translation): ‘individual rationality’, ‘relations and interactions with others’ and ‘economic order and system phenomena’ as well as (2) three fundamental dimensions of economic literacy (Beck, 1998: 87): ‘economic knowledge and thinking’, ‘economically-normative reflection skills’ and ‘economic attitudes’. Basic economic concepts and insights in terms of the knowledge of economic principles (e.g. effects of supply and demand) especially refer to Beck’s (1998) dimension of the combined model on economic competencies (Sälzer and Prenzel, 2014) ‘economic knowledge and thinking’.
Economic education for our sample is implemented in curricula through the subject ‘civics, law, and economics’ (in German, Gemeinschaftskunde, Recht, und Wirtschaft, which refers to the integrated economics and political course in Saxony). The general objectives of this subject can be summed up as follows. The pupils ‘acquire intelligent knowledge about social, political, legal and economic issues in their complexity and interdependence’ and ‘develop the ability to reflect on specific work methods in a science-oriented manner and to present results in a suitable technical language, both verbal and written’ (Sächsisches Staatsministerium für Kultus (SMK), 2013: 2; own translation).
Factors influencing economic competencies
To resolve global SD challenges in their ecological, economic, social (cultural) and political dimensions, citizens need to understand socio-economic mechanisms and institutions regulating human behaviour in relation to natural resources. Thus, an understanding of economic insights and concepts is needed (Bögeholz et al., 2014). In this section, we will name a few of the most prominent known factors influencing economic understanding. Seeber and Remmele (2008) named age and grade level (‘years of schooling’) as key factors for economic understanding. From Claar (1990), we know that economic concepts can be applied progressively to complex situations with increasing age, since, ‘functional conditions of market economy are relatively complex, formal economic education is assumed to be a prerequisite for understanding them’ (Seeber and Remmele, 2008: 1).
In addition, gender and socio-economic status or social background is often investigated with performance on tests of any kind of economic knowledge (Jähnig, 2013; Jüttler and Schumann, 2016). With respect to economic education, it is strongly dependent on social background (Lusardi et al., 2010).
Research regarding the performance of women and men in economic tests remains a challenge for the future research due to conflicting evidence concerning the research outcomes. One can find reports for no or hardly no gender differences (Macha and Schuhen, 2013; Schuhen et al., 2016) as well as reports for gender differences where women repeatedly perform worse at economic tests than men (Hirschfeld et al., 1995: 3; Jüttler and Schumann, 2016; Schumann and Eberle, 2014a, 2014b; Schumann et al., 2013; Seeber and Remmele, 2008). However, the reasons for this phenomenon have not yet been sufficiently examined empirically. Suggested explanations for that phenomenon partly produced conflicting evidence or could not be verified (Seeber and Remmele, 2008). Possible explanations, among others, include test design – ‘… female subjects usually perform worse on multiple-choice-tests’ which also could be disproved (Seeber and Remmele, 2008: 6) – and underlying mathematical skills (Hirschfeld et al., 1995). On the other hand, ‘… attitudes in respect of economic matters and test performance’ seem to be a reliable explanation for resulting gender gaps (Seeber and Remmele, 2008: 6) because (1) male participants ‘… show a more positive attitude …’ (Beck, 1993: 95; Hirschfeld et al., 1995: 8) and (2) female participants display an aversion or even ‘… total disinterest …’ to economic subjects (Würth and Klein, 2001: 138 quoted after Seeber and Remmele, 2008: 6).
Simplified methods for quantitative economic valuation
Many real-world decision-making tasks are meaningfully addressed using quantitative methods, which model the decision-making tasks in a mathematically tractable way (a process of mathematising; Gropengießer et al., 2013). According to Gropengießer et al. (2013), there are three options for mathematising in the biology classroom: (1) quantification, (2) formalization and (3) mathematical modelling. Our approach makes use of all three options. However, we keep formal mathematic skill level as low as possible, because we (1) want to sample learners from grade 9 and (2) do not want to measure primarily mathematical competencies. As a theoretical framework, we applied the modelling cycle used by Blum and Leiss (2007; see also Borromeo Ferri, 2006). Of particular importance to this research is the retransfer of mathematical results to the real situation. This is a crucial final step in mathematical modelling, for reconnecting the model and reality (Borromeo Ferri, 2006: 93; Gropengießer et al., 2013).
Competence models for coping with SD challenges, with special emphasis on institutional and environmental economics aspects
In the last 15 years, competence research has gained great importance in many areas of educational research (Bögeholz, 2013; Eggert and Bögeholz, 2006; Klieme and Leutner, 2006; Weinert, 2001a, 2001b). An important consideration for educational research on competencies, and thus also for our research project, is that competencies can be either/both acquired through experience and learning in relevant situations or/and influenced by external interventions (Baumert et al., 2001; Klieme and Hartig, 2007; Klieme and Leutner, 2006; Simonton, 2003). According to Klieme and Leutner (2006: 880; own translation), we understand competence models as models of the structure, grading and development of a competence, which can be founded by cognitive psychology and linked with advanced psychometric techniques. In this study, we will focus on the structure of the competence model.
To cope with pressing SD challenges, we developed and investigated a competence model for socioscientific reasoning and decision-making over the last 10 years. The model comprises four competence dimensions, which we will now present. The first dimension ‘understanding and reflecting values and norms of SD’ focuses on the ethical and normative dimensions of SD (e.g. the importance of basic human needs; Bögeholz and Barkmann, 2014: 29). The second dimension ‘developing and reflecting solutions’ deals with obtaining information about real-world SD challenges as well as information processing aimed at developing ‘sustainable sound courses of action’ (Bögeholz and Barkmann, 2014: 29; Eggert et al., 2013). The third dimension ‘evaluating and reflecting solutions qualitatively’ refers not only to the ‘evaluation of pro and con arguments’ but also to ‘the weighting of decision-making criteria for informed and reasoned decision’ (Bögeholz and Barkmann, 2014: 29; Eggert and Bögeholz, 2010). In order to be able to evaluate solutions for real-world SD challenges in a quantitative way, the fourth dimension ‘evaluating and reflecting solutions quantitatively-economically’ (ERSQE; Bögeholz et al., 2014: 239) has recently been added. The model takes into account decision-making theory, suggestions for modelling financial literacy, competence research, and research on SD and ESD (Betsch and Haberstroh, 2005; Sälzer and Prenzel, 2014; for the competence model see Bernholt et al., 2012; Bögeholz and Barkmann, 2014; Bögeholz et al., 2014; Eggert and Bögeholz, 2006).
The fourth dimension includes ‘… the competence of learners to understand, mathematically model, assess and reflect on alternative courses of action by getting insights into different stakeholder perspectives including environmental and institutional economics analysis, and the essentials of SD’ (Bögeholz et al., 2014: 239). The ERSQE dimension was added recently as a result of reflection on the quantitative and economic challenges of real-world solutions, and on political instruments for problem-solving for SD. Focussing strongly on the underlying economic principles (in combination with the quantitative dimension) of real-world SD challenges is not to be equated with a ‘leaning to neoclassical considerations’ (Weber, 2015: 2). It is much more an extension of the competence model beyond qualitative argumentative skills.
The framework proposed in Figure 1 addresses the ERSQE dimension, combining the domains (1) the essentials of SD; (2) the basic economic concepts and insights, including simplified methods for quantitative economic valuation (mathematical modelling) to enable the analysis of policy instruments and (3) perspective-taking.
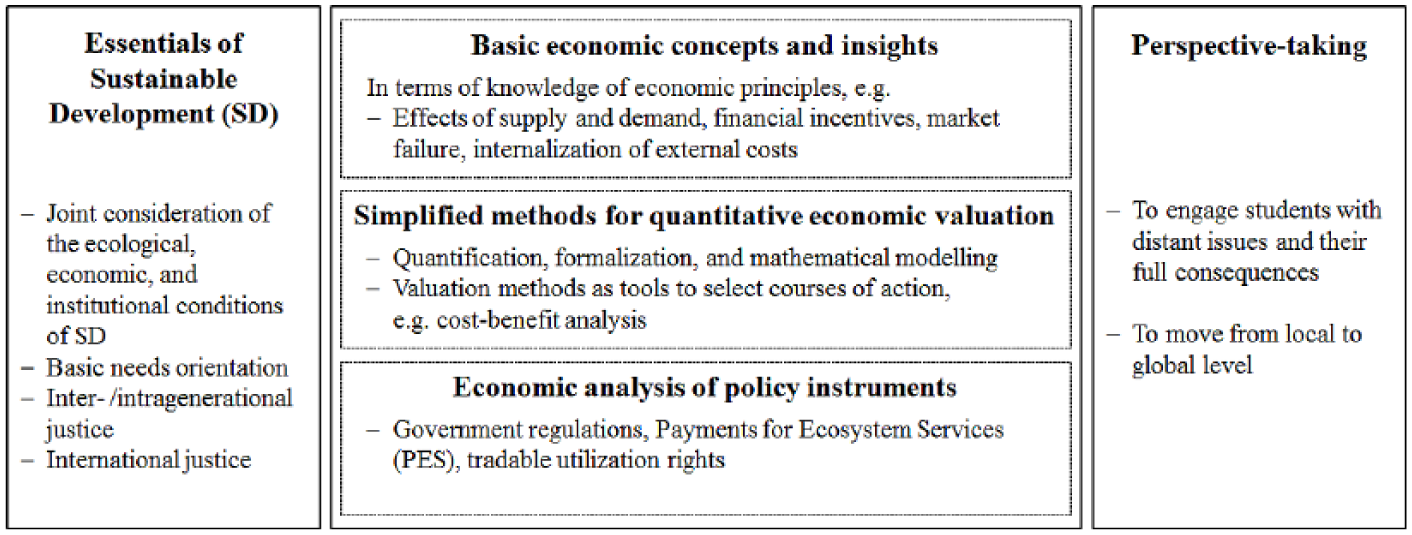
Abbreviated conceptual framework for modelling and measuring evaluating and reflecting solutions quantitatively-economically.
Research questions and hypotheses
To integrate an economic perspective into socioscientific reasoning and decision-making with respect to GCE and ESD, the construct of ERSQE has been theoretically described (Bögeholz and Barkmann, 2014; Bögeholz et al., 2014). Up to this point, however, it remains an open question whether this postulated competence dimension can be supported empirically. Thus, the first research question we take up is as follows:
Research Question 1. Can ERSQE be described on one latent continuum as a one-dimensional construct?
Given that competencies can be learned (Baumert et al., 2001; Klieme and Hartig, 2007; Klieme and Leutner, 2006; Simonton, 2003) and on the basis of the insights of earlier research with our test instrument (Bögeholz et al., 2014), we predict that grade levels (i.e. educational stages or years of education) will have an impact on how students evaluate and reflect on presented solutions quantitatively-economically.
Hypothesis 1. The grade level has an impact on the learner’s abilities with respect to ERSQE.
The second hypothesis reflects the multifaceted and interdisciplinary character of ERSQE with respect to GCE and ESD. It therefore analyses the student’s performance in subjects of importance for GCE and ESD.
Hypothesis 2. The learners’ grade average has an impact on the learner’s ERSQE abilities.
Because of the real-world contextualization of our investigation, including the underlying economic concepts and insights, the second research question addresses the often-reported gender aspect.
Research Question 2. Do gender differences affect learners’ competence with regard to ERSQE?
Methods
The empirical work in this research used a cross-sectional design. The data, gathered using a paper-and-pencil questionnaire study, were collected in summer 2015. All participants completed the test in 90 minutes or less.
Sample
The sample consisted 268 participants: 232 students from five senior secondary schools (Gymnasium) in Saxony (Germany) and 36 student teachers at a university in Lower Saxony (Germany).
The Gymnasium is an independent school. It provides pupils with appropriate abilities and educational aspirations through intensive general education, which is presupposed for a university degree. The eight-year course of studies at the Gymnasium is designed from a scientific perspective and leads to a general university entrance after central examinations (SMK, 2013: VIII; own translation).
The pupils we tested were aged from 14 to 18 years. We integrated 89 9th-graders (mean age: 15.05 years; SD: .34; female: 46), 72 10th-graders (mean age: 16.03 years; SD: .47; female: 26) and 71 11th-graders (mean age: 17.04 years; SD: 0.39; female: 37) in our study. We also administered the questionnaire to 36 student teachers (mean age: 24.36; SD: 3.0; female: 24; from the second semester of their bachelor to the sixth semester of their master of education, specializing in at least one of the following subjects: biology, politics, geography, economics). The student teachers volunteered to be tested in exchange for compensation of €10 each. Because data collection took place in the summer months, 12th-graders were in their final exams, and therefore, we did not include them in our study. Three persons were excluded from the final analysis because of extreme response behaviour (e.g. questions were not taken serious) or because they did not answer any items.
Procedure in competence research
To empirically investigate the theoretically described competence dimension of ERSQE (Bögeholz et al., 2014), we followed Wilson’s (2005) instrument development cycle for designing a measurement instrument (Eggert and Bögeholz, 2014). From theoretical reflections and the empirical data given, we developed a scoring rubric with typical levels of elaboration. Finally, we tested a measurement model for ERSQE. This article reports on the study conducted with the resulting measurement instrument.
Measurement instrument
The measurement instrument consists of (1) a booklet including general information and (2) a booklet including the questions with spaces for the written answers of the participants. We chose three exemplary contexts that can be addressed meaningfully by environmental and institutional economics methods: Land Use Conflicts in Developing Countries (seven items scored out of 18 total items in the measurement instrument), Climate Protection in the European Union (seven items) and Marine Conservation in Great Britain (four items). The contexts are conceptualized to proceed from more local to more global scenarios. The three different contexts are all relevant to the SD-related mega-problems of biodiversity loss and climate change (Pauly et al., 2002; Sala et al., 2000; UNESCO, 2015: 43; Wilcove and Koh, 2010) and also to GCE (UNESCO, 2015), in particular in terms of political decision-making in the field. For each task, a written introduction including quantitative data and graphical elements is given, followed by four to five assignments (some of them divided into two items). The measurement instrument consists of 13 assignments in all, presented in an open-ended format, suitable for assessing decision-making competence as procedural competence (Eggert and Bögeholz, 2014) as well as in terms of using the scored items with different age groups. To complete the different assignments, the participants have to apply basic economic concepts as well as mathematical modelling to analyse and reflect on pressing GC and SD challenges (Bögeholz et al., 2014). Furthermore, they have to take a perspective on and comment on presented solutions to current challenges, that is, they have to reflect on political decision-making (see Figure 1).
To avoid position effects of any kind (Rost, 2004), we varied the order of the contexts systematically (Frey et al., 2009). Thus, we administered six different versions of our measurement instrument, completely varying the Land Use, Marine Conservation and Climate Protection contexts (see Table 1). Each of the three contexts has its own structural profile because (1) we wanted to present a wide range of tasks (explorative approach) and (2) the contexts differ in the relative difficulties of their underlying economic settings (Bögeholz et al., 2014). For example, the marine conservation tasks strongly rely upon perspective-taking, whereas the climate protection tasks are constructed mainly as reflection tasks. This approach was adopted because we can easily convey the economic setting in a given answer and ask the participants to comment on these given answers (reduction of complexity). Therefore, we adopted tasks where the students had to find solutions to pressing SD and GC challenges themselves in addition to tasks where they were asked to comment on solutions. Furthermore, we designed each context to start at an easy level and increase in item difficulty over time (Rost, 2004).
Systematic ordering of the contexts.
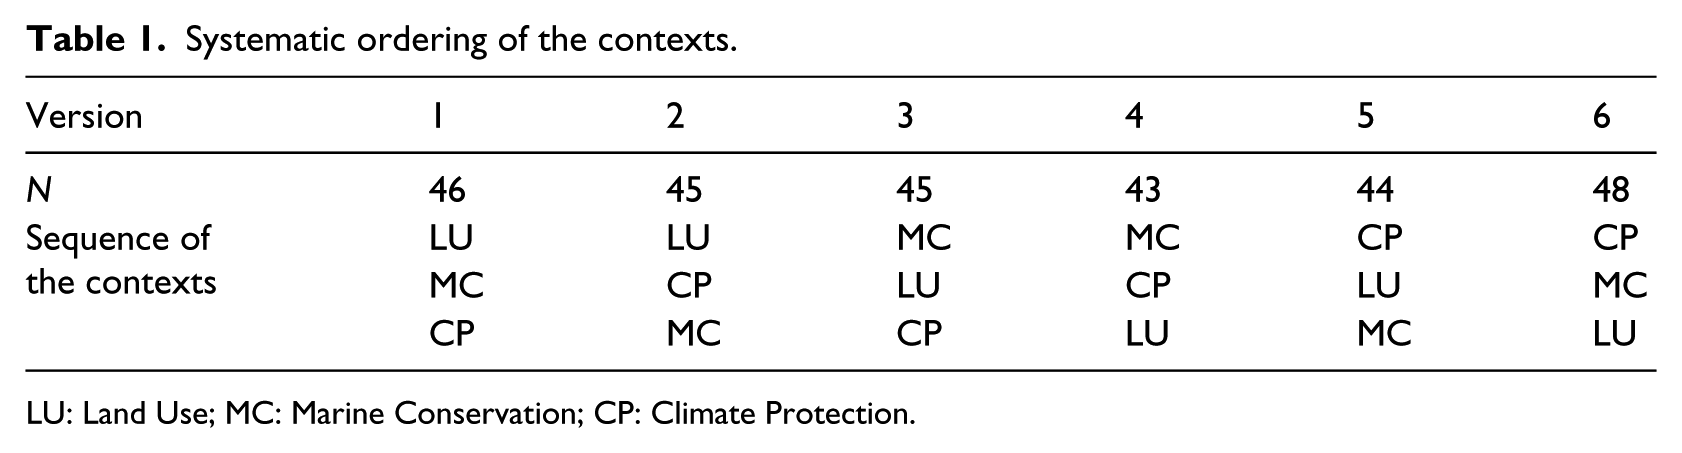
LU: Land Use; MC: Marine Conservation; CP: Climate Protection.
Scoring of student responses
ERSQE scoring builds on an approach published in Bögeholz et al. (2014) and developed further here. Of the total sample, 10% (n = 27, randomly chosen) were ‘test-coded’ to check for inconsistency in the scoring rubric and to train a second coder. All valid written answers to the open-ended questions were then coded independently by two people using a scoring rubric (see Table 2). In case of disagreement, discussion took place until agreement was reached. Inter-rater reliability with respect to the remaining 90% of the sample was found to be good (κ = .94).
Final scoring rubric for selected items from the domains essentials of Sustainable Development (item 11), basic economic concepts and insights combined with simplified methods for quantitative economic valuation (item 1, item 2 and item 17), and perspective-taking (item 8).
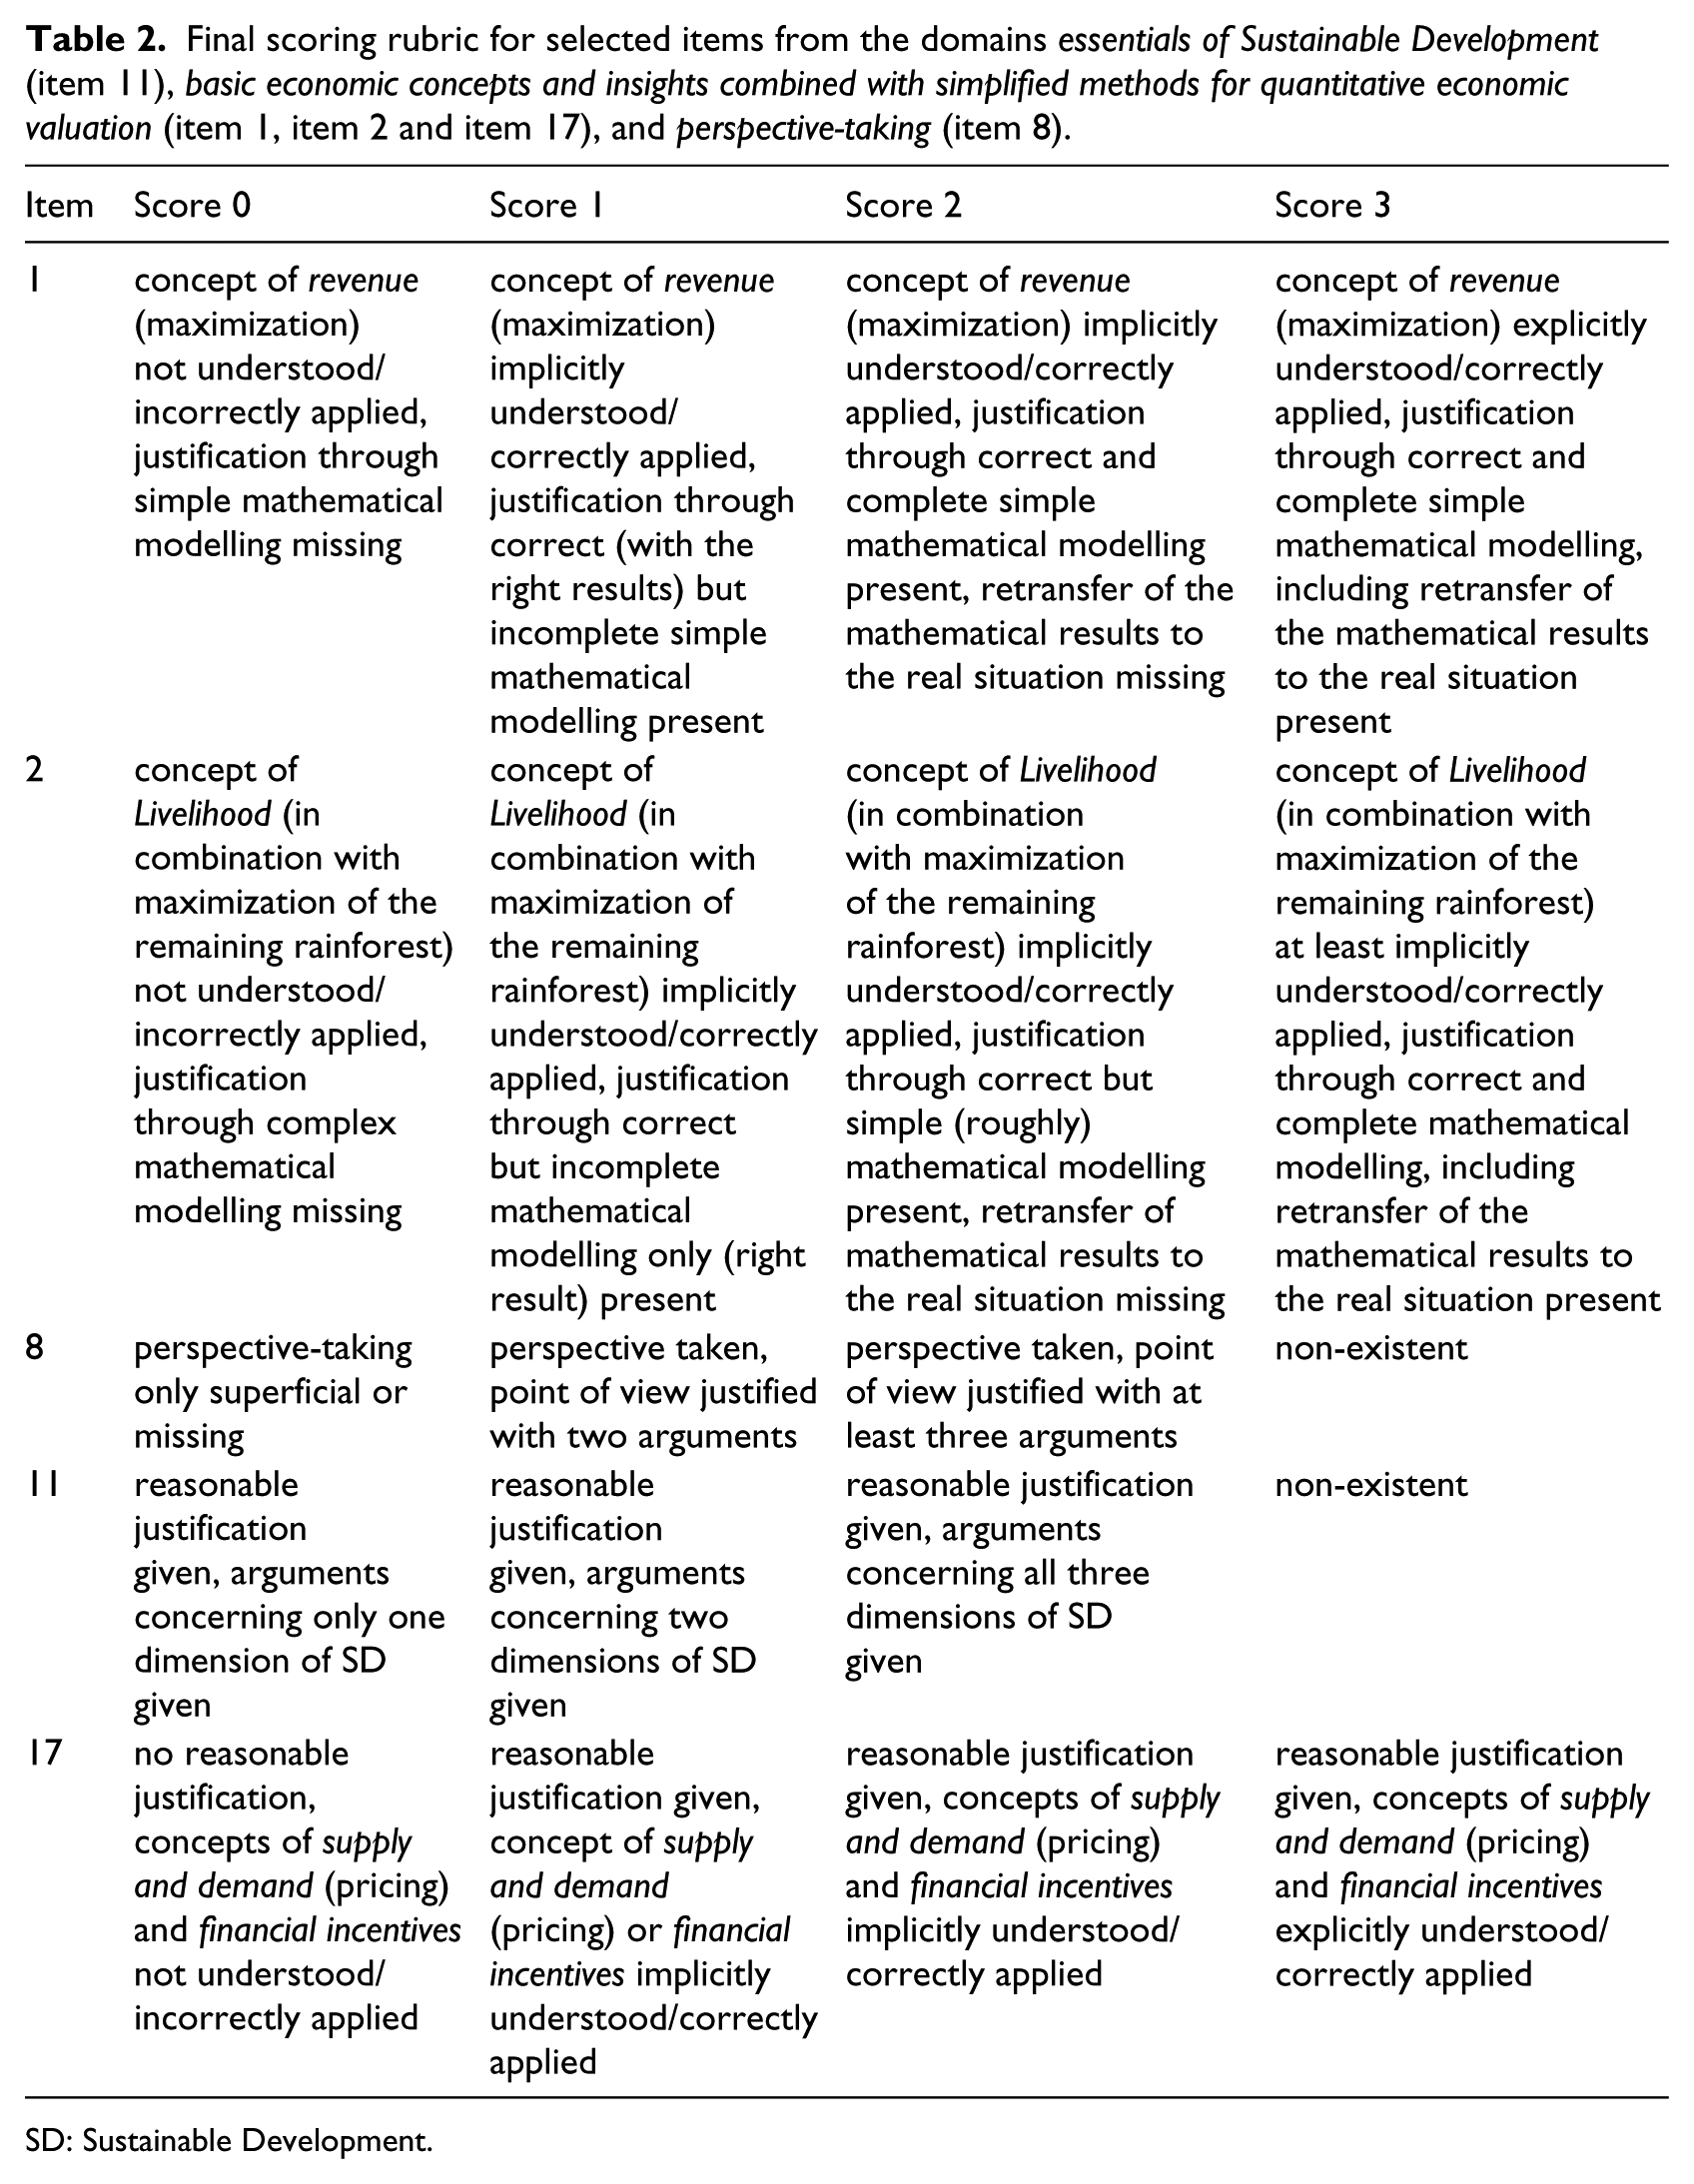
SD: Sustainable Development.
The scoring rubric (see Table 2) not only gives insights into the scoring procedure for the items of ERSQE, it also presents the domains of our conceptual framework (see Figure 1) and the corresponding items.
In the following section, we will give further insights into the scoring procedure with respect to the above-mentioned items from the domains of ERSQE (see Table 2). First, we present the assignments for each item, and second, we cite student answers with the assigned scores. First, item 1 from the Land Use context is as follows: A friend recommended the family to immediately generate the maximum revenue [from the 25 hectares land they own, by the most profitable land use option]. What revenue could the family gain? Justify your answer mathematically.
Lisa
1
(10th grade, 16 years old) gave an answer that scored 3 (see Table 2): The maximum possible revenue could be earned by the family if they use their entire land to grow maize because maize has the highest possible yield per hectare. 25 hectare * 208.4 $/ha = The family could generate annual revenue of 5210 $.
Item 2, from the Land Use context is as follows: Mayra wants her children to grow up with as much protected rainforest as possible. In regard of this fact, how could the family work the land? Justify your decision mathematically.
Anne
1
(see Note 1; 10th grade, 16 years old) gave an answer that scored 3 (see Table 2): 285 $ * 12 = 3420 $ → this is the money they need at least for their living x * 31.8 $/ha + y * 208.4 $/ha = 3420 $ x + y = 25 ha x … hectares rainforest x = 25 ha – y y … hectares farmland (25 ha - y) * 31.8 $/ha + y * 208.4 $/ha = 3420 $ [annual livelihood] 795 $ - 31.8 $/ha * y + y * 208.4 $/ha = 3420 $ |- 795 $ −31.8 $/ha * y + y * 208.4 $/ha = 2625 $ y * (-31.8 $/ha + 208.4 $/ha) = 2625 $ y * 176.6 $/ha = 2626 $ | /176.6 $/ha y = (2625 $/ha / 176,6 $/ha) = x + y = 25 ha x = 25 ha - y x = 10.14 ha In order for the family to survive, but protect as much rainforest as possible at the same time, they must convert 14.86 hectares into farmland. The remaining 10.14 hectares can stay rainforest.
Item 8, from the Marine Conservation context is as follows: Imagine you are Graig Hering, a local fisherman and owner of the largest fish factory in town. Justify your point of view concerning the designation of a marine protected area in your surroundings!
Kevin
1
(see Note 1; 11th grade, 17 years old) gained full credit (score of 2; see Table 2) for his response: A marine protected area just outside our front door would hit our domestic economy massively. Where do all the fish for our factories come from? We have to close our factory and all the jobs would be lost. Where do the people find work then? The people would have to move, and the city would thus lose their inhabitants. Can we cope with the financial loss? I say no and I am strongly against a marine protected area.
Item 11, from the Marine Conservation context is as follows: Justify why the designation of a marine protected area is a sustainable solution for the benefit of the entire city.
Malte
1
(see Note 1; student teacher, 26 years old) received a score of 2 (see Table 2) for his elaboration: The designation would benefit generated by the fact that tourism and other sectors of the economy would be supported. The ecosystem services would compensate for the cost of individual sectors. It would also have a role model: The city receives a positive image, which perhaps carries over to other regions. Fish stocks could be saved, resulting in a long-term sustainable fishing. Sustainability (social, economic and ecological) could therefore be achieved which also leads to a sustainable city (future generations).
Item 17, from the Climate Protection context is as follows: On 03 July 2013, the European Parliament agreed for a large amount of emission allowances to be temporarily withdrawn from the market. Evaluate and justify this decision.
Sandra
1
(see Note 1; 11th grade, 16 years old) gained full credit (score of 3; see Table 2) for the following response: This totally makes sense, because then less supply at the same or increasing demand exists. Thus, the price for a certificate rises, making it uneconomical for few companies to buy more certificates. The company would then be forced to modernize and thus to reduce their CO2 emissions permanently.
Data analyses
With respect to research question 1, we applied the Rasch Partial Credit Model (PCM; Masters, 1982) for data analysis, using Acer ConQuest software (Wu et al., 2007). Within Rasch analysis, raw scores – in this case derived from the scoring procedure of our instrument – are converted to logarithmic units (logits). Due to this logarithmic transformation of person raw scores as well as item difficulty raw scores, both can be displayed on one unidimensional logit scale (Boone et al., 2014: 114; see Figure 2). This logit scale is also often called a Wright map (Boone et al., 2014: 114; see Figure 2). Wright maps represent a solid starting base for the evaluation of an instrument functioning (Boone et al., 2014; Boone and Scantlebury, 2006). They give valuable insights into (1) the ordering of items and the space between items, (2) person abilities and item difficulties (and whether they match the predictions) and (3) items that measure the same construct; thereby, they provide information about (4) which items could be removed and (5) possible item gaps in the map meaning that there are no items measuring particular parts of the construct (Boone et al., 2014).
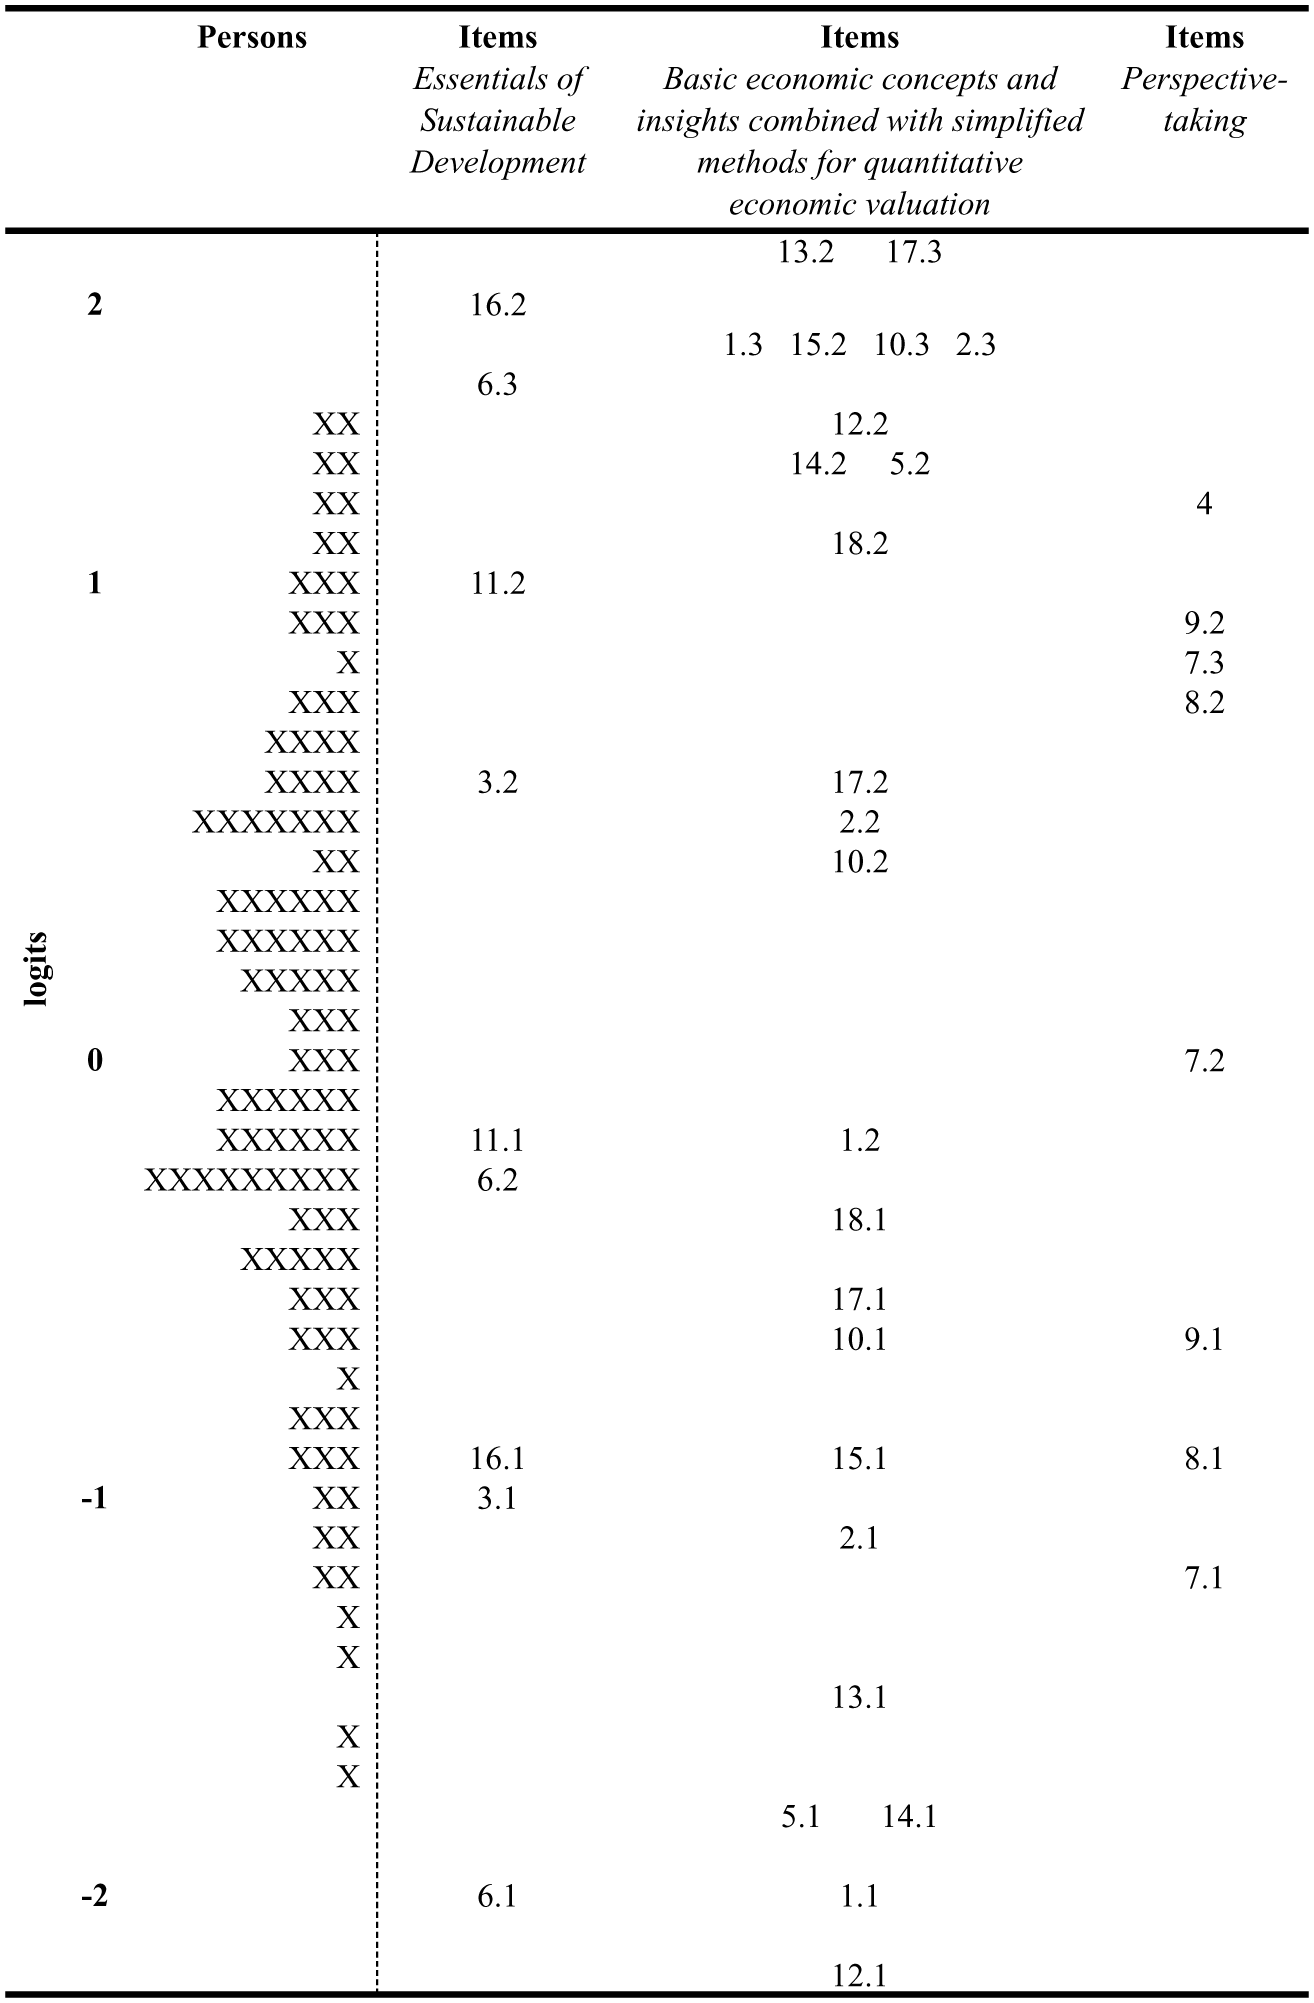
Wright map for the dimension evaluating and reflecting solutions quantitatively-economically. The labels for the thresholds show the levels of the items and item steps, respectively. Each ‘x’ represents 2.3 persons.
In addition to Rasch analysis, we carried out classical statistical analyses using IBM SPSS Statistics (version 23). For example, we conducted one-way analysis of variance (ANOVA) to test hypotheses 1 and 2. For research question 2, we calculated an average grade for each student, out of the grades for biology, mathematics, German, ‘Civics, Law, and Economics’ (in German, Gemeinschaftskunde, Recht, und Wirtschaft, which is the name of the integrated economics and political course in Saxony), and geography. We used these specific subject grades to calculate the average grade because they are important for GCE as well as ESD.
We only included students who had earned at least grades for three of the mentioned subjects. In view of this, we had 187 (mean age: 15.74 years; SD: .83; female 90; male 97) students in our sample for the analysis of the influence of the grades; student teachers were not included. We categorized the pupils (9th-, 10th- and 11th-graders) into three groups by average grades: group 1, very good, included all students with an average grade (note that 1 is the best grade in Germany) better than 1.5; group 2, good, included students with an average grade in the range 1.5–2.49; and group 3, satisfactory, included students with an average grade ⩾ 2.5. We ended up with 23 pupils (mean average grade: 1.33; SD: 0.13; female: 15) who were very good according to their average grade, 89 pupils (mean average grade: 2.06; SD: 0.26; female: 49) who were good and 75 pupils (mean average grade: 2.85; SD: 0.25; female: 26) who were satisfactory.
Results
Modelling ERSQE
With respect to our first research question, item-fit analysis revealed that after a few adjustments had been made (see below), the 18 items used fit the requirements of the Rasch PCM (Masters, 1982).
In more detail, no adjustments had to be made for items 1, 3, 6, 12, 13, 14, 15, 17 or 18. For four items, two adjacent scores had to be collapsed because thresholds did not increase in difficulty (items 4, 5, 11 and 16). Consequently, these items were reduced from five response categories to four (item 16), four response categories to three (items 5 and 11) or three response categories to two (item 4), respectively. For five items (2, 7, 8, 9 and 10), some of the response categories were not taken up by a sufficient number of students, and thus had to be collapsed as well. Consequently, these items were reduced from five response categories to four (items 2, 7 and 10) or from four response categories to three (items 8 and 9).
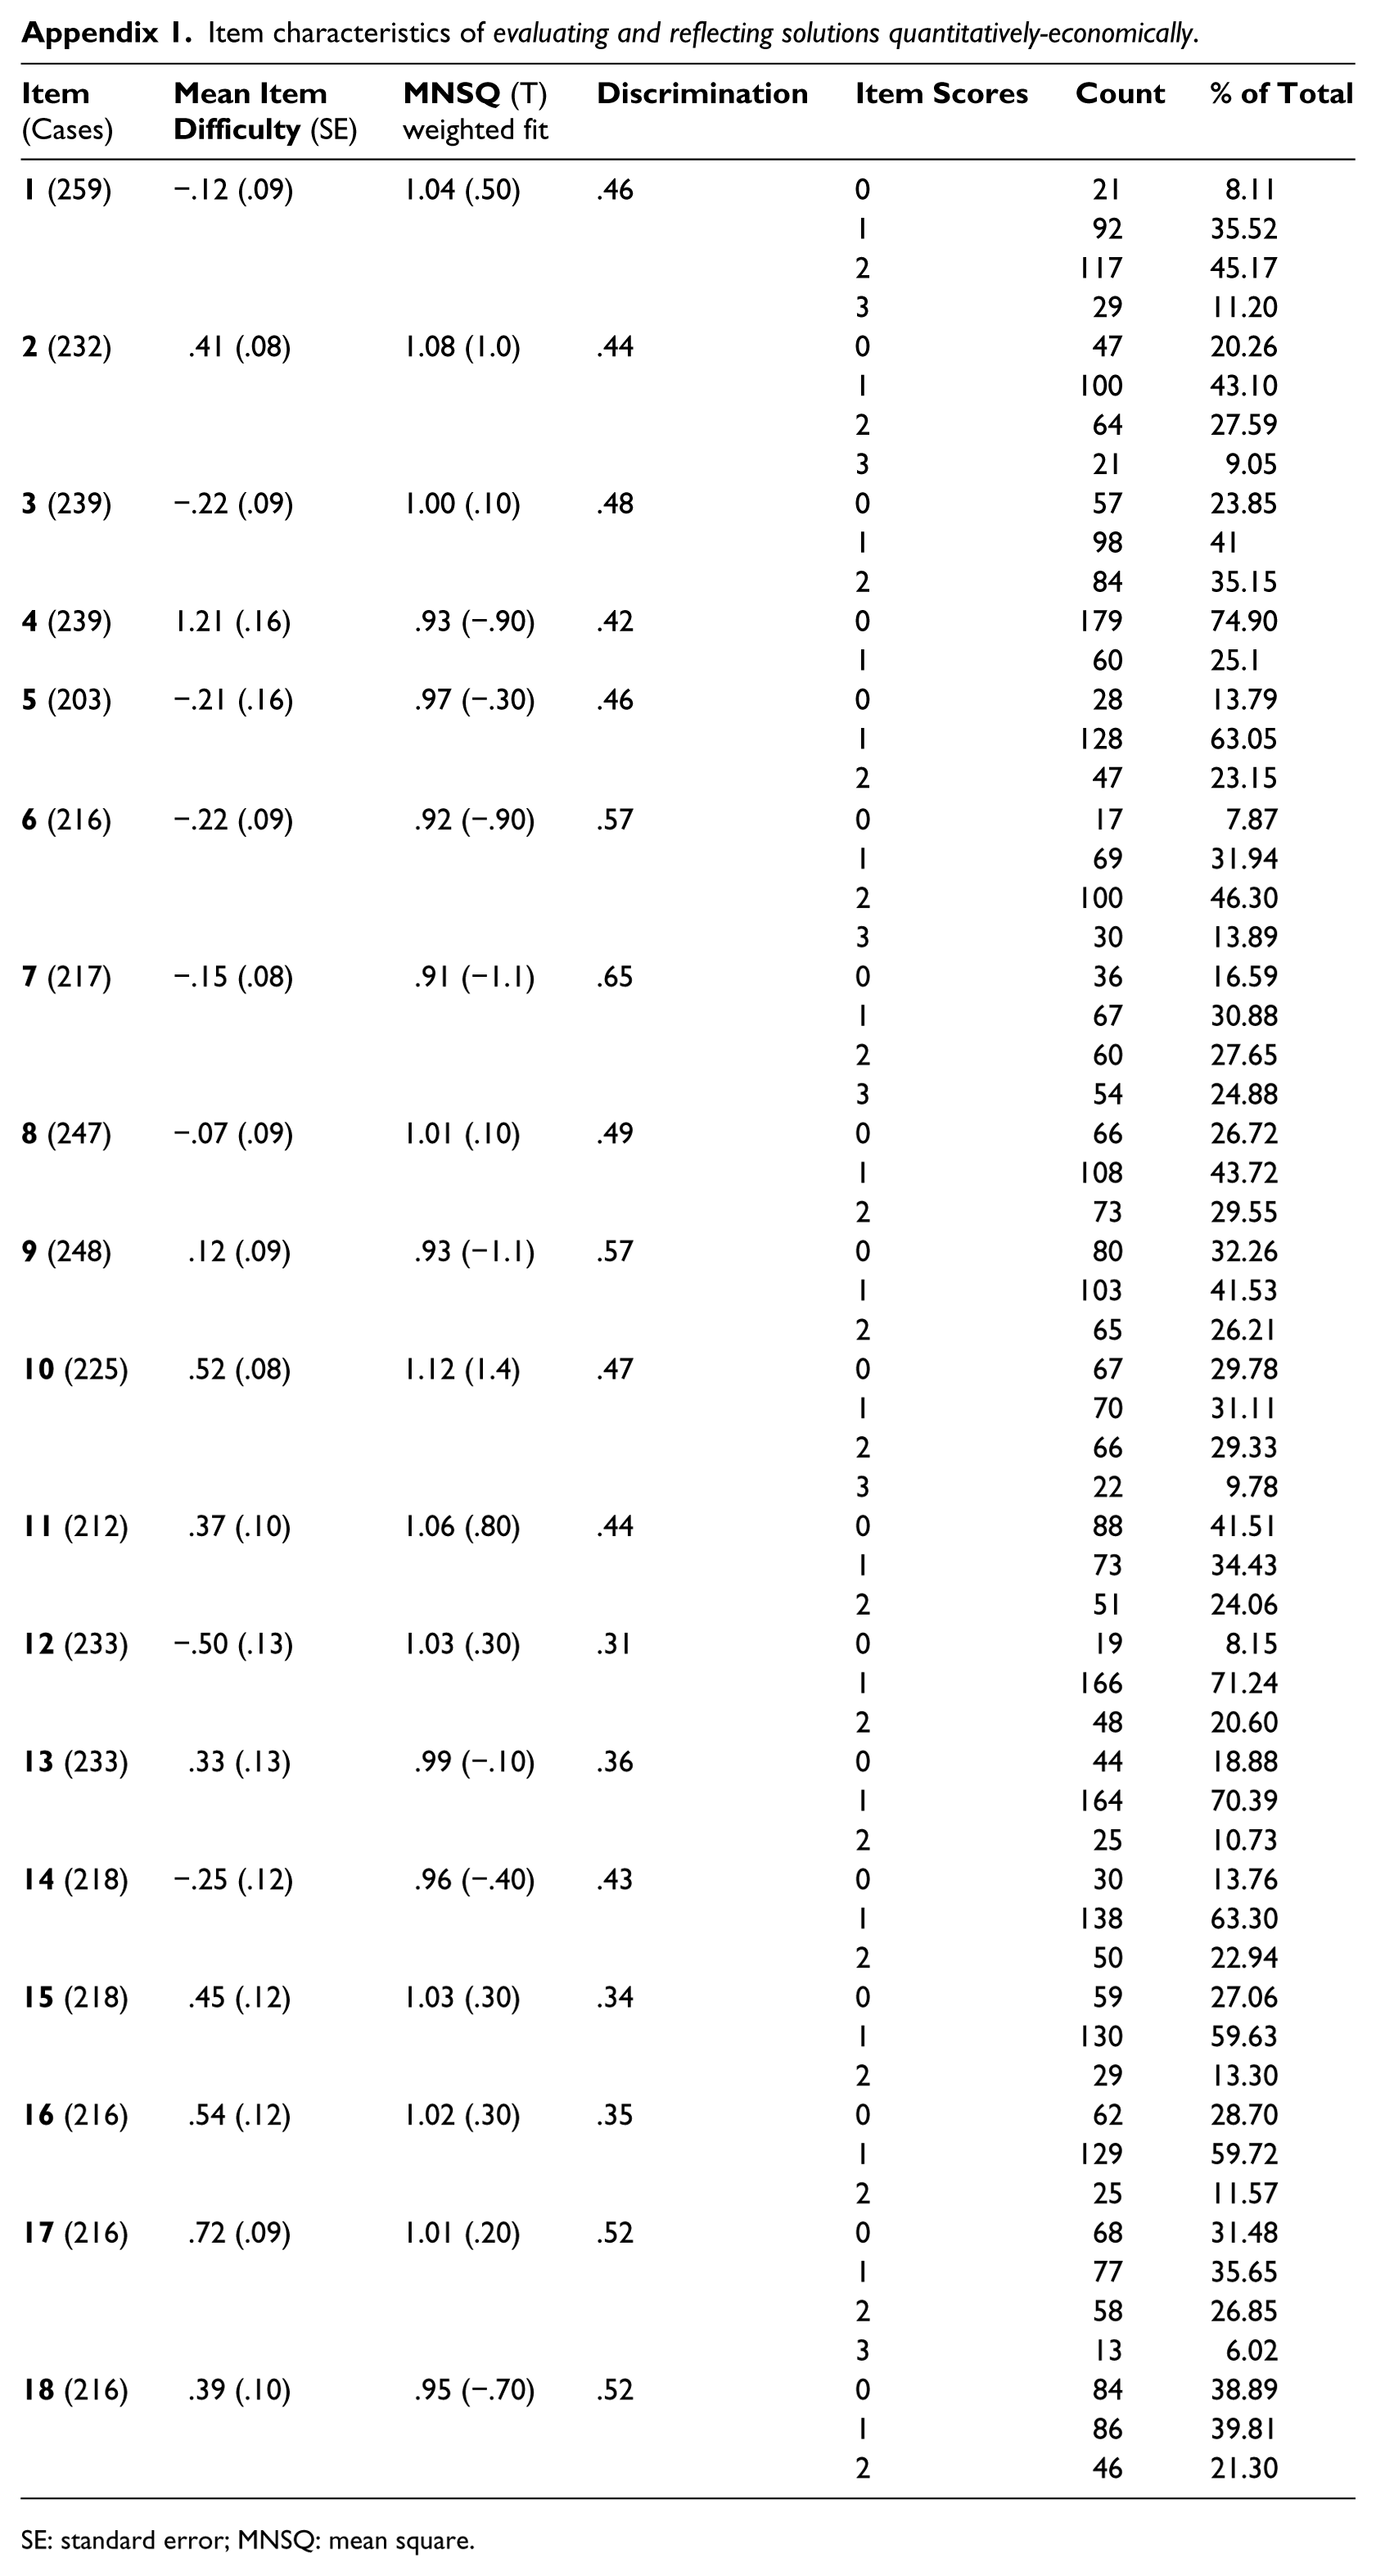
Thus, 17 of the former polytomous 18 items remained polytomous, while one became dichotomous (item 4). Final analyses showed that all item-fit values (using the weighted mean square (WMNSQ); Appendix 1) were within the acceptable boundaries (0.75–1.25; Wu et al., 2007). Traditional item discrimination indices identified no item with a value <.25 (Appendix 1). Person separation reliability, using Warm’s (1989) Weighted Likelihood Estimation (WLE), was found to be satisfactory, at .69, and also the corresponding Cronbach’s alpha value (α = .71). Item separation reliability was found to be good at .94.
For the Wright map of ERSQE (see Figure 2), generated from the Rasch analysis, we assigned the items to different components of the ERSQE framework (see Figure 1): essentials of SD (items 3, 6, 11 and 16), basic economic concepts and insights combined with simplified methods for quantitative economic valuation (items 1, 2, 5, 10, 12, 13, 14, 15 and 17), and perspective-taking (items 4, 7, 8 and 9). With consideration for our approach to ERSQE, most items include basic economic concepts and insights combined with simplified methods for quantitative economic valuation.
Within the Rasch analysis, raw scores (Table 2) are typically converted to logarithmic units – which are also called logits (Boone et al., 2014). Within our analysis, logit values range from −2.43 to 2.16 (Figure 2). Persons or items that are located at the base of a map exhibit low person ability or low item difficulty. Persons or items that are located at the top of the map exhibit high person ability or high item difficulty (Eggert and Bögeholz, 2010: 241).
In addition, as we used polytomous items, the Wright map shows all item steps with respect to the 18 items analysed. The item steps represent the thresholds from one score for an item to the next best score of the same item (e.g. for item threshold 2.3 in Figure 2 compare the scores 2 and 3 for item 2 in Table 2).
On the Wright map, persons who are on the same level as an item or an item step, solve this item (or gain this item step) with a probability of 50%. Accordingly, they solve items or item steps (1) that are below their own position with a probability higher than 50% and (2) that are above their own position with a probability lower than 50%.
In Figure 2, the item steps at the upper end of the map, where no persons are on the same level, show that there are no persons accomplishing this item step correctly with a probability of 50% or more. These item steps are focussing on (1) the complete (explicitly mentioned) and correct integration of economic insights and concepts (e.g. item step 17.3 in Figure 2 and Table 2) for correct integrated use of simplified methods of a quantified impact analysis (e.g. item step 1.3 in Figure 2), or on (2) the equal consideration of the essentials of SD (e.g. item 11 or item step 16.2 in Figure 2 and Table 2).
Items which strongly focus on perspective-taking (e.g. item 8 in Figure 2 and Table 2) or ‘intermediate gradations’ (e.g. unequal or incomplete consideration/integration) of the above-mentioned (e.g. items 8 and 9 in Figure 2 and Table 2) are less difficult. ‘Intermediate gradations’ are answers where (1) basic economic concepts and insights were not applied properly (e.g. only addressed implicitly or understood falsely), (2) the mathematical modelling was incomplete or false (e.g. missing retransfer to the real situation; see item steps 1.2 and 1.3 or 2.2 and 2.3 in Figure 2) or (3) target dimensions of SD were only considered partially (see Table 2).
With regard to the simplified methods for quantitative economic valuation, the Wright map clearly differentiates between items including relatively easy mathematical modelling (see item 1 in Figure 2 and Table 2) and items including more complex mathematical modelling (see item 2 in Figure 2 and Table 2). The results also show differences in the complexity of the underlying basic economic concepts. For instance, the concept of revenue (item 1) and that of financial incentives (item 5) were processed correctly more often than the concept of market failure (item 15). Also, items where two economic concepts had to be considered to get the high score can be found in the upper range of the Wright map, for instance item step 17.3, where the effects of supply and demand and of financial incentives had to be combined (see Figure 2 and Table 2).
In item difficulty, items including perspective-taking differences are clearly visible with regard to the number of perspectives that have to be considered simultaneously: one perspective (item 8, the initial perspective is the one given in the context), two different perspectives (item 9), or three different perspectives at the same time (item 4).
The influence of grade level on ERSQE
To address hypothesis 1, we conducted a one-way ANOVA to examine possible differences regarding student performances on ERSQE between grades. Findings indicate differences between the different school grades (F(3, 264) = 24.89, p < .001, partial η2 = .22). Post hoc Games-Howell tests revealed significant differences between 9th-graders and 10th- and 11th-graders as well as student teachers (ps < .001). The 10th-graders only differed significantly from the 9th-graders and student teachers (ps < .001), that is, no significant differences could be found between the 10th-graders and 11th-graders, who also differed significantly from the 9th-graders and from the student teachers (p < .001).
The influence of performance in GCE and ESD relevant subjects on ERSQE
To address hypothesis 2, we conducted a one-way ANOVA to examine differences in ability between the respondents assigned to very good, good and satisfactory average grade categories. Results indicated significant differences (F(2, 184) = 8.79, p < .001, partial η2 = .09). Post hoc Games-Howell tests revealed significant differences between very good and good pupils (p < .01) as well as between very good and satisfactory (p < .001). No significant difference could be found between good and satisfactory pupils.
The influence of gender on ERSQE
On average, female students (M = .08, standard error (SE) = .73) performed a little better with respect to ERSQE than male students (M = −.08, SE = .82). However, this difference was not significant, t(262) = −1.65, p > .05, and did not even represent a small effect. The situation is similar for the 9th-, 10th- and 11th-graders as well as the student teachers (see Table 3).
The influence of gender on ERSQE.
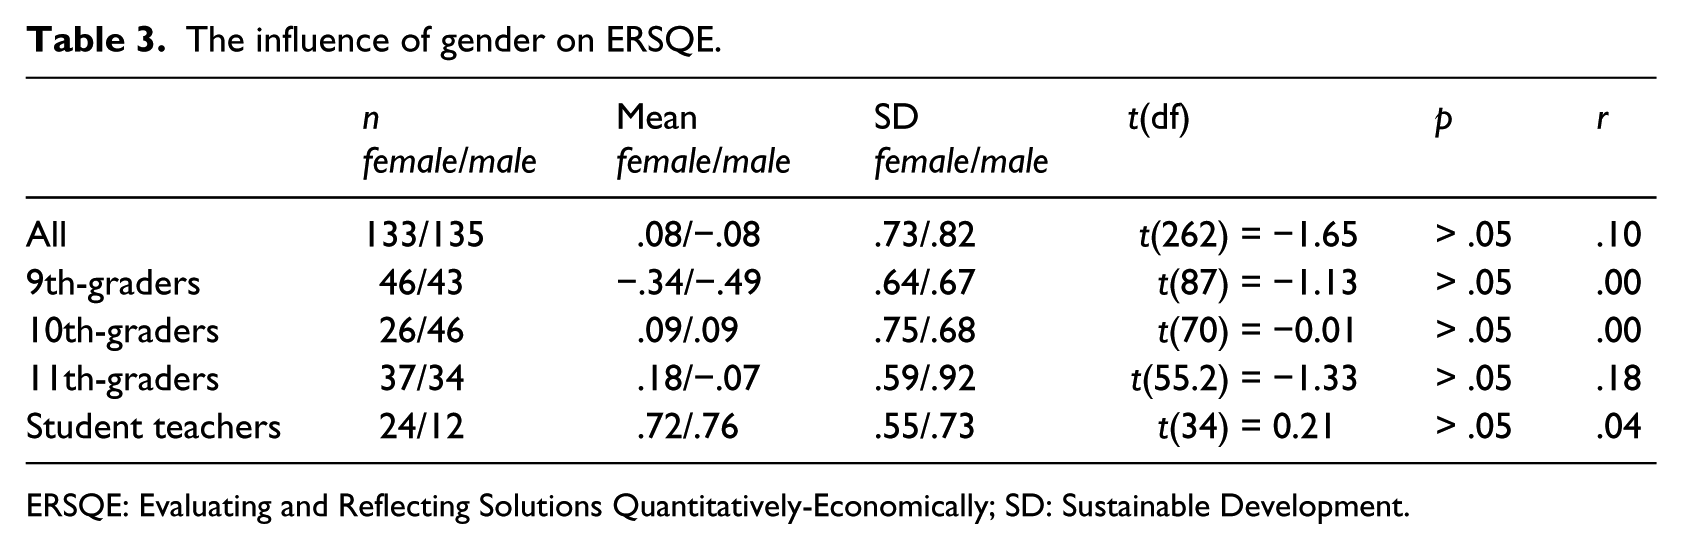
ERSQE: Evaluating and Reflecting Solutions Quantitatively-Economically; SD: Sustainable Development.
Discussion
To sum up the results, ERSQE could be successfully modelled with the PCM. Reliability and first validity investigations give support for a one-dimensional competence scale. The fit values reveal that the PCM fits with the data collected.
The Wright map, in combination with the scoring rubric (see Figure 2 and Table 2), clearly shows that the required consideration of economic concepts and insights is quite difficult to achieve. The perspective-taking items are less difficult but get more difficult with the number of perspectives (or interests) that have to be considered at the same time. For example, in item 8, students were asked to take the perspective of a local fisherman and to justify his point of view towards the designation of a marine protected area (see section Scoring of the student responses in the Methods), whereas in item 9 (same context), the students have to take the perspective of a local hotel owner and environmentalist (whose interests conflict). Because of this conflicting interest within item 9, it seems to be a little bit more difficult compared to item 8.
Returning to hypothesis 1, we find that grade level have a strong effect on the student ability to evaluate and reflect solutions quantitatively-economically. This is in line with the premise that competencies can be learned (Baumert et al., 2001; Klieme and Hartig, 2007; Klieme and Leutner, 2006; Simonton, 2003). The results with respect to hypothesis 1 are also in line with the fact that the school subject of ‘Civics, Law, and Economics’ begins in 9th grade in Saxony. Additionally, Seeber and Remmele (2008: 13) state that factors such as cognitive development and educational effects influence economic competence and that ‘… test persons have to reach a cognitive level allowing them to understand complex economic phenomena; this leads to the conclusion that the students should be older than 15’. Additionally, Literature in the field of mathematical modelling reports that the different steps within a modelling process can be potential cognitive barriers (Vorhölter et al., 2014).
In Saxony, the subject ‘civics, law, and economics’ start in 9th grade, and before entering 11th grade, pupils decide whether to continue in this area. This might explain why no significant difference could be found between the personal abilities of 10th- and 11th-graders. Due to the identical federal state curricula of Saxony, all schools have the same reference framework. Differences concerning the prior economic knowledge of the pupils occur, for example, because of different teachers witch different teacher educations, different extracurricular economic related influences (e.g. parents, media) as well as different social backgrounds.
Although grade level had a strong effect on student performances on ERSQE and most of the basic economic concepts and insights (principles like effects of supply and demand or market failure) were known by 10th-graders (SMK, 2013), even older students had problems achieving high scores for items requiring economic insights and use of economic concepts, as well as ‘essentials of SD’ (equal consideration of all three domains) and mathematical modelling (retransfer). That is in line with our assertion that economic insights should be made an integral compartment of ESD and GCE.
As for hypothesis 2, a strong effect of the average grade on ERSQE was found. Pupils with an average grade of very good in subjects relevant to ERSQE outperformed pupils with an average grade of good or satisfactory in these subjects. However, these results remain limited, in that (1) we did not control for age (small subsamples) and (2) the possibility that a high grade in at least one subject could compensate for lower grades in the other subjects. This possibility is especially relevant for the good and satisfactory groups. Regardless, it is plausible that very good students would show solid performance in ERSQE.
With regard to research question 2, we think that the contextualization of the economic insights and concepts as well as the relatively easy mathematical modelling, which had to be employed by students, led to equal ERSQE performance. These results are also in line with some literature in the field of economic competencies, which also found no gender differences (Macha and Schuhen, 2013).
Limitations and outlook
Limitations of this study that should be kept in mind are (1) the small sample size, (2) the fact that we did not test ERSQE in terms of dimensionality and (3) the fact that up to the present, no vintage-based analysis on the effect of Differential Item Functioning (DIF; Boone and Scantlebury, 2006) has taken place. We will address these limitations in our future research. Specifically, we will use a bigger sample to secure evidence on ERSQE; also, we will check if ERSQE – as a quantitative evaluation of solutions for pressing SD issues – turns out also to be an independent sub-dimension of decision-making towards a qualitative evaluation of solutions to pressing SD challenges (in terms of dimensionality). In more detail, we will check DIF and, therefore, if our test instrument can in fact be used among different age groups and genders (Eggert and Bögeholz, 2010).
Up to now, the presented ERSQE model has focussed on cognitive competencies only. However, the abilities involved in this complex construct are likely to be influenced by other factors, such as attitudes and values. In ESD, for example, the values underlying SD are of great importance. As asserted in the combined model on economic competencies (Seeber et al., 2012) and argued by Beck (1998; inter alia), attitudes need to be considered as well. One reason is that the formation and application of economic competencies can be hindered or prevented by negative attitudes towards economics (Beck, 1998: 87; Bögeholz and Barkmann, 2014: 28). Furthermore, it is widely acknowledged that competencies combine declarative knowledge, procedural knowledge, skills, regulation components and beliefs (Klieme and Hartig, 2007). This is further supported by what we know from the field of psychology: ‘… cognitions like environment-specific control beliefs, ecological responsibility attributions, environmental justice appraisals and environment-specific moral emotions, such as indignation about insufficient sustainable political decision-making, are the most powerful predictors for sustainable behaviour’ (Kals and Maes, 2002: 97).
Thus, the future research should take this multifaceted nature of economic competencies into account.
Conclusion
In this article, we aimed to highlight the need for a mature and responsible citizen to have compatible economic competencies. To do so, we empirically supported the proposed competence dimension of ERSQE, concerning economic competencies contextualized for real-world GC and SD challenges. The findings advocate the recognition of a one-dimensional competence scale, and the measurement instrument developed and tested displays advantageous psychometric features. On the basis of the presented results, we will refine and deepen our work on the competence dimension ERSQE.
Footnotes
Appendix
Item characteristics of evaluating and reflecting solutions quantitatively-economically.
|
|
|
|
|
|||
|---|---|---|---|---|---|---|
| −.12 (.09) | 1.04 (.50) | .46 | 0 | 21 | 8.11 | |
| 1 | 92 | 35.52 | ||||
| 2 | 117 | 45.17 | ||||
| 3 | 29 | 11.20 | ||||
| .41 (.08) | 1.08 (1.0) | .44 | 0 | 47 | 20.26 | |
| 1 | 100 | 43.10 | ||||
| 2 | 64 | 27.59 | ||||
| 3 | 21 | 9.05 | ||||
| −.22 (.09) | 1.00 (.10) | .48 | 0 | 57 | 23.85 | |
| 1 | 98 | 41 | ||||
| 2 | 84 | 35.15 | ||||
| 1.21 (.16) | .93 (−.90) | .42 | 0 | 179 | 74.90 | |
| 1 | 60 | 25.1 | ||||
| −.21 (.16) | .97 (−.30) | .46 | 0 | 28 | 13.79 | |
| 1 | 128 | 63.05 | ||||
| 2 | 47 | 23.15 | ||||
| −.22 (.09) | .92 (−.90) | .57 | 0 | 17 | 7.87 | |
| 1 | 69 | 31.94 | ||||
| 2 | 100 | 46.30 | ||||
| 3 | 30 | 13.89 | ||||
| −.15 (.08) | .91 (−1.1) | .65 | 0 | 36 | 16.59 | |
| 1 | 67 | 30.88 | ||||
| 2 | 60 | 27.65 | ||||
| 3 | 54 | 24.88 | ||||
| −.07 (.09) | 1.01 (.10) | .49 | 0 | 66 | 26.72 | |
| 1 | 108 | 43.72 | ||||
| 2 | 73 | 29.55 | ||||
| .12 (.09) | .93 (−1.1) | .57 | 0 | 80 | 32.26 | |
| 1 | 103 | 41.53 | ||||
| 2 | 65 | 26.21 | ||||
| .52 (.08) | 1.12 (1.4) | .47 | 0 | 67 | 29.78 | |
| 1 | 70 | 31.11 | ||||
| 2 | 66 | 29.33 | ||||
| 3 | 22 | 9.78 | ||||
| .37 (.10) | 1.06 (.80) | .44 | 0 | 88 | 41.51 | |
| 1 | 73 | 34.43 | ||||
| 2 | 51 | 24.06 | ||||
| −.50 (.13) | 1.03 (.30) | .31 | 0 | 19 | 8.15 | |
| 1 | 166 | 71.24 | ||||
| 2 | 48 | 20.60 | ||||
| .33 (.13) | .99 (−.10) | .36 | 0 | 44 | 18.88 | |
| 1 | 164 | 70.39 | ||||
| 2 | 25 | 10.73 | ||||
| −.25 (.12) | .96 (−.40) | .43 | 0 | 30 | 13.76 | |
| 1 | 138 | 63.30 | ||||
| 2 | 50 | 22.94 | ||||
| .45 (.12) | 1.03 (.30) | .34 | 0 | 59 | 27.06 | |
| 1 | 130 | 59.63 | ||||
| 2 | 29 | 13.30 | ||||
| .54 (.12) | 1.02 (.30) | .35 | 0 | 62 | 28.70 | |
| 1 | 129 | 59.72 | ||||
| 2 | 25 | 11.57 | ||||
| .72 (.09) | 1.01 (.20) | .52 | 0 | 68 | 31.48 | |
| 1 | 77 | 35.65 | ||||
| 2 | 58 | 26.85 | ||||
| 3 | 13 | 6.02 | ||||
| .39 (.10) | .95 (−.70) | .52 | 0 | 84 | 38.89 | |
| 1 | 86 | 39.81 | ||||
| 2 | 46 | 21.30 |
SE: standard error; MNSQ: mean square.
Declaration of Conflicting Interests
The author(s) declared no potential conflicts of interest with respect to the research, authorship, and/or publication of this article.
Funding
The author(s) disclosed receipt of the following financial support for the research, authorship, and/or publication of this article: This work was supported by the German Research Foundation (grant number BO1730/5-1).