
Abstract
Pulmonary artery, capillary, and vein endothelial cells possess distinctive structures and functions, which represent a form of vascular segment specific macroheterogeneity. However, within each of these segmental populations, individual cell functional variability represents a poorly characterized microheterogeneity. Here, we hypothesized that single cell clonogenic assays would reveal microheterogeneity among the parent cell population and enable isolation of highly representative cells with committed parental characteristics. To test this hypothesis, pulmonary microvascular endothelial cells (PMVECs) and pulmonary arterial endothelial cells (PAECs) were isolated from different Sprague Dawley rats. Serum stimulated proliferation of endothelial populations and single cell clonogenic potential were evaluated. In vitro Matrigel assays were utilized to analyze angiogenic potential and the Seahorse assay was used to evaluate bioenergetic profiles. PMVEC populations grew faster and had a higher proliferative potential than PAEC populations. Fewer PMVECs were needed to form networks on Matrigel when compared with PAECs. PMVECs primarily utilized aerobic glycolysis, while PAECs relied more heavily on oxidative phosphorylation, to support bioenergetic demands. Repeated single cell cloning and expansion of PAEC colonies generated homogeneous first-generation clones that were highly reflective of the parental population in terms of growth, angiogenic potential, and bioenergetic profiles. Repeated single cell cloning of the first-generation clones generated second-generation clones with increased proliferative potential while maintaining other parental characteristics. Second-generation clones were highly homogeneous populations. Thus, single cell cloning reveals microheterogeneity among the parent cell population and enables isolation of highly representative cells with parental characteristics.
Introduction
Pulmonary endothelium is structurally and functionally heterogeneous along the artery-to-capillary-to-vein axis. 1 This macroheterogeneity among endothelial phenotypes can be resolved in vivo using anatomical determinants, including the differential expression of junctional and matrix proteins and the distribution of various organelles, such as Weibel-Palade bodies that are most prominently seen in endothelium within conduit or large vessel segments.2–4 Lectin binding has also contributed to identification of endothelial macroheterogeneity, where Griffonia simplicifolia recognizes microvascular but not extra-alveolar endothelium.5–7 Lectin binding selectivity has enabled investigators to isolate and subculture endothelial cells that retain characteristics of their in vivo function. For example, Griffonia simplicifolia-positive pulmonary microvascular endothelial cells (PMVECs) are pro-proliferative and angiogenic when compared to their macrovascular counterparts. 8 The microvascular endothelial cells also possess a more restrictive barrier to macromolecules and they are less sensitive to barrier disruption induced by neurohumoral inflammatory mediators, when compared with pulmonary artery and vein endothelial cells.9–11 In contrast, PMVECs are more sensitive to barrier disruption induced by neuraminidase(s). 12 Interestingly, these subcultured cells retain a memory of their origin, even when they are reintroduced into the pulmonary circulation. 13 Pulmonary artery endothelial cell (PAEC) infusion into an acellular lung scaffold results in repopulation of the artery and not the capillary or vein segments. In contrast, pulmonary vein endothelial cell infusion in this model results in repopulation of vein and not the arterial or capillary segments, and PMVECs are the only phenotype that repopulates capillaries. Thus, an important, stable macroheterogeneity is apparent among endothelial cells derived from artery, capillary, and vein segments.
Evidence for endothelial macroheterogeneity among vascular segments provides important insight into the integrated function of arteries, capillaries, and veins, and it also contributes to our understanding of how vascular disease manifests in discrete vascular locations.14–17 However, this large-scale heterogeneity does not inform us as to how endothelium interprets and responds to the complexity of chemical and biophysical inputs that are present within a discrete vascular segment. Studies on the endothelial response to inflammation illustrate that whereas neurohumoral inflammatory mediators induce interendothelial cell gaps, e.g. breach junctional integrity, two adjacent cells do not respond uniformly to the same stimulus. 18 These inflammatory mediators and other vasoregulatory autocoids do not induce identical intracellular signals in adjacent cells. Such a subcellular heterogeneity has been regularly reported in studies of cytosolic calcium, especially as work has moved from measurements of global cytosolic calcium to more refined studies on dynamic calcium transients, where dynamic complexity in, and the spatial constraints of, cytosolic calcium encodes unique cellular information.19,20 So, while endothelium within a vascular segment is self-similar, especially when compared to endothelium from a different vascular site, there is clear microheterogeneity that remains incompletely explored.
The relevance of cellular microheterogeneity as a determinant of endothelial growth, e.g. vessel renewal, has been considered. Schwartz and Benditt mapped constitutive thymidine incorporation in an aortic vessel wall and determined that the daily rate of endothelial replication approximates 50%. 21 However, the distribution of replicating cells was not uniform, but rather, localized to apparent niches within the vessel wall. Evidence that some vascular niches are highly proliferative whereas others are not is consistent with the idea that replication competent cells represent progenitors that reconstitute an entire hierarchy of growth potentials. Yoder utilized single cell clonal analysis to reveal niches of replication competent endothelial cells residing within a larger colony of cells.22–24 In subcultures of both circulating and tissue resident endothelial cells, Yoder et al. found a hierarchy of growth potentials among single cells, where individual cells give rise to colonies of low, intermediate, and high replication competence. Single cell sorting of the high proliferative potential colonies fully recapitulates the growth hierarchy of low, intermediate, and high replication competent progeny, suggesting high proliferative potential cells are progenitor in nature. These highly proliferative cells are also rapidly angiogenic, leading to the idea that within a vessel wall, niches of cells are diverse, where some are epigenetically encoded to renew the endothelium and others are not. 24
Mapping the distribution of progenitor cell niches in vivo has presented a challenge, especially in pulmonary circulation. Sims-Lucas et al. recently identified a population of FoxD1 positive progenitor cells within the lung and kidney mesenchyme that give rise to angiogenic endothelium during development, consistent with the idea that replication competent progenitor niches are embedded within the lung microcirculation. 25 Subcultures of PMVECs also display a hierarchy of single cell growth potentials that is characteristic of a progenitor niche, 26 similar to the work of Yoder et al.22–24 Single cell cloning of PMVECs and PAECs demonstrates an abundance of highly proliferative single cells within the microvascular endothelial cell culture. These cells utilize aerobic glycolysis to maintain rapid growth and neo-angiogenesis. 8 In contrast, PAECs grow slowly, possess a low abundance of highly proliferative potential cells within the colony, and are less angiogenic. Nonetheless, expansion of the relatively few highly proliferative potential PAECs yields a rapidly growing subpopulation that, despite their rapid growth, retains commitment to the parental endothelial cell lineage. It remains unclear whether single cell clones isolated from these fast-growing PAECs faithfully recapitulate the behavior of their parent cells. Here, we provide evidence that single cell clones from highly proliferative potential PAECs grow into homogeneous cell populations with conserved growth, angiogenic, and bioenergetic functions.
Materials and methods
Isolation of rat lung endothelial cells. Procedures for isolation of rat endothelial cells were approved by the University of South Alabama Institutional Animal Care and Use Committee. PMVECs and PAECs were isolated from male Sprague Dawley rats as previously described.27,28 Whereas PMVECs are isolated from vessels ≤ 25 µm in diameter, mostly reflective of capillaries, PAECs are isolated from the main pulmonary artery and two to three additional vessel branches.6,14,16,17 For the purposes of this study, cells were isolated from four different Sprague Dawley rats. PMVECs were isolated from two different rats and PAECs were isolated from two additional rats.
Growth curves. On day 0, cells were seeded at a density of 105 cells per well in six-well plates in DMEM (4.5 g/L glucose), 10% FBS, and 1% penicillin-streptomycin, and grown for seven days (days 1–7) without media change at 37 ℃ in room air, 5% CO2. Cells were photographed, trypsinized, and counted using a Coulter Counter (Beckman Coulter, Hialeah, FL, USA) every 24 h.
Single cell cloning. Single cell clonogenic assays were performed as described elsewhere. 22,24,26,29 Cells were trypsinized, transferred to flow cytometry tubes containing standard culture media at 5 × 10⁵ cells/tubes. Cells were typically seeded at single cell density on four 96-well plates containing 200 µL/well of DMEM (4.5 g/L glucose), 10% FBS, and 1% penicillin-streptomycin using a FACS sorter. Cells were cultured at 37 ℃ with 5% CO2-room air for 14 days without media change. On day 14, each well was examined by light microscopy to assess colony size and representative wells were photographed.
Isolation of single cell colonies. Colonies were randomly selected from 96-well plates and expanded by trypsinizing and seeding to dishes of progressively larger growth area using standard culture media and technique.
Matrigel network formation assay. Matrigel (356231, Corning) was thawed overnight at 4 ℃. On the day of the experiment, Matrigel was loaded (30 µL per well) in 96-well plates while the plates are kept on top of ice. The plates were incubated at 37 ℃ with 5% CO2-room air for 1 h. Cells were trypsinized from 10-cm dishes when approximately 70% confluent and seeded at cell type specific optimal densities (4.0–8.0 × 10⁴ cells per well), with a total cell solution volume of 80 µL per well. Cells were incubated at 37 ℃ with 5% CO2-room air for 24 h. Pictures were taken at 24 h. Images were analyzed using the “Angiogenesis Analyzer” tool, programmed in ImageJ's macro language.
Metabolic assay. Mitochondrial and glycolysis stress tests were conducted using the Seahorse extracellular flux analyzer (Seahorse XF24 analyzer, Seahorse Bioscience, MA, USA). A cartridge was loaded with calibration solution and kept overnight at 37 ℃ according to the manufacturer's protocol. On the day of the experiment, cells were seeded in 24-well plates (40,000 cells per well) in DMEM (4.5 g/L glucose), 10% FBS, and 1% penicillin-streptomycin and kept at 37 ℃ in an incubator with 5% CO2. Four hours later, cells were washed with serum-free XF Seahorse Base media supplemented with GlutaMAX 2 mM, sodium pyruvate 1 mM, and glucose of different concentrations, 25 or 0 mM for mitochondrial and glycolysis stress tests, respectively. Using the analyzer, oxygen consumption rate (OCR) and extracellular acidification rate (ECAR) were evaluated over time (0–69 min). For the mitochondrial stress test, cells were challenged with four different mitochondrial stressors, including oligomycin, carbonyl cyanide-4-(trifluoromethoxy) phenylhydrazone (FCCP), antimycin A, and rotenone 1 µM final concentration for each. For the glycolysis stress test, cells were challenged with three reagents, including glucose 10 mM, oligomycin 1 µM, and 2-deoxyglucose (2-DG) 100 mM final concentrations.
Reagents. DMEM (4.5 g/L D-glucose, L-glutamine, 11965-092 Gibco by Life Technologies), sodium pyruvate (S8636, Sigma), GlutaMAX™-I (35050-061, Gibco by Life Technologies), oligomycin from Streptomyces diastatochromogenes (O4876, Sigma), carbonyl cyanide 4-(trifluoromethoxy)phenylhydrazone (CCCP, Sigma, C2920), antimycin A (A8674, Sigma), rotenone (R8875, Sigma), D-(+)-Glucose (G8270, Sigma), 2-deoxy-D-glucose (D6134, Sigma), and dimethyl sulfoxide (DMSO, D8418, Sigma).
Statistics. One- and two-way ANOVA and Student's t-tests were used for statistical analyses, as appropriate. Bonferroni post hoc was used, as appropriate. Significance was denoted as P < 0.05.
Results
PMVECs grow faster and have a higher proliferative potential than PAECs. Previously, we
have demonstrated that PMVEC populations grow faster
8
and have a higher percentage of highly
proliferative potential cells
26
than PAEC populations. To confirm our previous findings, we repeated
growth curves and single cell clonogenic assays on pulmonary endothelial cells from four
different Sprague-Dawley rats; PMVEC 1, PMVEC 2, PAEC 1, and PAEC 2. Consistent with our
previous findings, PMVECs grew faster than PAECs in population, as evidenced by a faster
doubling time (PMVECs = 33.6, PAECs = 50.7) (Fig. 1a). PMVECs grew from 105 to
1.5 × 10⁶ cells in one week whereas PAECs grew from 105 to
1.0 × 10⁶ cells over this time course (P < 0.05). PMVECs
induced an acidic color change of phenol red containing medium, consistent with the idea
that they utilize aerobic glycolysis to sustain the ATP demands of proliferation. PAECs did
not rely on aerobic glycolysis to sustain their growth. PMVECs grow faster, have a high proliferative potential, and have a propensity to
form networks. (a) Serum stimulated growth of PMVECs and PAECs were assessed for seven
days. PMVECs grew faster than PAECs. Data represent mean ± standard deviation. One-way
ANOVA was used to assess significance over the seven-day time course and two-way ANOVA
and Bonferroni post hoc tests were used to compare between cell types. For each cell
type, two separate experiments were performed using a total of four wells. * denotes
significantly different (P < 0.05) in PMVECs vs. PAECs (n = number
of different cell types, 2 and 4 for PMVECs and PAECs, respectively).
^denotes significantly different (P < 0.05) from
baseline at day 1. (b) PMVECs and PAECs were seeded one cell per well on 96-well
plates, four plates per cell type, by FACS sorter. Plates were examined on day 14.
PMVECs had a higher percentage of medium and large colonies than PAECs. Data represent
the average of percent colony counts for each colony size. Student's
t-test was used to compare the percentages of different colony
sizes between PMVECs and PAECs. *denotes significant difference
(P < 0.05) in small colony counts (<500 cells) between PMVECs
and PAECs groups (n = 2 and 4, respectively). (c, d) PMVECs and PAECs were seeded on
Matrigel coated 96-well plates at 4.0 × 10⁴ and 8.0 × 10⁴ cells
per well, respectively. Images were obtained 24 h after seeding at 10 × magnification.
(c) Representative images are shown for each cell type. (d) Networks were quantified
by ImageJ software. PMVECs formed networks with relatively thin webs and larger
luminal areas compared to PAECs. Data represent mean ± standard deviation. Images from
three independent experiments were used for each group. Student's
t-test was used to compare two cell types. *denotes significant
difference (P < 0.05).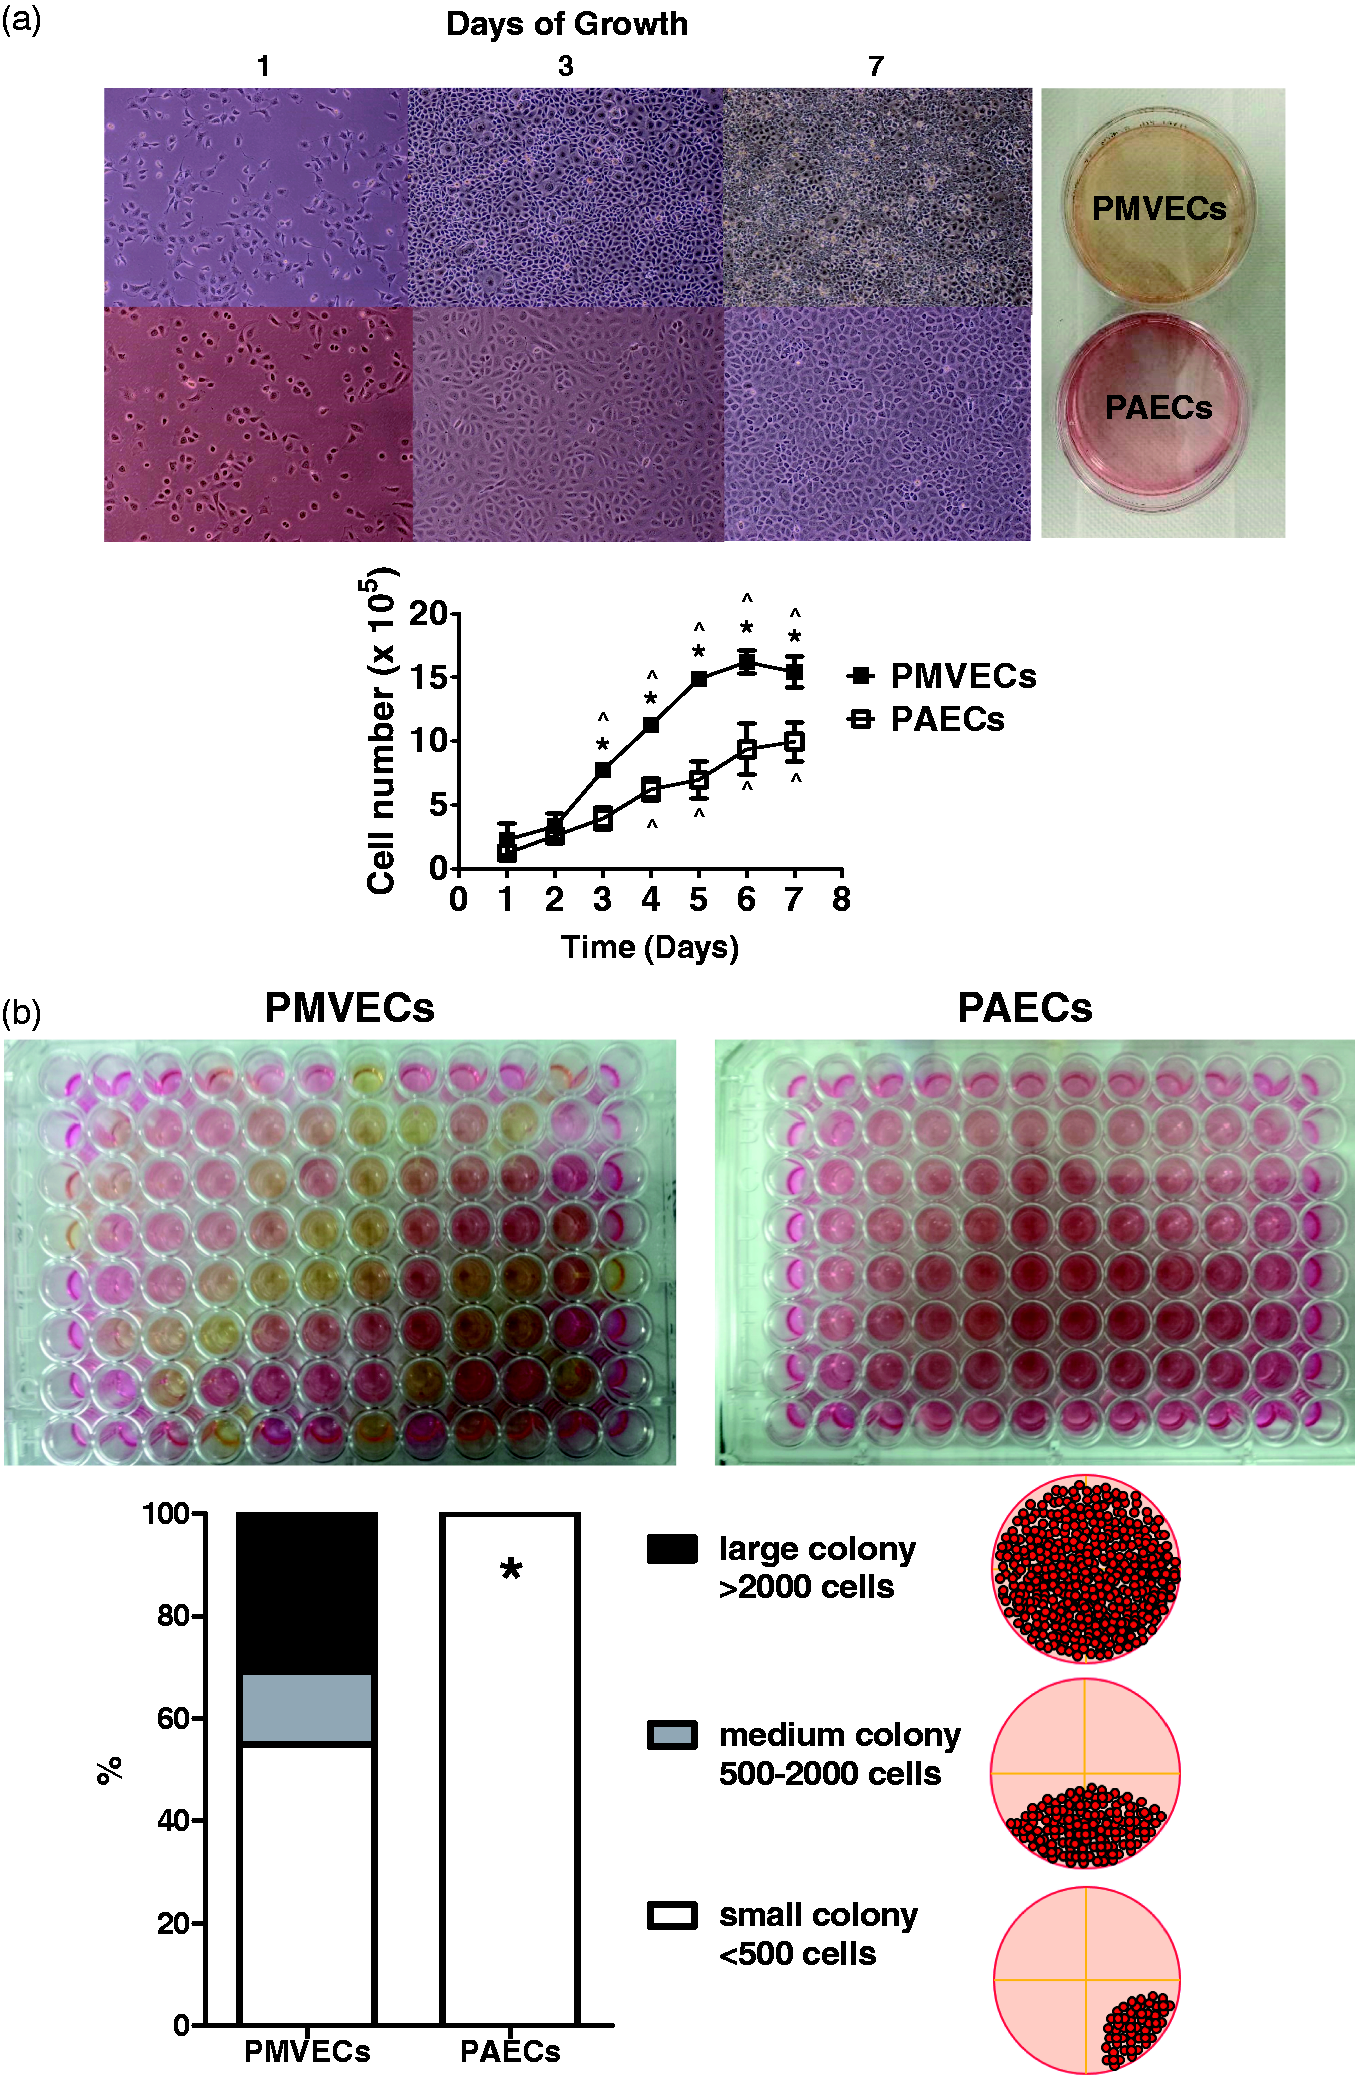
We then performed single cell clonogenic assays, where cells are seeded at a single cell density and grown for 14 days. PMVECs grew in medium- (500–2000 cells) to large- ( > 2000 cells) sized colonies, and all of these medium- to large-sized colonies acidified the medium. On the other hand, PAECs either formed small colonies (PMVECs vs. PAECs, 55% vs. 100%, P < 0.05) or did not divide (Fig. 1b). These data support the idea that PMVECs grow faster than PAECs do in population, due to a higher percentage of replication competent cells.
PMVECs and PAECs form networks on Matrigel. Angiogenic capacity is an important characteristic of endothelial cells. Our previous work has suggested that PMVECs are rapidly angiogenic when compared to PAECs. We conducted in vitro Matrigel assays, which enable assessment of network formation. PMVECs and PAECs were initially seeded at different densities, 4.0 × 10⁴–1.6 × 10⁵ cells per well, to determine an optimal number of cells required for stable network formation. Both PMVEC 1 and 2 formed stable (lasting at least 24 h) networks when cells were seeded at 4.0 × 10⁴ cells per well (Fig. 1c). However, PAEC 1 and 2 required twice as many cells, 8.0 × 10⁴ cells per well, to make equivalently stable networks. When a higher or lower number of PAECs were loaded into Matrigel, the cells either did not form closed networks or they collapsed prematurely before 24 h. Network quantification by ImageJ showed lower numbers of junctions and branches, higher branching intervals and a lower total branching length (Fig. 1d). These findings suggest that PAECs form denser networks and it supports the notion that PMVECs support rapid neo-angiogenesis. Whether this characteristic is applicable in vivo and whether it plays any role in angiogenesis of different vessel size is unclear.
Whereas PMVECs utilize aerobic glycolysis, PAECs are more reliant on oxidative phosphorylation. We have previously demonstrated that PMVECs have higher glucose consumption, proton and lactate generation, and lower oxygen consumption than PAECs, collectively suggesting PMVECs and PAECs sustain ATP demands through distinct bioenergetic pathways. 8 To determine whether our earlier findings are generalizable to cells from different individual rats, we assessed metabolic profiles of cells from four distinct rats. To confirm the specificity of metabolic parameters in relation to oxidative phosphorylation or aerobic glycolysis, we performed mitochondrial and glycolysis stress tests using the Seahorse extracellular flux analyzer. In this assay, OCR and ECAR are monitored over time as surrogate markers for the degree of oxidative phosphorylation and aerobic glycolysis utilization, respectively.
In mitochondrial stress tests, where we included 25 mM of glucose in the assay medium
throughout the experiment as a substrate for glycolysis, PMVECs showed lower OCR (PMVECs vs.
PAECs, P < 0.05) and higher ECAR (PMVECs vs. PAECs,
P < 0.05) at baseline when compared with PAECs (Fig. 2a, b). Responses to different mitochondrial
stressors, including oligomycin, FCCP, and rotenone, confirmed that higher OCR of PAECs is
from increased utilization of mitochondrial oxidative phosphorylation. Additional parameters
for mitochondrial function, basal OCR, ATP-linked respiration, maximal respiration and spare
capacity, were all lower in in PMVECs compared with PAECs (Fig. 2c). Whereas PMVECs utilize aerobic glycolysis, PAECs are more reliant on oxidative
phosphorylation, to meet metabolic demands. (a–e) PMVECs and PAECs were grown to
confluence in 100-mm dishes and the principal bioenergetic pathways were determined by
mitochondrial (a–c) and glycolysis (d) stress tests, using the Seahorse extracellular
flux analyzer. (a, d) OCR and ECAR at baseline and with mitochondrial (oligomycin,
FCCP, and rotenone) and glycolytic (glucose, oligomycin, and 2-DG) stressors are shown
over time. PMVECs utilize aerobic glycolysis whereas PAECs utilize oxidative
phosphorylation as their primary metabolic pathway. Data represent mean ± standard
error. Two-way ANOVA and Bonferroni post hoc test were used to compare between cell
types. Results from five independent experiments, each with five replicates, a total
of 20–30 wells per group are shown. *denotes significantly different
(P < 0.05) in PMVECs vs. PAECs (n = 4–5 per group). (b) OCR and
ECAR at baseline of mitochondrial stress test at three different time points are
depicted. Each dot represents the value of each individual well. (c) Basal OCR,
ATP-linked respiration (average basal OCR – oligomycin response), maximal respiration
(FCCP response) and spare capacity (maximal OCR – average basal OCR) are noted. (e)
OCR at baseline of glycolysis stress test at three different time points are depicted.
Each dot represents the value of individual well. Student's t-test
was used. *denotes significant difference (P < 0.05) between
PMVECs and PAECs groups. Each dot represents the value of individual well at each time
point.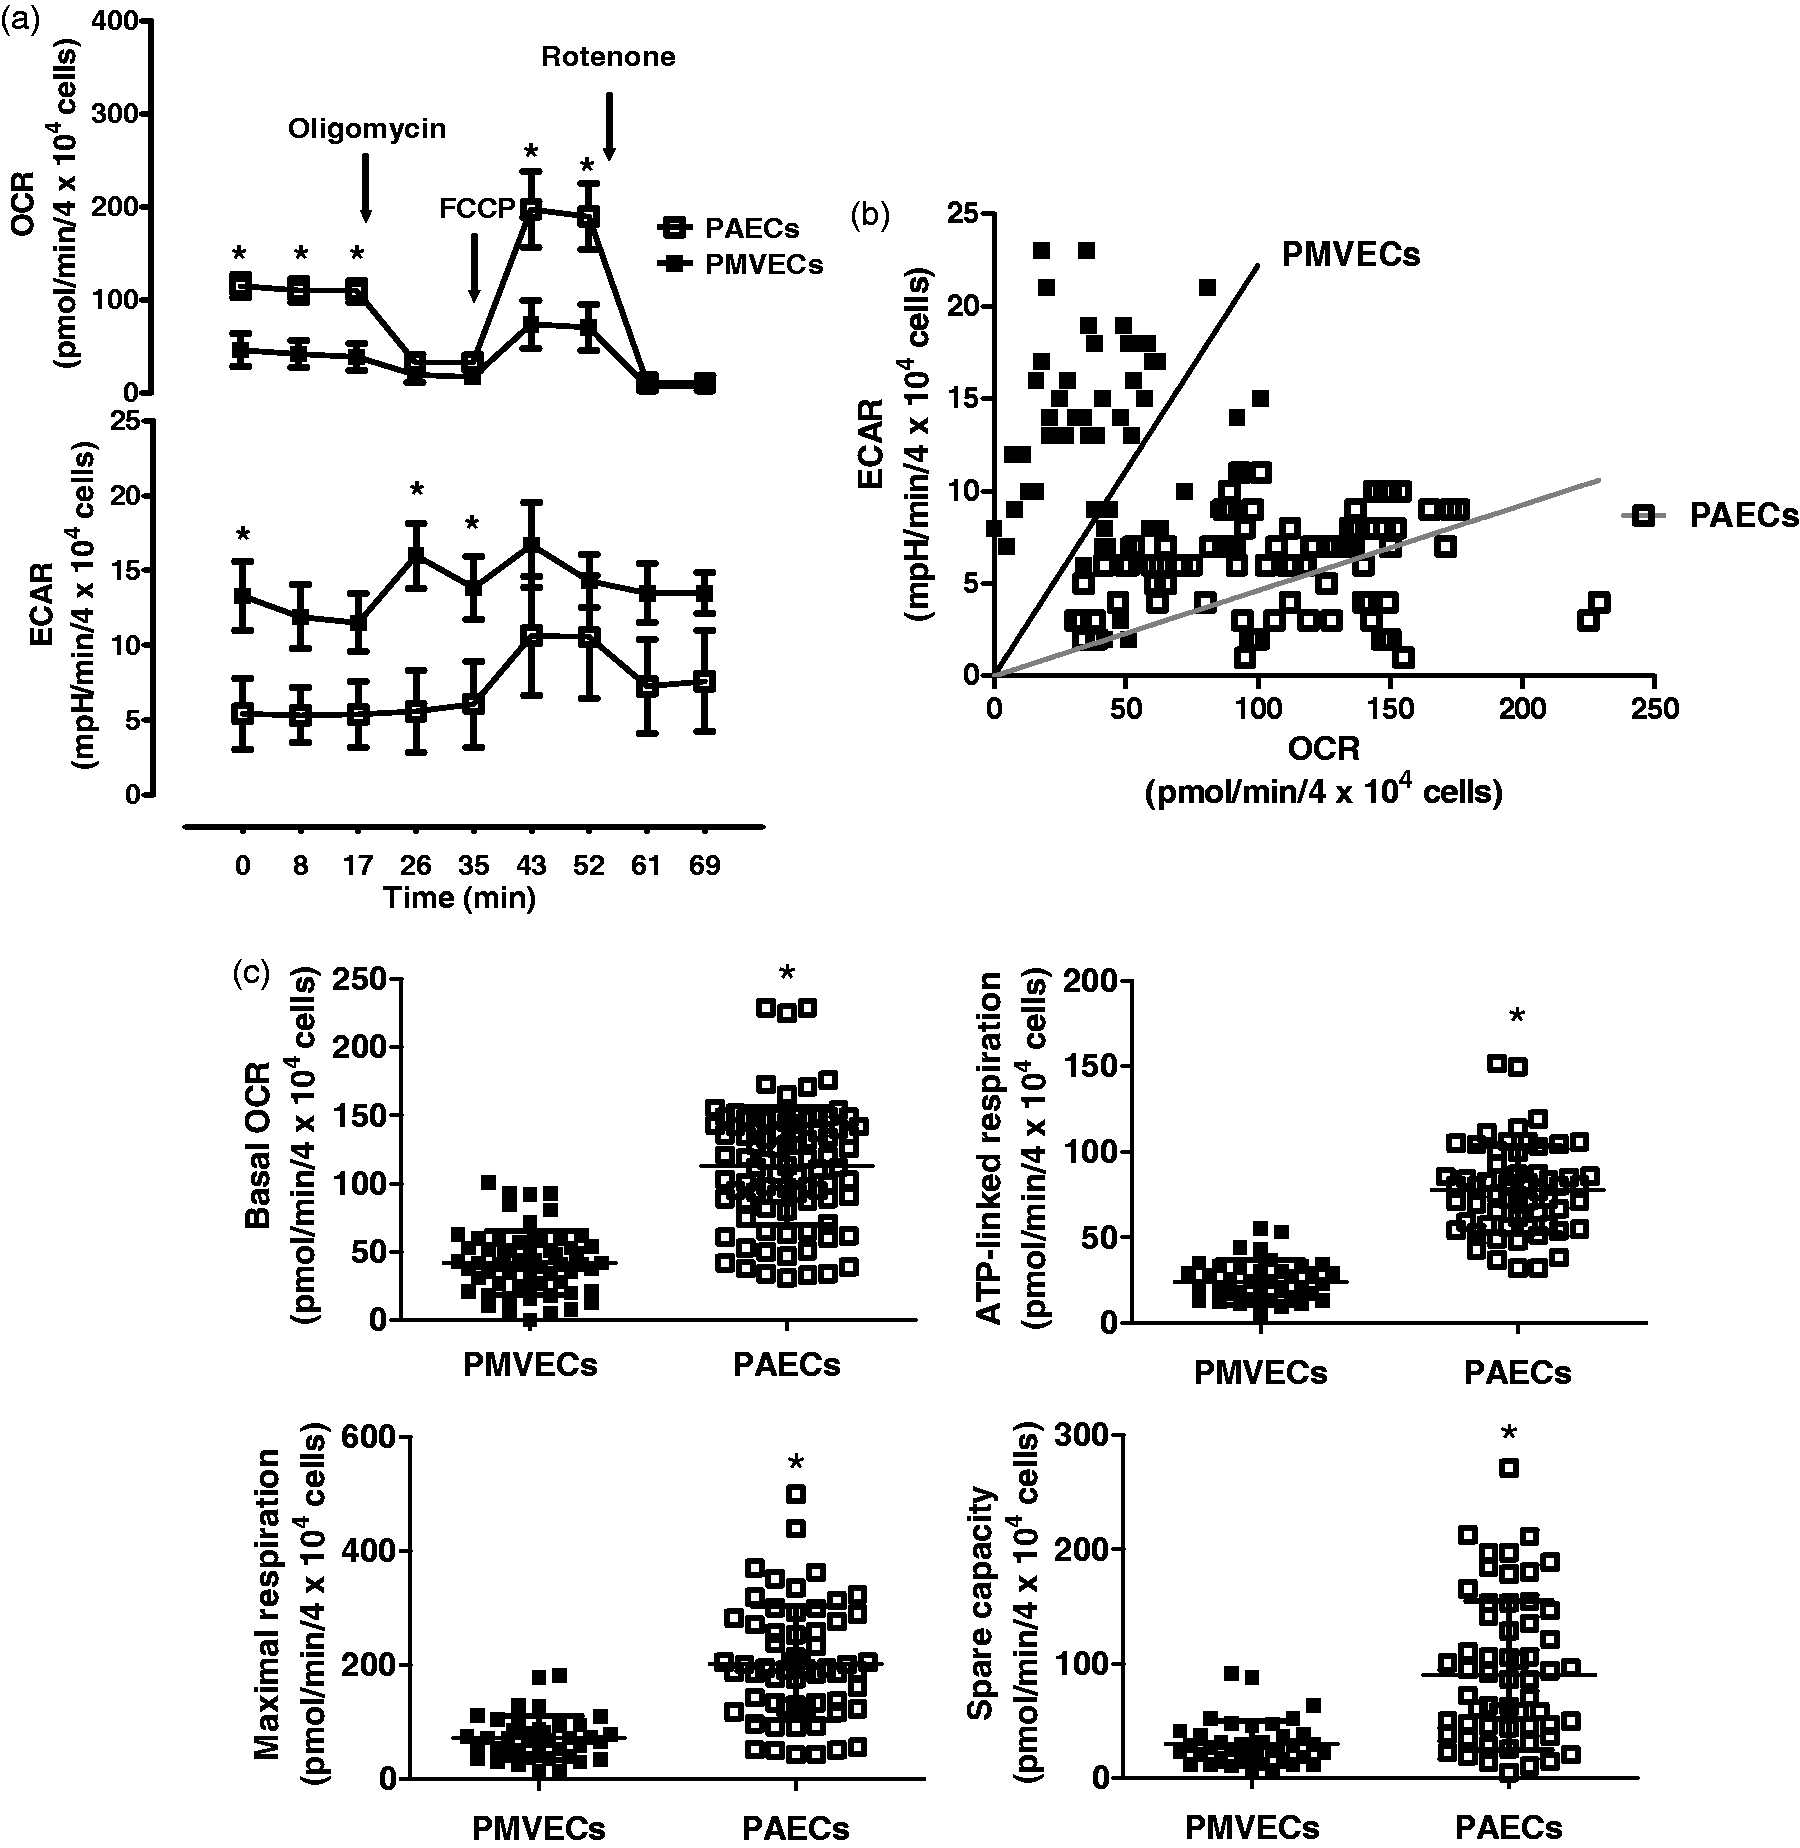
In glycolysis stress tests, where the assay media was glucose free, there was no difference in baseline ECAR between PMVECs and PAECs (PMVECs vs. PAECs, P = ns), while OCR was higher in PAECs (PMVECs vs. PAECs, P < 0.05) (Fig. 2d, e). These results suggest that PMVECs have suppressed aerobic glycolysis due to the absence of glucose as a primary substrate at baseline. Upon glucose challenge, ECAR was significantly increased to a higher degree in PMVECs, which was again suppressed by 2-DG, an ineffective substrate for glycolysis. Both groups had little glycolytic reserve, which is represented by the difference between glucose induced and oligomycin induced ECAR changes. Thus, both cell types tend to maximally utilize glycolysis when the substrate is abundant, although PMVECs are most reliant upon aerobic glycolysis.
Single cell cloning generates homogeneous first-generation clones reflective of the parent
population. We identified the hierarchy of growth potentials by single cell clonogenic
assays (Fig. 1b). Unlike PMVECs,
PAECs only gave rise to relatively homogeneous slow-growing colonies. It is questionable
whether single PAECs can reconstitute colonies of cells reflective of their parent
population when they are expanded from single cell culture conditions. To answer this
question, we randomly selected four colonies that were derived from single cell clones of
PAEC 2 and named these first-generation clones PAEC 2-1, PAEC 2-2, PAEC 2-3, and PAEC 2-4
(Fig. 3). The population growth of
these first-generation PAEC 2 clonal cells was almost identical to their parent cells, or
slower in the case of PAEC 2-4 (Fig.
4a). There was no obvious medium color change by day 7 in any of the clones,
indicating cells did not use aerobic glycolysis to sustain their growth. Notably, morphology
of these cells was extremely homogeneous compared to their parent population. In subsequent
single cell cloning experiments using the first-generation clones, only PAEC 2-3 grew
detectable cell colonies, in 13 out of 384 wells of 96-well plates (Fig. 4b). The remaining wells possessed single cells,
or small cell colonies not immediately detectable. PAEC 2-1, 2-2, and 2-4 did not grow
detectable colonies within 14 days of cell seeding. Cell nomenclature is shown in the study design. PMVECs and PAECs were isolated from
the lungs of four different male Sprague Dawley rats. PMVECs were isolated from two
different rats (PMVEC 1 and 2), and PAECs were isolated from two separate rats (PAEC 1
and 2). PAEC 2 was single cell cloned to generate four randomly selected
first-generation colonies, PAEC 2-1, 2-2, 2-3, and 2-4. PAEC 2-3 was single cell
cloned to generate two second-generation colonies, PAEC 2-3-1 and 2-3-2. First generation PAEC 2 clones closely mimic their parent population. (a) Serum
stimulated growth of four first-generation clones of PAEC 2 were assessed. PAEC 2-1,
2-2, and 2-3 grew at a similar growth rate as their parent population. PAEC 2-4 showed
decreased growth rate compared to the other clones. Data represent mean ± standard
deviation. Two-way ANOVA and Bonferroni post hoc tests were used to compare between
cell types. For each cell type, two separate experiments were performed using a total
of four wells. The PAEC 2 growth curve is depicted as a dotted line for a reference.
*denotes significantly different (P < 0.05; PAEC 2-4 vs. PAEC 2-1,
2-2, or 2-3). Data were gathered from two independent experiments with four wells per
group. PAEC 2 mean cell number values from Fig. 1a are depicted in a broken line for a
reference. (b) PAEC 2-1, 2-2, 2-3 and 2-4 were seeded one cell per well on 96-well
plates, four plates per cell type, by FACS sorting. Plates were examined on day 14.
Only PAEC 2-3 had visible small-sized colonies, whereas PAEC 2-1, 2-2, and 2-4 did not
grow discernible colonies. Data represent a total number of colonies in four plates.
(c) PAEC 2 first generation clones were seeded on Matrigel coated 96-well plates at
8.0 × 10⁴ cells per well. Images were obtained 24 h after seeding at
10 × magnification. All first-generation PAEC 2 clones formed networks similar to
their parent population. (d–f) The principal bioenergetic pathways utilized by PAEC 2
first-generation clones were determined by mitochondrial (d, e) and glycolysis (f)
stress tests using the Seahorse extracellular flux analyzer. OCR and ECAR at baseline
and with different mitochondrial (oligomycin, FCCP, and rotenone) and glycolytic
(glucose, oligomycin, and 2-DG) stressors are shown over time. There was no
significant difference between groups. Data represent mean ± standard error. (d, f)
Two-way ANOVA and Bonferroni post hoc test were used to compare between cell types.
Results from three independent experiments, each with five replicates, a total of 15
wells per group are shown. Mean values of OCR and ECAR of PAEC 2 from Fig. 2a and d are depicted in
broken lines for references. For the purposes of clarity standard deviation has been
removed. *denotes significant difference (P < 0.05) PAEC 2 vs.
2-1, 2-2, 2-3, or 2-4 (n = 3 per group). (e) Basal OCR, ATP-linked respiration
(average basal OCR – oligomycin response), maximal respiration (FCCP response), and
spare capacity (maximal OCR – average basal OCR) are noted. One-way ANOVA and
Bonferroni post hoc test were used to compare between cell types. Each dot represents
the value of individual well at each time point. *denotes significant difference
between PAEC 2-1 vs. 2-4. ^denotes significant difference between PAEC 2-2
vs. 2-4.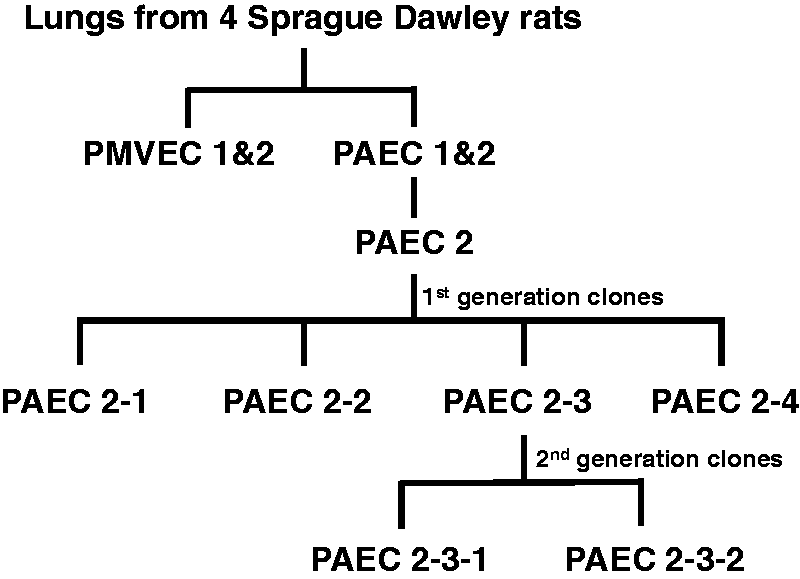
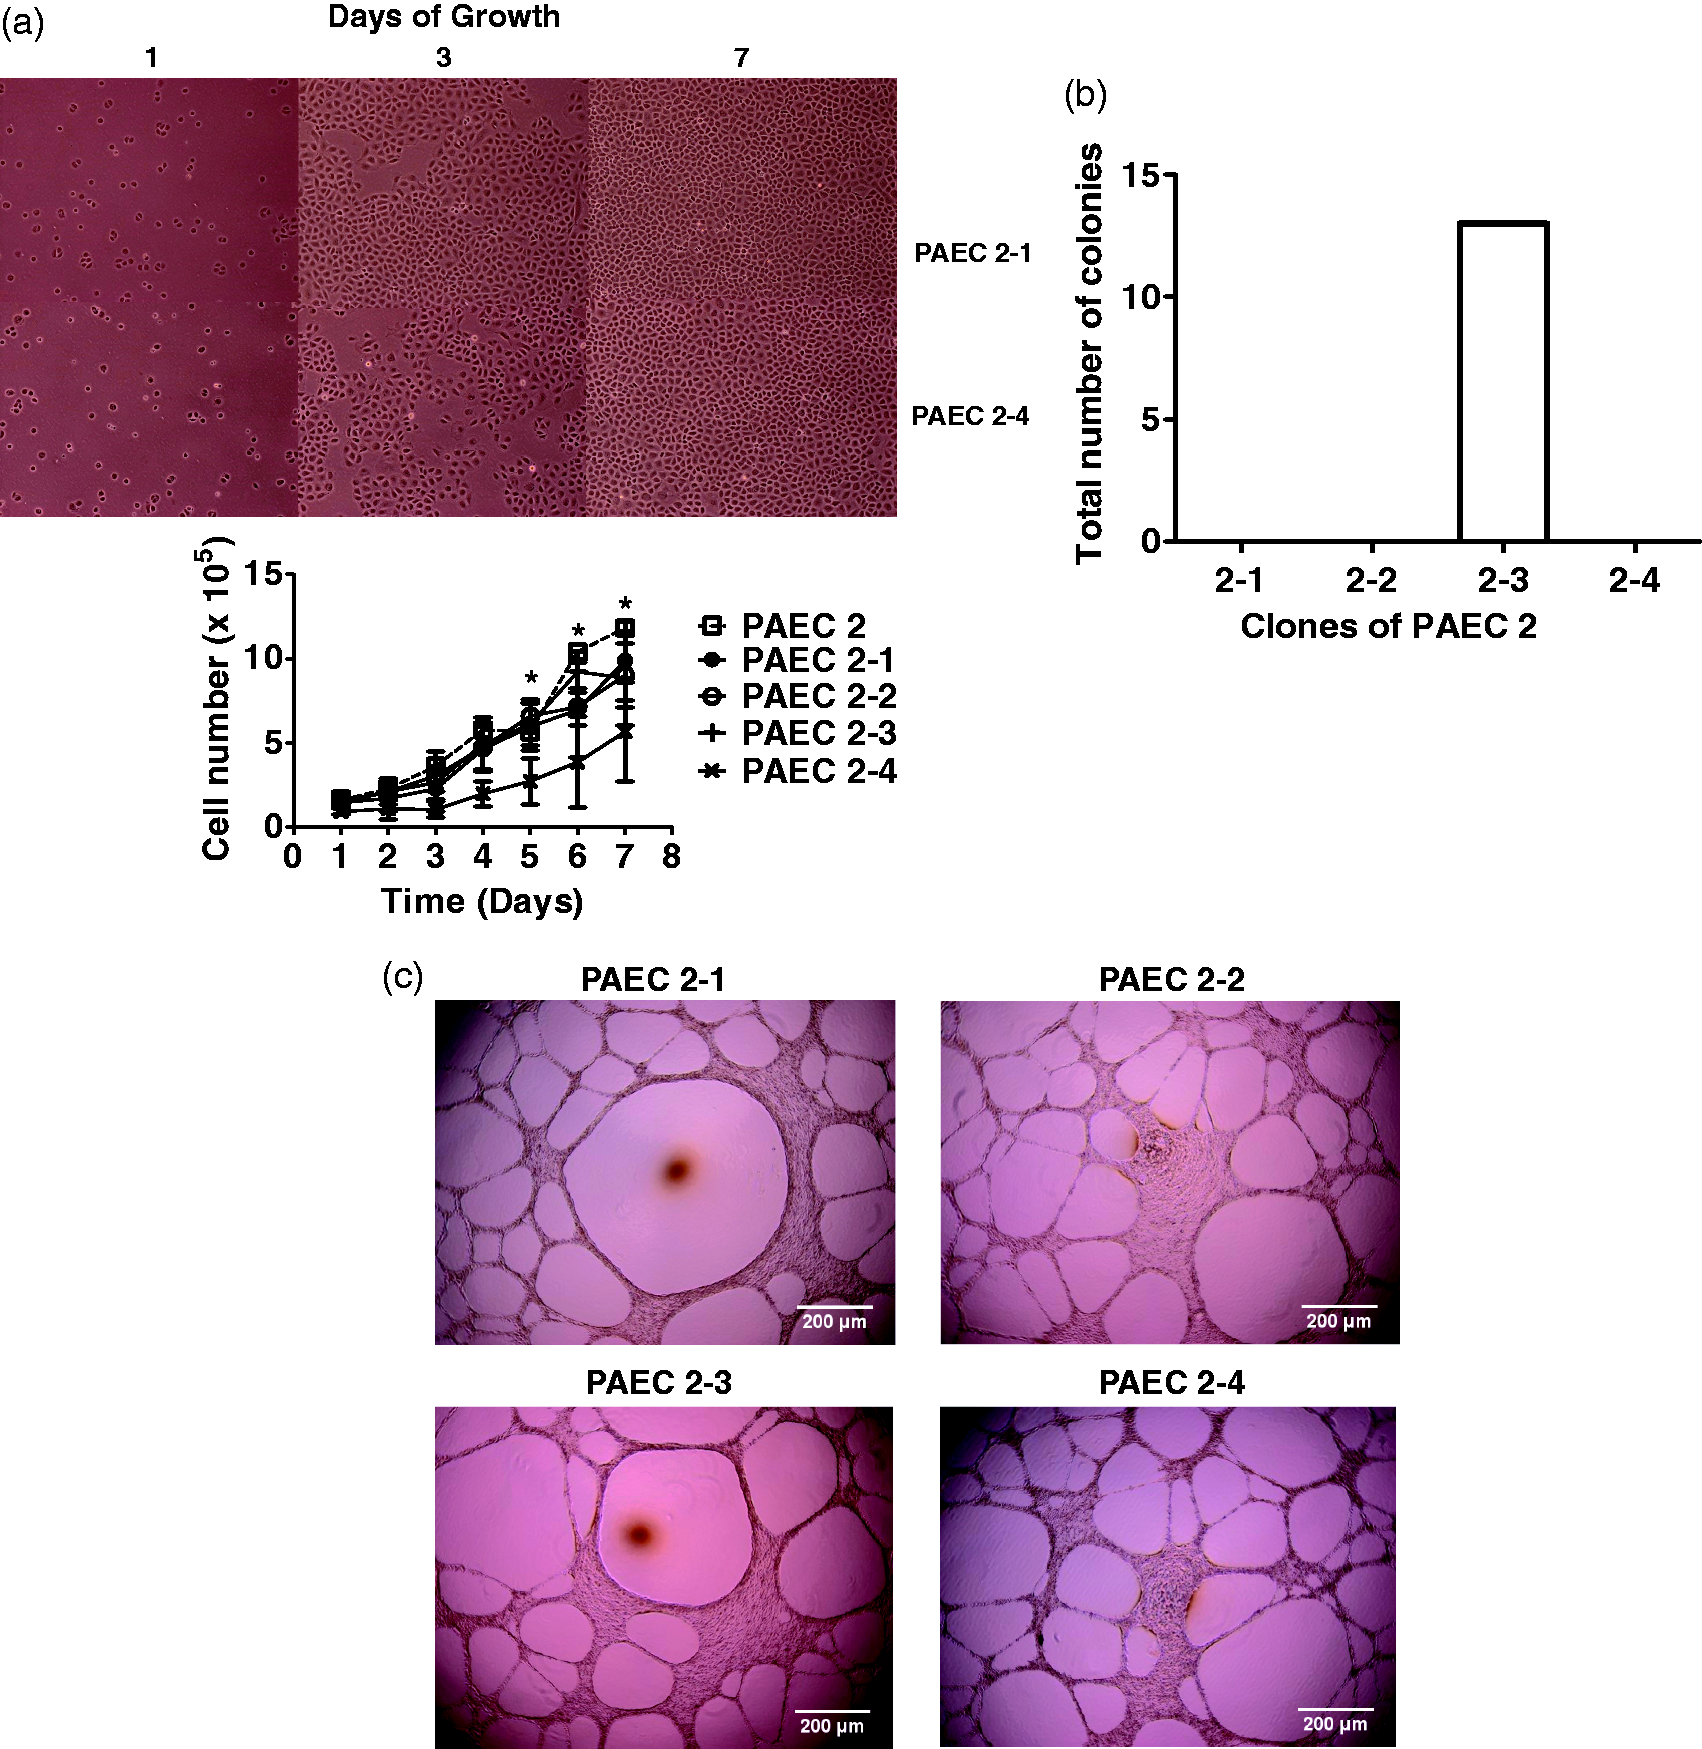
Matrigel assays revealed network formation in all first-generation clones. Cell seeding at 8.0 × 10⁴ cells per well was necessary to observe network formation, which is identical to the seeding density of the parent cells (Fig. 4c). This seeding density is twofold higher than the typical seeding density for PMVECs. Network morphology of the cloned cells was similar to that seen in the parent cell populations, with thin webs and large luminal areas.
Mitochondrial and glycolysis stress tests revealed no significant difference among first-generation clones (Fig. 4d). Compared to the parent cells, all clones showed lower OCR at baseline (OCR at 0 min point in PAEC 2 vs. 2-1, vs. 2-2, vs. 2-3, and vs. 2-4, P < 0.05), whereas there was no difference in ECAR among the cells tested (Fig. 4d). Additional parameters for mitochondrial function, basal OCR, ATP-linked respiration, maximal respiration, and spare capacity were all similar among all clones except the differences between PAEC 2- and other clones in spare capacity (Fig. 4e). During the glycolysis stress test, baseline OCR (OCR at 0 min in PAEC 2 vs. 2-1, vs. 2-2, vs. 2-3, and vs. 2-4, P < 0.05) and glucose challenged maximal ECAR (ECAR at 52 min in PAEC 2 vs. 2-1, vs. 2-2, vs. 2-3, and vs. 2-4, P < 0.05) were both reduced in the clones compared to the parent cells (Fig. 4f). Thus, whereas growth and angiogenic potential were nearly identical between the parental cells and the clonal derivatives, metabolic profiling indicated the first-generation PAEC clones had lower bioenergetic demands.
Second generation single cell cloning may select cells with relatively higher replication. PAEC populations that are initially isolated and expanded arise from within an arterial segment, but the expanded progeny are likely to derive from multiple different cells within the vessel wall. For this reason, first-generation PAEC 2 clones may not necessarily be derived from the same cells. Therefore, we repeated single cell cloning on first-generation colonies to generate second-generation colonies (Fig. 3). These second-generation colonies are truly single cell progeny. Since PAEC 2-3 was the only first-generation clone that grew discernable colonies on single cell clonogenic assays, we randomly selected two colonies from the PAEC 2-3 single cell cloned plates, and named them PAEC 2-3-1 and PAEC 2-3-2.
PAEC 2-3-1 and 2-3-2 population growth was nearly identical, and was similar to their
parent cells, PAEC 2-3 (Fig. 5a).
However, in single cell studies, PAEC 2-3-1 and 2-3-2 revealed an increased number of
colonies derived from single cells when compared to PAEC 2-3 (PAEC 2-3 vs. 2-3-1 vs. 2-3-2,
P < 0.05); there was no difference in the single cell growth potential
among PAEC 2-3-1 and 2-3-2 (Fig. 5b;
P = ns). Thus, in this experiment, the growth of single cell clones did
not broadly reflect the population growth curves. Second-generation PAEC 2 clones mimic the parent population and possess increased
replication competence. (a) Serum stimulated growth of two PAEC 2-3 second-generation
clones were assessed. There was no significant difference between groups when compared
to the parent population. Data represent mean ± standard deviation. Two-way ANOVA and
Bonferroni post hoc test were used to compare between cell types. ns denotes not
significant. PAEC 2-3 growth curves are depicted as a dotted line for a reference.
PAEC 2-2 mean values of cell number from Fig. 2a are depicted in a broken line for a
reference. (b, c) PAEC 2-3-1 and 2-3-2 were seeded one cell per well on 96-well
plates, four plates per cell type, by FACS sorting. (b) Plates were examined on day
14. There was no significant difference between groups in total numbers of colony
counts. The absolute colony counts are increased in both PAEC 2-3-1 and 2-3-2 compared
to PAEC 2-3. Data represent number of colonies per plate, mean ± standard deviation.
Unpaired t-test was used to compare between two groups. ns, not
significant. A total number of colonies observed in single cell clonogenic assays of
PAEC 2-3 is depicted in a broken line for a reference. (c) Plates were reexamined on
day 28. Over this extended time course, both second-generation PAEC 2 clones
reconstituted a hierarchy of small- to large-sized colonies. PAEC 2-3-1 had a lower
number of large-sized colonies than PAEC 2-3-2. *denotes significantly different
(P < 0.05) compared to PAEC 2-3-1 vs. 2-3-2 in small-sized
colonies. ns, not significant. # denotes significantly different
(P < 0.05) compared to PAEC 2-3-1 vs. PAEC 2-3-2 in large-sized
colonies. (d) Cells were seeded on Matrigel (30 µL per well) coated 96-well plates at
densities of 8.0 × 10⁴ cells depending on a cell type at a total cell
solution volume of 80 µL. Cells were incubated at 37 ℃ with 5% CO2-room air
for 24 h and then observed and pictures taken. Images are at 10 × magnification. Both
PAEC 2-3-1 and 2-3-2 formed thin networks with large luminal areas similar to those of
PAEC 2 and 2-3. (e–h) The principal bioenergetic pathways utilized by PAEC 2-3-1 and
2-3-2 were determined by mitochondrial (e–g) and glycolysis (h) stress tests using the
Seahorse extracellular flux analyzer. OCR and ECAR at baseline and with different
mitochondrial (oligomycin, FCCP, and rotenone) and glycolytic (glucose, oligomycin,
and 2-DG) stressors are shown over time. PAEC 2-3-1 showed decreased aerobic
glycolysis and increased oxidative phosphorylation when compared to PAEC 2-3-2. OCR
and ECAR patterns of 2-3-2 closely mimicked those of PAEC 2-3. Data represent
mean ± standard error. Two-way ANOVA and Bonferroni post hoc test were used to compare
between cell types. Results from three independent experiments, each with five
replicates, a total of 15 wells per group are shown. *denotes significantly different
(P < 0.05) in PAEC 2-3-1 vs. PAEC 2-3-2 (n = 3 per group). Mean
values of OCR and ECAR of PAEC 2-3 from Fig. 4d and f are depicted in broken lines for
references. For the purposes of clarity standard deviation has been removed. (f) Basal
OCR, ATP-linked respiration (average basal OCR – oligomycin response), maximal
respiration (FCCP response), and spare capacity (maximal OCR – average basal OCR) are
noted. (g) ECAR at baseline of mitochondrial stress test at three different time
points are depicted. Each dot represents the value of individual well at each time
point. Student's t-test was used. *denotes significant difference
(P < 0.05) between PAEC 2-3-1 vs. 2-3-2.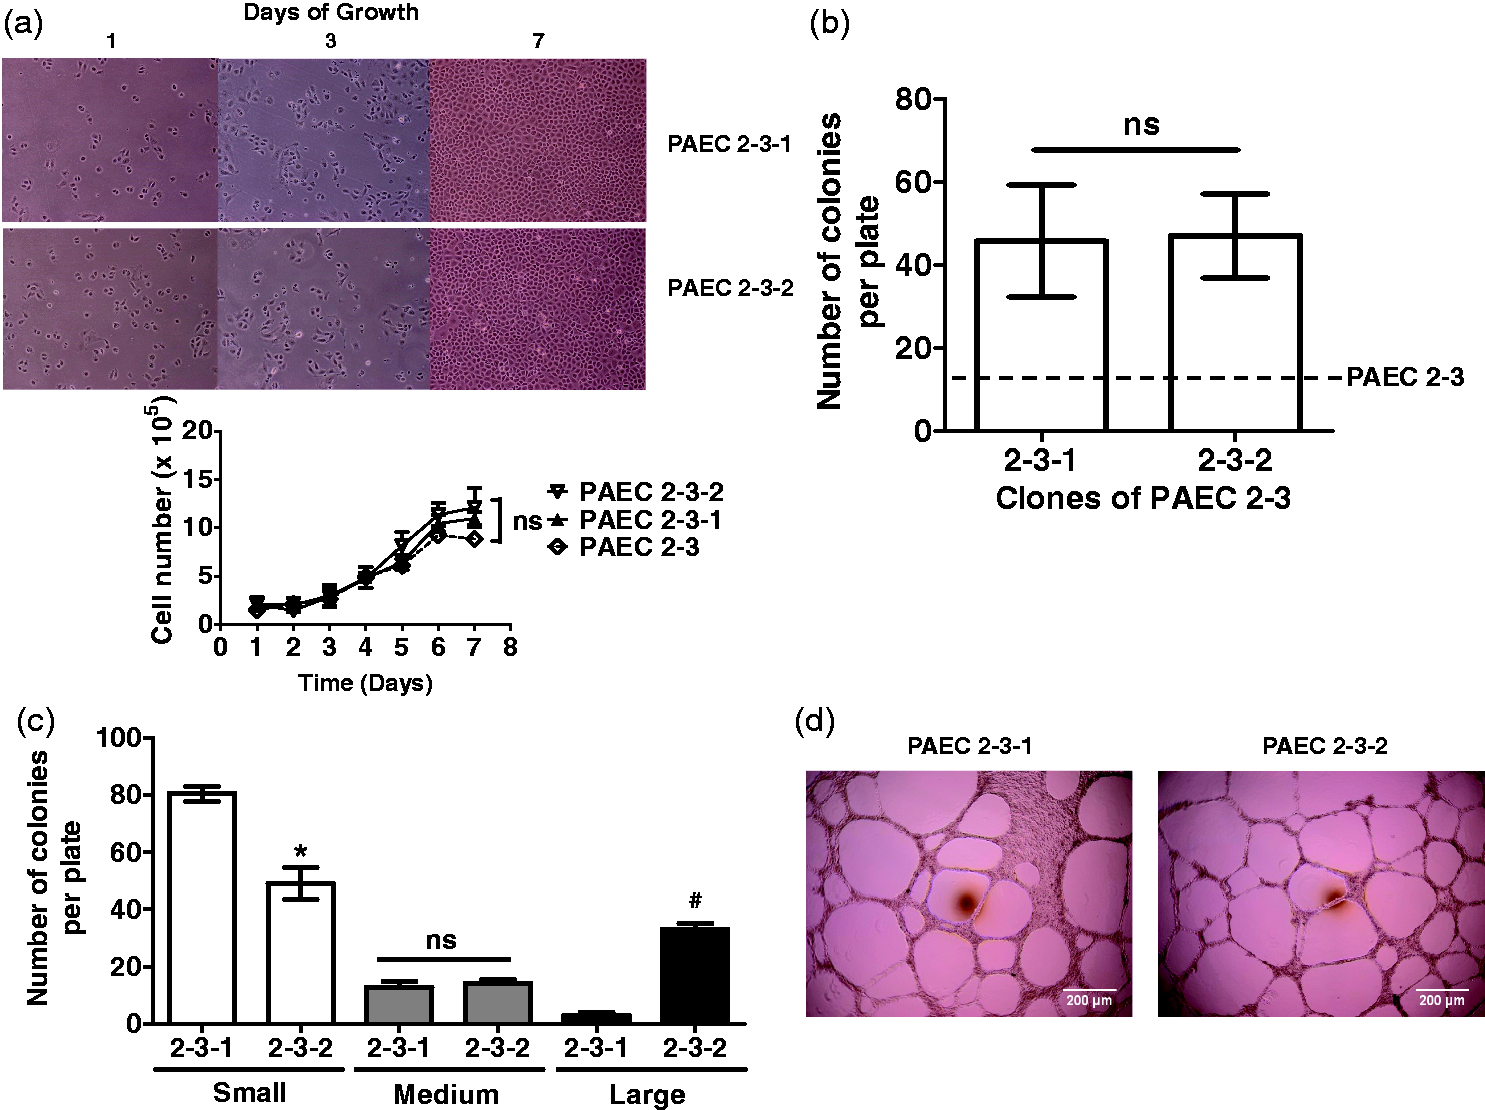
We considered this potential paradox further. Here, single cell studies were repeated, and the growth period extended from 14 days to 28 days after the initial cell seeding (Fig. 5c). On longer observation, PAEC clones grew to variable colony sizes, just as shown in PMVECs (Fig. 1b).8,26 The time required to develop the growth hierarchy was longer and the number of high proliferative potential colonies was lower than previously observed in PMVECs.8,26 Comparing between the two different second-generation clones, PAEC 2-3-1 had a significantly lower number of large colonies than PAEC 2-3-2 (PAEC 2-3-1 vs. 2-3-2, P < 0.05). None of the PAEC 2-3-1 clones acidified the medium, whereas several PAEC 2-3-2 clones displayed aerobic glycolysis.
Matrigel assay findings corroborated the growth curve results, as network formation was identical in PAEC 2-3-1 and 2-3-2 (Fig. 5d). The number of cells required to form stable networks was identical to that of their parent cells, which was 8.0 × 10⁴ cells per well. The pattern of network formation, including thin webs and large lumens, was similar to that of their parent cells as well.
Although there was no significant difference between PAEC 2-3-1 and PAEC 2-3-2 in population growth and Matrigel network patterns, single cell proliferative capacity was lower in PAEC 2-3-1. Consistent with this decrease in single cell proliferative potential difference, mitochondrial and glycolysis stress tests revealed significantly decreased aerobic glycolysis utilization in PAEC 2-3-1 compared to PAEC 2-3-2 (Fig. 5e–h). In the mitochondrial stress test, OCR was higher (PAEC 2-3-1 vs. 2-3-2, P < 0.05) and ECAR was lower (PAEC 2-3-1 vs. 2-3-2, P < 0.05) at baseline in PAEC 2-3-1, suggesting higher oxidative phosphorylation and less dependence on aerobic glycolysis (Fig. 5e–g). Additional parameters for mitochondrial function, basal OCR, ATP-linked respiration, and maximal respiration were all higher (PAEC 2-3-1 vs. 2-3-2, P < 0.05) in PAEC 2-3-1 (Fig. 5f). Consistent findings were observed in the glycolysis stress test, where OCR was higher in PAEC 2-3-1 (PAEC 2-3-1 vs. 2-3-2, P < 0.05) and ECAR was relatively suppressed in PAEC 2-3-1 at baseline (PAEC 2-3-1 vs. 2-3-2, P = ns) (Fig. 5h). Overall, the metabolic profile of PAEC 2-3-2 was nearly identical to the parental cell line, PAEC 2-3.
Discussion
Pulmonary endothelial cells are structurally and functionally heterogeneous.8,26 They possess differential characteristics in population growth, single cell cloning, angiogenesis, and bioenergetic pathway utilization. In this study, we have examined PMVECs and PAECs isolated from multiple rats to rigorously test generalizability of our previous findings. Then, we cloned PAECs and compared them to the parent cells to evaluate how well clones represent parental characteristics. We studied PAECs because they possess fewer high proliferative potential cells within the population. The results recapitulated and expanded previously identified typical characteristics of PMVECs and PAECs. Using cells from different animals, PMVECs grew faster in population and had a higher proliferative potential in single cell cloning than PAECs, they required fewer cells to form networks in Matrigel compared to PAECs, and they were more reliant upon aerobic glycolysis. First-generation clones of selected PAECs were highly representative of the parental population. Second-generation clones of selected PAECs had enhanced replication competence in single cell conditions, but maintained parental characteristics. They were also noted to be morphologically homogeneous within each clonal population, making sibling clones more distinctive from each other.
Replication competence is a critical feature of the cells used in in vitro studies.
However, repeated subculture increases the risk for phenotypic drift.
30
Although such phenotypic
drift has been reported in cell types such as cancer cell lines
31
and mesenchymal stem cells,
32
and discussions regarding
environmental influences of endothelial cell phenotype is widespread, it is not known how
typical characteristics of PMVECs and PAECs, including growth, angiogenic potential, and
bioenergetic demands, are affected by repeated subculture. Furthermore, little is known
regarding how single cell cloning and expansion alters these endothelial cell properties,
given that each cell in the single cell assay starts growing in the absence of signals from
neighboring cells. We have evaluated characteristics of two consecutive clonal generations
from one PAEC parental population. PAECs are isolated from the main pulmonary trunk and one
to two vascular bifurcations. Therefore, cells within a cultured population could be
diverse, having originated in either the same or different pulmonary artery region (Fig. 6). As a result, isolation of
first-generation clones separates these diverse parental populations from each other. In
contrast, second-generation clones are truly derived from a single cell. Interestingly, as
clonal generation increased, there was a clear increase in the single cell replication
competence. However, their population growth, angiogenic potential, and bioenergetic
characteristics remained relatively unchanged. Furthermore, second-generation clones seemed
to be more homogeneous within each clonal population. Second-generation clones also remained
similar to their parental cells, PAECs, relative to PMVECs. Therefore, our data suggest that
single cell cloning could be utilized to expand a small number of cells while preserving
parental characteristics. It also can potentially be used to choose clonal populations that
have higher replication competence in single cell conditions, while possessing more
homogeneous characteristics of parental cells. Second-generation single cell clones arise from one cell phenotype. Cells within the
parental population may originate from different areas within the pulmonary artery
(e.g. A, B and/or C areas). By single cell cloning, first-generation clones are
generated, which separate potentially heterogeneous cells from one another. Repeated
single cell cloning generates second-generation clones; these clones arise from one
cell phenotype. Tan shaded regions of “B” cells represent clones isolated from the
first and second cloning strategies, respectively.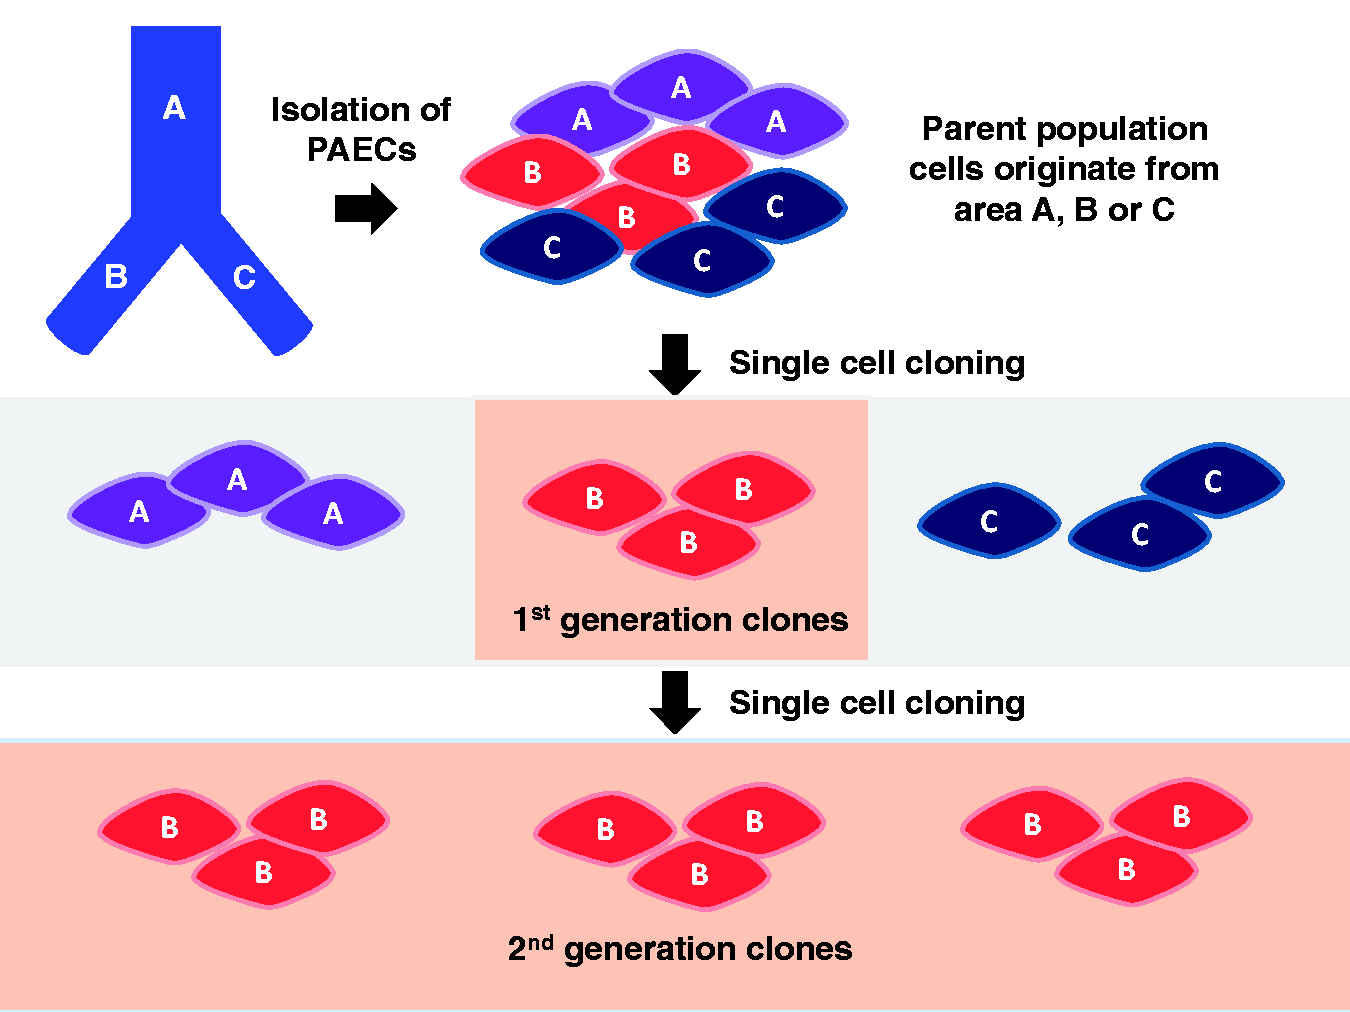
Review of studies on aerobic glycolysis in endothelial cells.
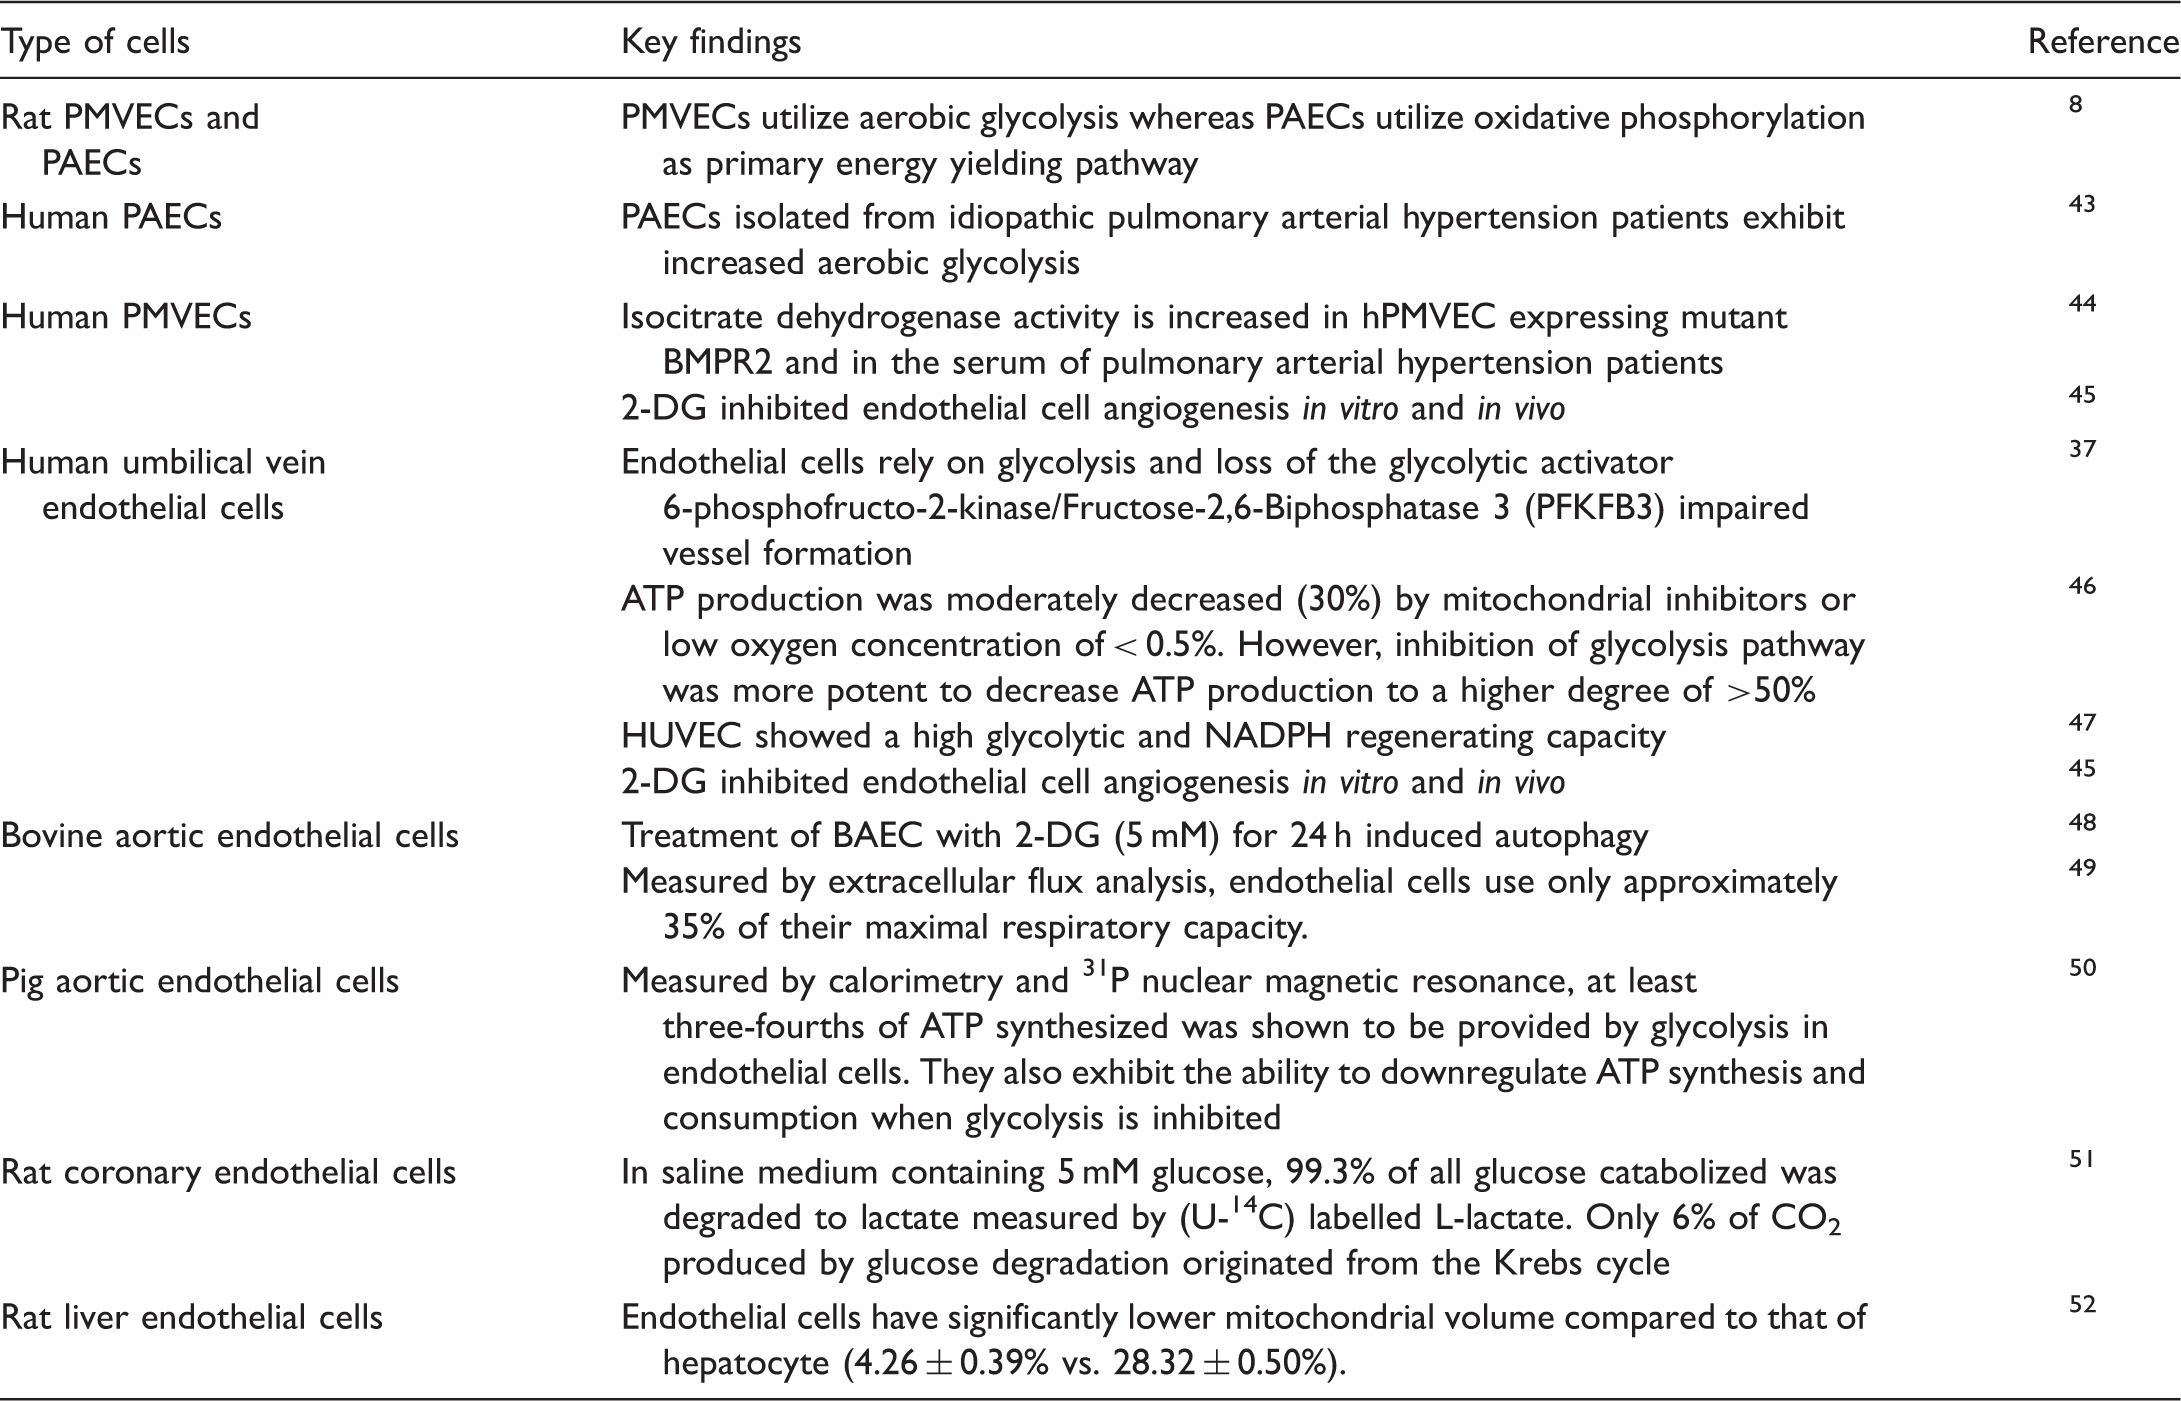
Our present study shows that both PMVECs and PAECs utilize aerobic glycolysis. Although PAECs have lower rates of aerobic glycolysis at baseline, they are still able to mount significant ECAR with relatively suppressed OCR upon glucose loading. This phenomenon of increased aerobic glycolysis and repressed oxidative phosphorylation in the setting of increased glucose availability is defined by the Crabtree effect, 39 which is commonly observed in rapidly growing cancer cells along with the Warburg effect. However, the degree of dependence on aerobic glycolysis is significantly different between PMVECs and PAECs at baseline. It is not yet clear whether these findings directly represent the PMVEC and PAEC phenotype in vivo.
The reason endothelial cells utilize aerobic glycolysis is incompletely understood. It may be that they gain an advantage from utilizing aerobic glycolysis, or it may be that they are driven to use aerobic glycolysis due to relative impairment in mitochondrial function. Carmiliet et al. hypothesized that endothelial cells prefer utilizing aerobic glycolysis for multiple reasons, including decreased oxygen consumption and reactive oxygen species production, which confers a survival advantage and enables development of new vascular structures in oxygen deprived environments. 36 Furthermore, aerobic glycolysis is a faster way of producing ATP than is oxidative phosphorylation when there is a sufficient glucose supply and simultaneous activation of macromolecule producing pathways that provide biomass for rapidly proliferating cells. These advantages of aerobic glycolysis may be most useful for capillary endothelial cells that are responsible for the gas exchange barrier, whereas arterial endothelial cells contribute to vascular tone for blood delivery to the capillaries. Relative impairment in mitochondrial function was hypothesized given that some cancer cells are known to utilize aerobic glycolysis due to increased pyruvate dehydrogenase kinase (PDK) expression, which inhibits oxidative phosphorylation.40–42 However, RNA sequencing of PMVECs and PAECs revealed no significant difference in PDK1-4 expression between two cell types.
In summary, we report distinctive proliferation, network forming (e.g. angiogenesis) and bioenergetic capacities of PMVECs and PAECs, which are preserved in multiple clonal generations in PAECs. These findings offer an approach to generate replication competent progeny for in vitro experiments and shed novel insight into the preservation of single cell inheritance. Indeed, these findings continue to support the idea that macrovascular and microvascular cell lineages retain certain memories of their origins under culture conditions.
Footnotes
Acknowledgements
The authors thank Drs. Mikhail Alexeyev, Ming Tan, and Sangbin Lim and Ms. Natalya Kozhukhar for their assistance with Seahorse assays and Dr. Domenico Spadafora for single cell clonogenic assays.
Conflict of interest
The author(s) declare that there is no conflict of interest.
Funding
This research was supported by HL66299 (TS), HL60024 (TS), and HL117721 (SAM).