
Abstract
Although attention biases are common in various anxiety disorders, there is no consensus yet regarding attentional bias in obsessive–compulsive disorder. We assessed attention bias toward images involving contamination and disgust using an emotional attentional blink paradigm in a sample of university students high (HCF) or low (LCF) in contamination fear. Neutral, general-threat-, contamination-, and disgust-related images (T1) were presented followed by a discrimination task (T2) 200, 500, or 800 ms later within a rapid serial visual presentation stream of 20 images. The HCF group was overall less accurate on the attentional blink task. Response accuracy differed by image type and lag in the two groups at the trend level and revealed a large drop in performance 200 ms following presentation of disgusting images in the HCF group. No such differences were observed at later lags in the task. There were increases in negative affect following the task for the HCF but not the LCF group, which were correlated with contamination fear scores. The results suggest that a disgust-related attention bias may be present at early stages of information processing in people with contamination fear.
Attention biases toward threatening information have been found in various anxiety disorders (Amir, Elias, Klumpp, & Przeworski, 2003; Summerfeldt & Endler, 1998) that may appear as faster detection of threat, difficulty in disengaging attention from threat, or strategic avoidance of threat (Cisler & Koster, 2010). A meta-analysis has shown a medium-sized difference in such biases between clinical or subclinical anxious samples and low anxious controls (Bar-Haim, Lamy, Pergamin, Bakermans-Kranenburg, & van Ijzendoorn, 2007). Obsessive–compulsive disorder (OCD) is characterized by anxious responding to potentially threatening stimuli (American Psychiatric Association, 2013). Numerous studies have been conducted in both subclinical and clinical samples on whether attentional biases occur in OCD. However, findings have not been consistent, with attentional bias being found in some studies (e.g., Amir, Najmi, & Morrison, 2009; Lavy, Van Oppen, & Van Den Hout, 1994; Moritz, Von Muehlenen, Randjbar, Fricke, & Jelinek, 2009; Rao, Arasappa, Reddy, Venkatasubramanian, & Reddy, 2010; Unoki, Kasuga, Matsushima, & Ohta, 1999) but not in others (e.g., Morein-Zamir et al., 2013; Moritz et al., 2009; Moritz & von Mühlenen, 2008).
Various tasks that have been used in attentional bias research measure different aspects of the attentional process. Each task has its own specific characteristics that can also be a source of inconsistency in research findings. Interesting findings have been reported in two recent studies using attention blink (AB) task and the closely related emotional attentional blink task also called emotion-induced blindness task (Onie & Most, 2017; Sigurjónsdóttir, Sigurðardóttir, Björnsson, & Kristjánsson, 2015). In both standard and emotional AB tasks, participants are presented with a target involving a discrimination task (T2) that is preceded by a distractor (T1) during rapid serial visual presentation (RSVP) of images. The tasks differ in that a discrimination task is also implemented at T1 in standard AB tasks (Wang, Kennedy, & Most, 2012). Both tasks can robustly measure whether emotional task-irrelevant stimuli capture attentional resources in a stimulus-driven manner (McHugo, Olatunji, & Zald, 2013; Most & Wang, 2011). The blink is typically strongest 100–300 ms following the distractor, with little or no effect observed after approximately 500 ms (Dux & Marois, 2009; Kristjánsson & Nakayama, 2002; Luck, Vogel, & Shapiro, 1996; McHugo et al., 2013). Recently, Onie and Most (2017) compared performance on a dot-probe task and an emotional AB task using emotional stimuli and found that the two tasks did not predict each other and accounted for unique proportions when predicting negative affect. In another study, Sigurjónsdóttir, Sigurðardóttir, Björnsson, and Kristjánsson (2015) compared the performance of 24 university students on the dot probe, the spatial cueing, the irrelevant singleton, and a standard AB task using pictures with neutral and threatening facial expressions. The attentional blink was by far the most sensitive to attentional biases toward threatening facial expressions, while the spatial cueing and dot-probe tasks were not sensitive to such biases. These findings show that different tasks assessing attentional bias may tap unique clinically meaningful aspects of attention (e.g., Onie & Most, 2017) and that AB tasks measure unique aspects of attentional biases that other frequently used tasks may not fully capture (e.g., Sigurjónsdóttir, Sigurðardóttir, et al., 2015).
AB tasks have rarely been used in studies of attentional biases in OCD. In one of the few studies conducted to date, Olatunji, Ciesielski, and Zald (2011) used an emotional AB task to study attentional bias in OCD patients and nonclinical controls using erotic, fear, disgust, or neutral distractor images that appeared 200 or 800 ms before a target discrimination task. No bias was seen for fear or disgust pictures, but response accuracy was lower among OCD patients following erotic distractors at 800 ms, suggesting disengagement difficulties. These results suggest no bias toward disgust-related materials, even when probing for biases within the 100–300 ms window where the blink should be the strongest. However, Olatunji et al. (2011) used a general sample of OCD patients with different symptom presentations. Attention bias toward disgust and contamination would be expected to characterize participants with fear of contamination and washing rituals (Olatunji, Cisler, McKay, & Philips, 2010)—the most common form of OCD (Ball, Baer, & Otto, 1996; Rasmussen & Eisen, 1992). Fear of contamination is an intense and persisting feeling of having been polluted or infected from direct or indirect contact with something perceived to be infectious or harmful and is often accompanied by feelings of disgust, dirtiness, moral impurity, and shame (Rachman, 2004). Studies show that individuals with heightened contamination fear report feelings of disgust when confronted with contamination-related stimuli (Deacon & Olatunji, 2007; Olatunji, Lohr, Sawchuk, & Tolin, 2007), display greater behavioral avoidance of disgusting objects than nonfearful and anxious individuals (Olatunji, Sawchuk, Lohr, & de Jong, 2004; Olatunji et al., 2007; Tsao & McKay, 2004), and describe threat-relevant objects as disgusting rather than frightening (Olatunji & Sawchuk, 2005; Tolin, Worhunsky, & Maltby, 2004)
Previous studies have revealed biases toward contamination-related material on the Stroop task (Foa, Ilai, McCarthy, Shoyer, & Murdock, 1993; Tata, Leibowitz, Prunty, Cameron, & Pickering, 1996) and with eye tracking during free viewing (Armstrong, Sarawgi, & Olatunji, 2012). However, other studies have found no evidence for an attentional bias toward contamination-related material (De Putter & Koster, 2017). Support for disgust-related biases is mixed. Cisler and Olatunji (2010) found support for delayed disengagement of attention toward negative material in general (both disgusting and frightening images) on the spatial cuing task. Armstrong, Olatunji, Sarawgi, and Simmons (2010) found that participants with high contamination fear (HCF) attended preferentially to fearful over disgusted faces and maintained attention on both expressions longer, compared to participants with low contamination fear (LCF), providing evidence for vigilance-based biases toward threat but not disgust- and maintenance-based biases for negative material in general.
Taken together, there is some evidence for biased attention toward contamination-related material in samples characterized by fear of contamination or washing compulsions but the evidence for biased attention toward disgust-related material is less clear. We know of no studies on disgust-induced or contamination-related attentional biases using AB tasks in samples defined by levels of contamination fear or washing rituals. AB tasks may be more sensitive to attentional biases at earlier stages of the information processing compared to other tasks frequently used in the field (Sigurjónsdóttir, Sigurðardóttir, et al., 2015).
The present study
The aim was to measure attention bias toward contamination- and disgust-evoking stimuli using an emotional attentional blink task in a nonclinical sample defined by different levels of contamination fear. It is generally assumed that attentional biases in OCD are more likely at later stages of the attentional process (e.g., Cisler & Olatunji, 2010). However, stimulus-driven effects on attentional resources are strongest at earlier stages in attentional blink tasks (Kristjánsson & Nakayama, 2002; Luck et al., 1996)—a task that may be more sensitive to biases at earlier stages of the attentional process than other tasks in the attentional bias literature (Sigurjónsdóttir, Sigurðardóttir, et al., 2015). We therefore predicted that participants high in contamination fear would have lower response accuracy on a discrimination task following disgust- and contamination- but not threat-related pictures, when compared to accuracy following neutral pictures, and that this would be observed at earlier (Lag 2) but not later lags (Lags 5 and 8) in the task.
We also measured participants’ level of attentional control, given that better control has been shown to modulate attentional biases in anxiety (e.g., Derryberry & Reed, 2002) and reduce the attentional blink following emotional distractors (Peers & Lawrence, 2009). We measured participants’ sensitivity to disgust, since greater sensitivity may be related to greater impairments on attentional tasks involving disgust-related stimuli (Cisler, Olatunji, Lohr, & Williams, 2009). We also included measures of trait anxiety, OCD-related beliefs, and severity of OCD symptoms to control for possible group differences in general anxiety levels and to increase the clinical relevance of our findings. Finally, we measured participants’ state affect before and after the attentional task, for exploratory purposes. We measured whether the task would influence participants’ negative and positive affect and whether these changes would be correlated with OCD-related measures.
Method
Participants
E-mails were sent out to all students at the University of Iceland with an invitation to participate in an online survey including the contamination subscale of the Padua Inventory-Washington State University Revision (PI-WSUR) (see below). Participants with high (>13) or low (<6) scores on the scale were contacted (cf. Armstrong et al., 2012) and 47 agreed to participate. The final sample was based on scores from the second administration of the PI-WSUR on the day of the experiment and participants’ own reports of having a formal diagnosis of an attentional-deficit disorder (ADD). Participants were excluded whether their PI-WSUR contamination fear scores did not fall within the high or low group range on the testing day (n = 8) or they reported having ADD diagnosis (n = 4) or both (n = 1). One participant was excluded because of an error in the administration of the self-report questionnaires and another was unable to complete the experiment. This left a final sample of 32 participants, 15 in the HCF group (all females) and 17 in the LCF group (14 females). Participants received 1,000 ISK (almost equal to US$8) for participation. Descriptive statistics for demographics and questionnaire measures are presented in the “Results” section.
Stimuli
A total of 105 images from the International Affective Picture System (Lang, Bradley, & Cuthbert, 2008) were shown in the attentional blink task, including contamination (e.g., a man walking through a landfill, overfilled trash bins; n = 18), disgust (e.g., a man vomiting, dirty toilet; n = 17), fear (e.g., people holding guns, a knife; n = 35), and neutral (e.g., geometrical patterns, a basket; n = 35) images, as well as images of landscapes and people (n = 109). 1 The images were selected and classified by two of the authors (RPÓ and SS), and three trained graduate students in clinical psychology separately reviewed the images by matching previous classifications of these images in already published research (e.g., Cisler & Olatunji, 2010; Olatunji et al., 2011). Five additional images relating to contamination (i.e., public toilet, raw chicken, dirty hands, moldy bread, and a man sneezing), as well as four neutral images (with geometric patterns), acquired from stock photography websites, were included.
An independent sample of university students (n = 20; 75% female; mean age 23.6, standard deviation [SD] = 3.4) rated all (T1) images for threat, contamination, disgust, discomfort, and arousal on a 7-point Likert-type scale (1 = not at all; 7 = very much). The results of the ratings by image categories (i.e., neutral, threat, contamination, and disgust) are shown in Table 1, along with results of pairwise comparisons of the means. The results show that, compared to images from other categories, threat-related images were rated significantly more threatening, contamination-related images more contaminating, and disgust-related images more disgusting (ps < .05). Neutral images had the lowest mean score that also was close to the lowest point (1 = not at all) on all dimensions. Threat-related images had the highest arousal ratings and disgust-related images had the greatest discomfort (ps < .05).
Ratings (means and standard deviations) of threat, contamination, disgust, discomfort, and arousal value of all (T1) images by image category (neutral, threat, contamination, disgust), along with results of pairwise comparisons of the categories.

Note. The results are from an independent sample of university students (n = 20) that rated the images on a 7-point Likert-type scale (see main text for details). Means with different superscripts are significantly different (p < .05).
Attentional blink task
Twenty images were shown on each trial in an RSVP stream for 100 ms each at the center of a black screen. The size of each image was 1,024 × 768 mm2. Viewing distance was approximately 70 cm. A randomly chosen disgust, contamination, neutral, or fear-related image (T1) appeared in position x to x in the stream (randomly determined). The discrimination target (T2) (the second, fifth, or eighth image following T1 or 200, 500, or 800 ms later) was an image of landscapes or people that had a small gray square in the middle with a green circle on either the left or the right (Figure 1). Other images on each trial were of landscapes or people. The task was programmed in C using the Vision Shell PPC library and presented on a 75-Hz Cathode Ray Tube screen controlled by a 400-MHz G4 Apple computer (Apple Inc.). Participants pressed “4” or “6” on the keyboard to indicate whether the green circle was on the left or right side of the square. Participants finished a 10-trial practice run before completing two blocks of 100 trials with a short break between blocks. A random without replacement procedure ensured that the number of trials of each type was roughly equal.

The emotional attentional blink task with distracting stimuli and the discrimination task. Actual stimuli are not shown in the figure.
Questionnaires
Background questionnaire
A short background questionnaire was constructed to obtain information about participant’s gender, age, education, and whether they had ever received a professional diagnosis of attention-deficit disorder.
Padua Inventory-WSUR
The PI-WSUR (Burns, Keortge, Formea, & Sternberger, 1996) is a self-report measure of obsessive and compulsive symptoms, consisting of five subscales. Only the 10-item subscale measuring contamination obsessions and washing compulsions was used. Each item is rated on a 5-point scale ranging from 0 (not at all) to 4 (very much). The PI has shown strong reliability and validity (Burns et al., 1996; Grabill et al., 2008) as does the Icelandic translation (Jónsdóttir & Smári, 2000; Ólafsson, Emmelkamp, et al., 2013). Note, importantly, that the PI was administered twice, the second time on the day of testing, which determined whether participants were assigned to the HCF or LCF group.
Dimensional Obsessive–Compulsive Scale
The Dimensional Obsessive–Compulsive Scale (DOCS) (Abramowitz et al., 2010) contains 20 items with 5 items measuring severity of each of the following four symptom dimensions: (1) contamination and cleaning; (2) responsibility for harm, injury, or bad luck; (3) unacceptable thoughts; and (4) symmetry, completeness, and exactness. The items are rated on a 5-point scale ranging from 0 to 4. The measure has good psychometric properties (Abramowitz et al., 2010; Wheaton, Abramowitz, Berman, Riemann, & Hale, 2010). The Icelandic translation of the DOCS has good psychometric properties in both student and clinical samples (Ólafsson, Arngrímsson, et al., 2013; Ólafsson et al., 2016).
Obsessive Compulsive Core Dimension Questionnaire
The Obsessive Compulsive Core Dimension Questionnaire (OC-CDQ) (Summerfeldt, Kloosterman, Antony, & Swinson, 2014) is a 20-item self-report questionnaire measuring the two hypothesized core motivational dimensions underlying OCD symptoms: incompleteness and harm avoidance. Incompleteness is an urge to correct feelings of dissatisfaction regarding the need for flawless/perfect experiences or to feel “just right” and harm avoidance is the tendency to avoid harm and the need to prevent it. OC-CDQ has good psychometric properties (Summerfeldt et al., 2014).
State Trait Anxiety Inventory–Trait
The State Trait Anxiety Inventory–Trait (STAI-Trait) (Spielberger, Gorsuch, Lushene, Vagg, & Jacobs, 1983) was used to measure trait anxiety. The STAI-Trait is a brief self-report instrument consisting of 20 statements describing how people generally feel, which are rated on a 4-point frequency scale. The STAI-Trait generally has satisfactory psychometric properties (Barnes, Harp, & Jung, 2002), as does the Icelandic translation of the questionnaire (Bjarnadóttir & Sigurðardóttir, 2011; Einarsdóttir & Sigurðardóttir, 1991).
Disgust Propensity and Sensitivity Scale-Revised (DPSS-R)
The DPSS-R (van Overveld, de Jong, Peters, Cavanagh, & Davey, 2006) was used to measure disgust propensity (the tendency to experience disgust frequently) and disgust sensitivity (negative reactions to experiences of disgust). Each item is scored on a 5-point Likert-type scale. The Icelandic translation has good psychometric properties (Ólafsson, Emmelkamp, et al., 2013; Steinarsson, 2014).
Attentional Control Scale
The Attentional Control Scale (ACS) (Derryberry & Reed, 2002) is a self-report questionnaire measuring two dimensions of attentional control: attentional focusing (10 items) and attentional shifting (10 items). The Icelandic translation has good psychometric properties (Ólafsson et al., 2011). Following the recommendations of Ólafsson et al. (2011), the total score was computed by summing 19 of the 20 items of the scale.
State affect during experimental testing
A short self-report questionnaire was constructed to measure potential changes in affect following the attentional blink task. This questionnaire was modelled after the Positive and Negative Affect Schedule (Watson, Clark, & Tellegan, 1988), which measures momentary positive and negative affect. The questionnaire contained 12 items, 8 measuring negative affect (anger and irritation, disgust and repulsion, fear and anxiety, depression, and feeling down) and 4 measuring positive affect (elation, joy, pleasure, and happiness). Each item was rated on a 4-point scale ranging from not at all or very little (1) to very much (4). Scores were computed separately for each of the four negative affective states (anger/irritation, disgust/repulsion, anxiety/fear, depression/feeling down) as well as total scores for negative and positive affect, by summing up the relevant items and dividing by the total number of items.
Procedure
The study was reported to the Data Protection Authority of Iceland and approved by the National Bioethics Committee. Upon arrival, participants gave written informed consent after receiving information about the study and then completed the self-report questionnaires (STAI-T, PI-WSUR, DOCS, OC-CDQ, DPSS-R, ACS). Participants then answered the state affect questionnaire followed by the attentional blink task. Participants filled in the state affect questionnaire the second time, after task completion.
Statistical analyses
SPSS version 24 (IBM) was used for all statistical analyses. No differences were expected in response accuracy between Lags 5 and 8. To test the hypothesized drop in accuracy at earlier but not later lags with higher statistical power, analyses of variance were carried out by collapsing data across Lags 5 and 8, using lag as a two-level factor (Lag 2 vs. Lag 5+ Lag 8).
Results
Participant characteristics
Overall mean age was 31.3 (12.0) in the LCF group (n = 17) and 27.5 (8.1) in the HCF group (n = 15). This difference was not significant (Table 2).
Descriptive statistics and group difference for questionnaire measures at baseline.

Note. HCF = high contamination fear; LCF = low contamination fear; SD: standard deviation; PI = Padua Inventory; ACS = Attentional Control Scale; DOCS = Dimensional Obsessive Compulsive Scale; DPSS-R = Disgust Propensity and Sensitivity Scale–Revised; OC-CDQ = Obsessive compulsive core dimension questionnaire; STAI-T = State Trait Anxiety Inventory–Trait; ANOVA: analysis of variance. F-values are from one-way ANOVAs with group as factor.
*p < .05; **p < .01; ***p < .001.
Table 2 shows means and corresponding SDs of questionnaire scores for the two groups. A significant difference between the HCF and LCF groups was found on the PI contamination subscale (on the testing day), disgust sensitivity, and core dimensions of OCD pathology. ACS did not differ significantly between the groups. Although the two groups did not differ in trait anxiety (STAI), state negative affectivity at baseline was significantly greater in the HCF group.
Accuracy on the attentional blink task
We predicted that response accuracy would be lower for the HCF group following contamination- and disgust- but not threat-related pictures when compared to neutral pictures. Additionally, we expected this to be observed to a larger degree at Lag 2 than later lags in the attentional task. Aggregating over later lags in the task (Lags 5 and 8), a 2 (HCF vs. LCF group) × 2 (Lag 2 vs. Lags 5 and 8) × 4 (type of image: neutral, threat, contamination, disgust) mixed analysis of covariance (ANCOVA) was conducted. Because the groups differed in baseline negative affectivity, state negative affect scores were added as a covariate. The main effects of image type (F(3, 87) = 1.00, p = .395, partial η2 = .033) and lag (F(1, 29) = 1.24, p = .276, partial η2 = .041) were not significant, but the main effect of group was significant (F(1, 29) = 8.96, p = .006, partial η2 = .236), indicating that overall accuracy was lower for the HCF (estimated marginal mean = 72.8%; standard error [SE] = 3.7%) than the LCF group (estimated marginal mean = 88.1%; SE = 3.5%). The lag by group interaction was significant (F(1, 29) = 5.49, p = .026, partial η2 = .159) and the image by lag by group interaction was marginally significant (F(3, 87)= 2.29, p = .08, partial η2 = .073).
Because our primary hypothesis concerned group differences at Lag 2, we investigated this three-way interaction further. A mixed-design ANCOVA of response accuracy at Lag 2 showed a significant main effect of group (F(1, 29) = 10.4, p = .003, partial η2 = .264), but the main effect of image type was not significant (F(3, 87) = .79, p = .500, partial η2 = .027). More importantly, the group by type of image interaction was also significant (F(3, 87) = 3.09, p = .031, partial η2 = .096). Simple within-subjects contrasts showed that this interaction (see Figure 2) was significant when we compared differences in accuracy between neutral and disgust images (F(1, 29) = 5.35, p = .028, partial η2 = .156) but not neutral and threatening images (F(1, 29) = .243, p = .626, partial η2 = .008) nor neutral and contaminating images (F(1, 29) = .290, p = .294, partial η2 = .010). Thus, discrimination accuracy drops significantly following disgust-related compared to neutral images for the HCF group at Lag 2 (t(14) = 2.79, p = .015) but not the LCF group (t(16) = 0.81, p = .428; Figure 2).

Response accuracy (%) at Lags 2, 5, and 8 by image type and group (HCF and LCF) on the emotional attentional blink task. Bars represent SEs. HCF: high contamination fear; LCF: low contamination fear; SE: standard error.
We also calculated scores for differences in response accuracy when comparing threat-, contamination-, and disgust-related images to neutral images and then computed the correlations between these scores and self-report measures of disgust sensitivity and attentional control within each group. No correlation coefficients were significant, indicating that any changes in T2 accuracy following emotional distractors compared to neutral ones were unrelated to sensitivity to disgust and levels of attentional control.
For exploratory purposes, mixed-design ANCOVAs were calculated for response accuracy at later lags (Lags 5 and 8 combined and separately). The main effect of group was significant in all analyses (p < .05 in all cases), but the main effect of image type and the group by image type interactions were not (p > .10 in all cases). The HCF group was less accurate at all lags (Figure 2).
Changes in state affectivity following the task
The results of a 2 (time: pre vs. post task) × 2 (group: LCF vs. HCF) mixed analysis of variance (ANOVA) showed a significant main effect of time (F(1, 30) = 7.97, p = .008, partial η2 = .210), group (F(1, 30) = 10.5, p = .003, partial η2 = .260), and a significant time by group interaction (F(1, 30) = 7.31, p = .011, partial η2 = .196). This interaction is shown in Figure 3. Negative affect increased in the HCF group (t(14) = −2.714, p = .017) during the attentional blink task, while affect was unchanged for the LCFs (t(16) = −0.212, p = .835).
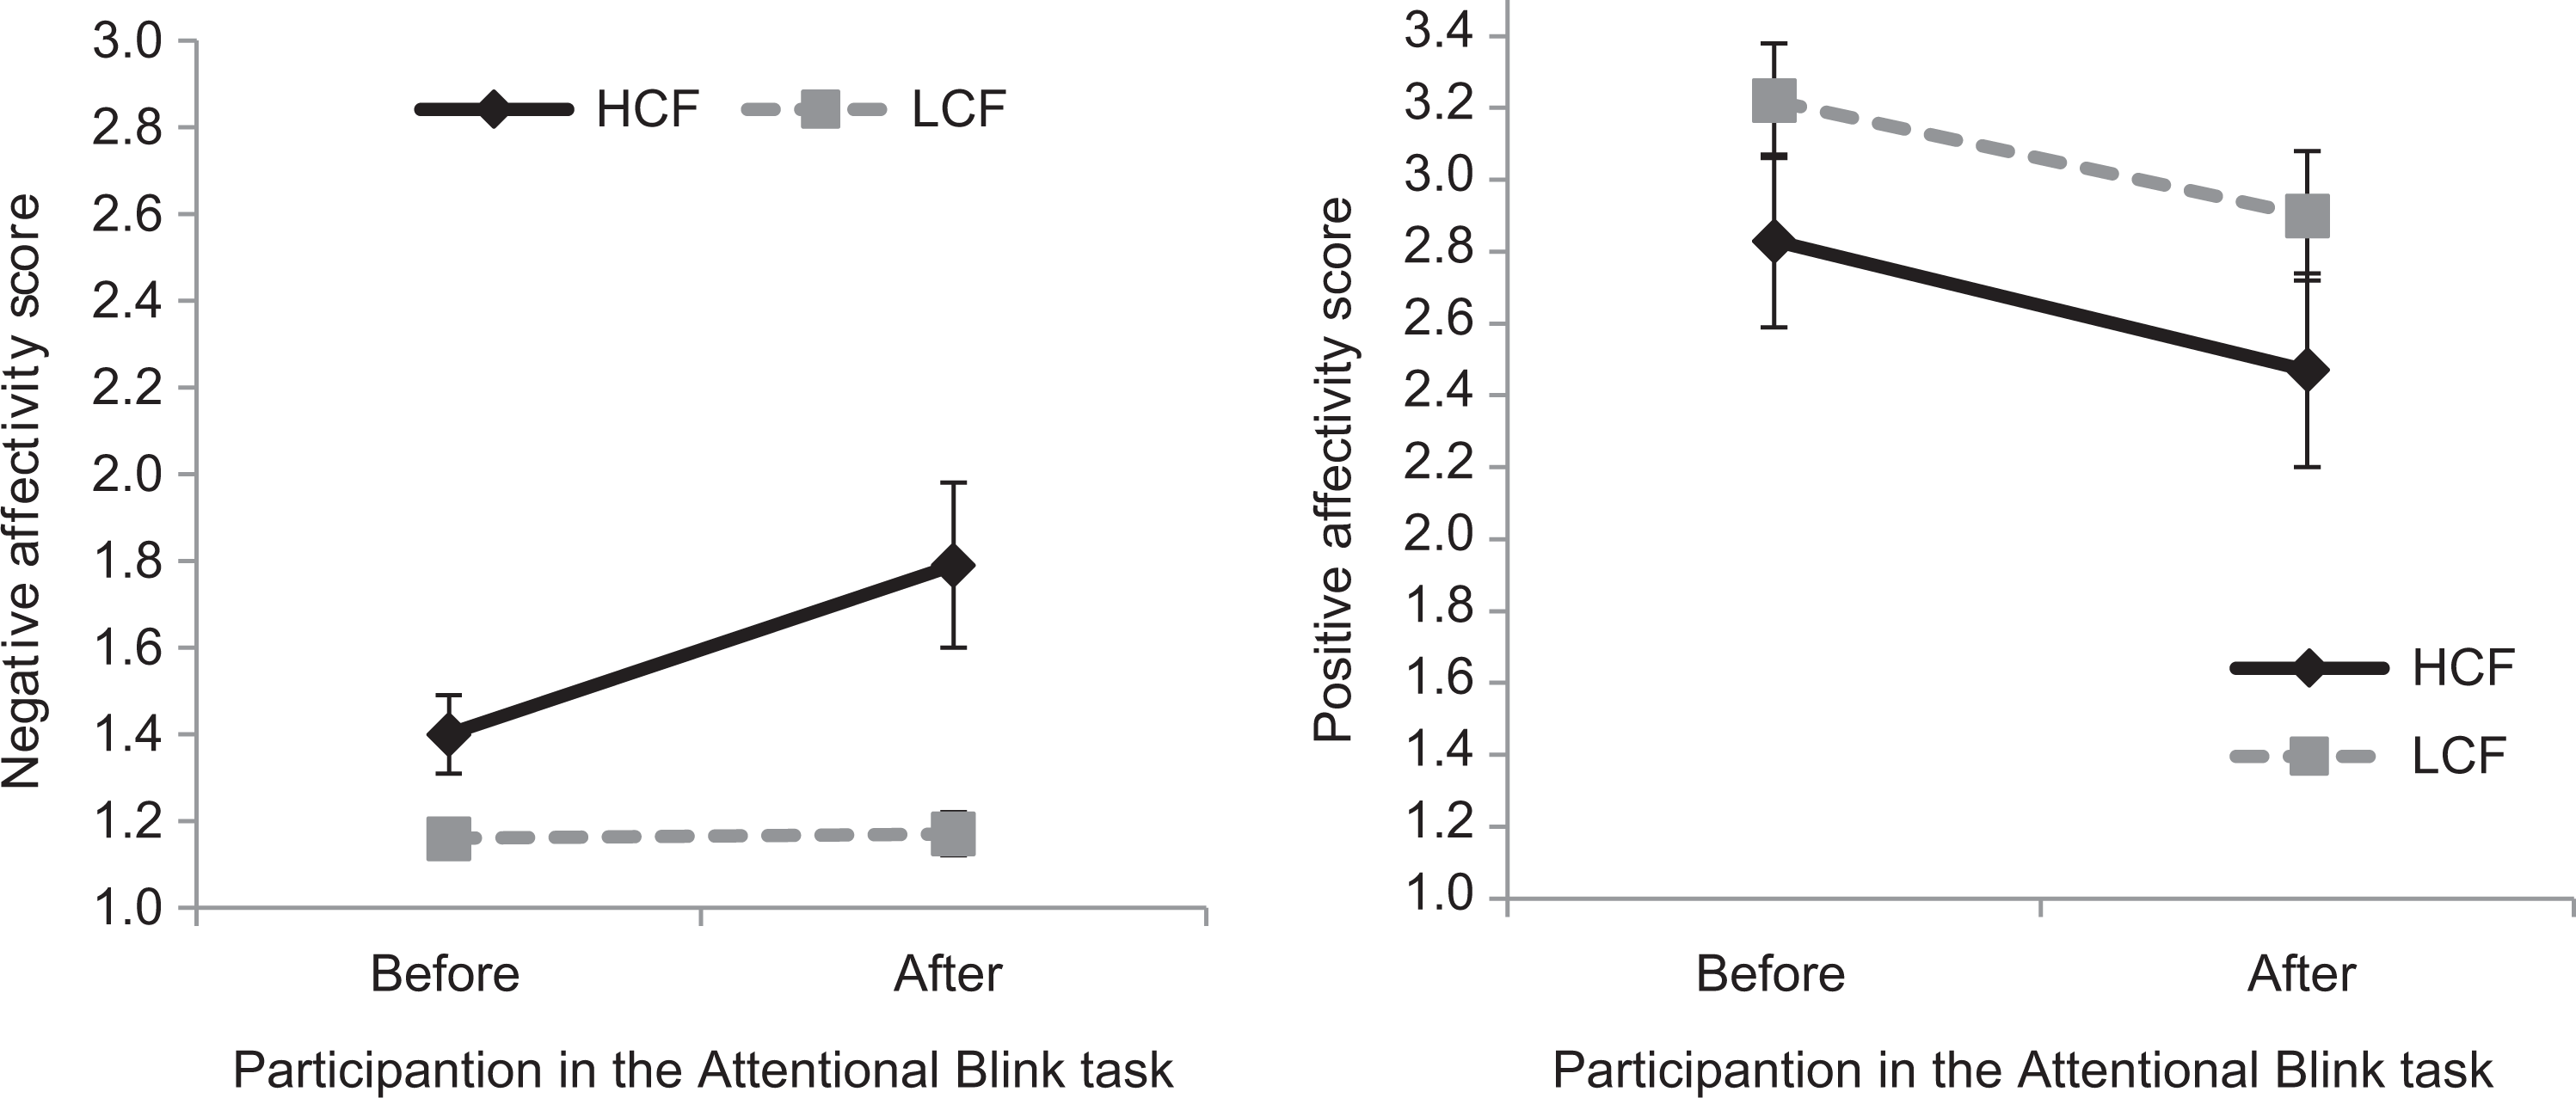
Negative (left) and positive (right) state affectivity in the HCF and LCF groups before and after participation in the emotional attentional blink task. Bars represent SEs. HCF: high contamination fear; LCF: low contamination fear; SE: standard error.
Similar analyses were carried out for changes in positive affect. The results of a 2 (time: pre vs. post task) × 2 (group: LCF vs. HCF) mixed ANOVA showed a significant main effect of time (F(1, 30) = 9.24, p = .005, partial η2 = .235) but not of group (F(1, 30) = 2.17, p = .152, partial η2 = .067) nor the time by group interaction (F(1, 30) = .04, p = .851, partial η2 = .001). Positive affect decreased in both groups during the task (Figure 3).
Contamination fear correlated with increases in negative affect, r = .642, p = .007, and reductions in positive affect, r = −.628, p = .009, for the HCF group but neither with changes in negative (r = .187, p = .472) nor positive (r = −.098, p = .710) affect in the LCF group.
Discussion
Our aim was to study attention bias toward contamination- and disgust-evoking stimuli with the emotional attentional blink in a sample defined by different levels of contamination fear. Because studies show that the emotional blink is strongest immediately following the distractor and with little or no effect observed after 500 ms (e.g., Dux & Marois, 2009; Kristjánsson & Nakayama, 2002; Luck et al., 1996; McHugo et al., 2013), we expected a drop in response accuracy following disgust- and contamination-related images at the earlier lag in HCF participants.
This prediction received partial supported in the data. An omnibus analysis of variance revealed a marginally significant interaction (p = .08) between group, type of stimuli, and lag, reflecting significantly lower accuracy for disgust-related T2s at Lag 2 for participants with HCF. This suggests an attentional bias toward disgust-related material that is visible at 200 ms following the presentation of disgust-related pictures. This significant drop in disgust-related response accuracy is tentative, given it was a part of an interaction at the trend level. However, it was in accordance with our hypothesis of an attention bias with fast inhibitory effect on attentional processing of disgust-related material. Our results suggest that disgust-related biases may be activated very quickly, reflecting automatic rather than strategic information processing, although this needs to be replicated in future studies using the AB task.
Attentional bias toward disgust is consistent with difficulties in disengaging attention from disgust-related material found by Armstrong et al. (2010) and Cisler and Olatunji (2010). However, disengagement difficulties were also observed with frightening/fearful material in both of these studies, suggesting that participants experienced difficulties in disengaging attention from negative emotional material in general (see also Morein-Zamir et al., 2013). Our study is the first to suggest that attentional bias related to fear of contamination may be more specific and particularly pronounced for disgust-related material. Olatunji and colleagues (2011) did not find any evidence of impairments at T2 following disgust images in an emotional AB task. Crucially, disgust-related stimuli in their study may not have been relevant for all participants, who were OCD patients with various symptom types.
Notably, the HCF group was overall less accurate on the attentional blink task than the LCF group, but lower overall OCD-related response accuracy was not observed in Olatunji et al. (2011). While we do not have a clear explanation for this, the nonspecificity of this difference regarding stimulus type may indicate that participants high in contamination fear may generally be more distractible and have more trouble focusing on a task that involves stimuli pertinent to contamination fear. It is possible that the influence of lag may have been overshadowed by this relatively strong main effect of group, since no main effect of lag was observed. However, as noted earlier, accuracy dropped at Lag 2 following disgust images.
Attentional bias toward contamination-related stimuli has been seen before, but this was not the case here. This bias has appeared as greater vigilance for contamination during tracking of eye movements when viewing pictorial material (Armstrong et al., 2012) or contamination-related words on a dot-probe task (Tata et al., 1996) and as longer color naming latencies on a modified Stroop task (Foa et al., 1993). It is possible that bias toward contamination-related material depends on the type of stimuli and task that is used. Also, our experimental task may not have evoked a strong enough sense of contamination and a more vivid or realistic stimulus that affects the core of contamination fear may be needed to reliably evoke a feeling of having been polluted or infected.
Additional value to our study is reflected in the observed changes in participants’ affect following the attentional task. There were increases in negative affect for the HCF, but not the LCF group following the task. It could be argued that the observed changes in participants’ affect were the result of other factors, including demands of the testing procedure or lack of motivation. Although our data do not allow us to exclude such alternative explanations, the changes in affect were observed in a relatively homogenous group of participants (i.e., university students) and were linearly related to scores on a clinically relevant measure (i.e., contamination fear). Armstrong et al. (2012) found that orienting biases toward contamination threat partly mediated the relationship between group differences in contamination fear and behavioral avoidance and stress experienced during a public restroom behavioral test. Attentional bias modification in anxiety disorders may also directly result in reduced anxiety levels post training (e.g., Amir, Beard, Burns, & Bomyea, 2009). We found increased affect reactivity following the attentional task in participants with contamination fear. Future studies will have to address whether such reactivity induces greater behavioral avoidance in clinically relevant situations.
We note some caveats. Our sample was small and consisted almost exclusively of female university students. These findings should be extended to other populations and clinical populations with relevant OCD subtypes using larger samples. However, our HCF group nevertheless scored high on the DOCS (M = 24)—their scores were closer to clinical (M = 30–32) than normal populations (M = 10–14) (Ólafsson et al., 2016). Our results are also informative, given the lack of studies on OCD-related attentional bias using (emotional) attentional blink tasks that may be a more sensitive measure (e.g., Sigurjónsdóttir, Sigurðardóttir et al., 2015) and tap unique aspects of such biases (e.g., Onie & Most, 2017). Although our results suggest that attention bias related to disgust occurs at earlier stages of information processing than has typically been found in OCD, the study cannot determine whether attention bias causes or maintains contamination fear or vice versa (see, e.g., Van Bockstaele et al., 2014). This needs to be addressed in future studies.
Finally, research on attentional bias has informed developments of attentional retraining procedures to be used in variety of emotional disorders (e.g., Amir et al., 2009; Amir, Weber, Beard, Bomyea, & Taylor, 2008; Koster, Fox, & MacLeod, 2009; Najmi & Amir, 2010), although evidence for the effectiveness is not unequivocal and rewarding attention shifts may have a larger influence on dysfunctional attentional biases (Sigurjónsdóttir, Björnsson, Ludvigsdóttir, & Kristjánsson, 2015). There is evidence to suggest that the attentional blink task is sensitive to mood (e.g., Rokke, Arnell, Koch, & Andrews, 2002; Trippe, Hewig, Heydel, Hecht, & Miltner, 2007) and personality variables (e.g., Wang et al., 2016). Given the present results, together with recent findings (Sigurjónsdóttir, Sigurðardóttir, et al., 2015; Sigurjónsdóttir et al., 2019), future studies should explore the possible utility of the (emotional) AB for measuring anxiety-related changes following attention bias modification interventions. The present results support the continued use of the AB task in future studies of attentional biases in emotional disorders.
Footnotes
Declaration of Conflicting Interests
The author(s) declared no potential conflicts of interest with respect to the research, authorship, and/or publication of this article.
Funding
The author(s) received no financial support for the research, authorship, and/or publication of this article.