
Abstract
Attentional bias variability may be related to alcohol abuse. Of potential use for studying variability is the anticipatory attentional bias: Bias due to the locations of predictively-cued rather than already-presented stimuli. The hypothesis was tested that conflicting automatic associations are related to attentional bias variability. Further, relationships were explored between anticipatory biases and individual differences related to alcohol use. 74 social drinkers performed a cued Visual Probe Task and univalent Single-Target Implicit Associations Tasks. Questionnaires were completed on risky drinking, craving, and motivations to drink or refrain from drinking. Conflict was related to attentional bias variability at the 800 ms Cue-Stimulus Interval. Further, a bias related to craving and risky drinking was found at the 400 ms Cue-Stimulus Interval. Thus, the selection of attentional responses was biased by predicted locations of expected salient stimuli. The results support a role of conflicting associations in attentional bias variability.
Attentional biases can be described as automatic effects on the selection of information for entry into working memory and influence on response selection (Cisler & Koster, 2010; Field & Cox, 2008; Koster, Crombez, Van Damme, Verschuere, & De Houwer, 2005). While attentional biases are usually measured in response to the presentation of salient stimuli, as for instance in Dot-Probe, or Visual Probe Tasks (Cox, Fadardi, Hosier, & Pothos, 2015; Field & Cox, 2008; Field, Mogg, & Bradley, 2005; Mogg, Field, & Bradley, 2005; C. E. Wiers et al., 2016), anticipatory processes may also play a role in attentional biases. That is: If an individual has learned that a certain type of stimulus is likely to appear at a certain time or location, then this foreknowledge may evoke biases in pre-stimulus preparation (Le Pelley, Vadillo, & Luque, 2013; Luque et al., 2016; Notebaert, Crombez, Van Damme, De Houwer, & Theeuwes, 2011; Van Damme, Crombez, Hermans, Koster, & Eccleston, 2006). Automatic shifts in attention to or away from upcoming stimuli would be driven by their predicted outcomes, i.e. the consequences of making the shift, if and when the stimulus occurs. This is interesting, first, from the perspective of theories of reflective cognition in which cognitive responses are selected based on their reinforcement (de Wit & Dickinson, 2009; Gladwin & Figner, 2014; Gladwin, Figner, Crone, & Wiers, 2011). Such anticipatory attentional processes could be related to disorders such as addiction, similarly to attentional biases due to actually-presented stimuli. However, as yet such relationships are to our knowledge largely unknown. Second, predictive cues are methodologically attractive. Due to the use of arbitrary, visually neutral cues that can be randomized over participants, confounding effects due to differences in visual features between the items in different categories are excluded; biases are due purely to anticipatory effects, without influences arising from actual stimulus presentation; and variability due to differences between items from the stimulus categories is removed.
This latter feature is particularly interesting when studying attentional bias variability (ABV). ABV is a relatively novel measure of within-subject variability in attentional bias, reflecting fluctuations in biases rather than a consistent direction of bias. This was originally studied in the context of anxiety and PTSD (Iacoviello et al., 2014; Naim et al., 2015; Zvielli, Bernstein, & Koster, 2014). Risky drinking has been found to be related to increased ABV for alcohol stimuli (Gladwin, 2016). It is important to better understand ABV, as an interesting phenomenon in itself, but also as it might be necessary to consider for testing manipulations aimed at attentional biases and for clinical goals such as outcome prediction. ABV could hypothetically arise from conflicting influences on (cognitive) action selection. It has been previously noted that individuals may have ambivalent motivational associations, such as both approach and avoidance tendencies, or evaluating stimuli as both appetitive and aversive (e.g., Field et al., 2016). Such ambivalence has been observed by considering temporal dynamics. Note that after the occurrence of a stimulus, processes or memory representations become activated or inhibited with a certain time course – some processes may be activated quickly and strongly but briefly, while others take longer to develop but stay active more persistently. If the selection of (behavioural or cognitive) responses depend on the pattern of activation at a given point in time, simply varying the time point at which responses are executed or assessed could determine whether those responses reflect “automatic” or “controlled” processes. Such dynamics may play an essential role in the interplay between automatic and reflective processes from various theoretical perspectives (Cunningham, Zelazo, Packer, & Van Bavel, 2007; Gladwin & Figner, 2014; Gladwin et al., 2011). In alcohol research, biases related to risky drinking can reverse depending on precise timing parameters, flipping from approach to avoidance (Noël et al., 2006; Townshend & Duka, 2007; Vollstädt-Klein, Loeber, von der Goltz, Mann, & Kiefer, 2009), indicating that both approach and avoidance associations are present. Thus, within the same participant there may be processes drawing attention towards a salient stimulus, and processes moving attention away from the same stimulus. If these processes overlap in time, then which process is dominant versus inhibited may vary over trials, resulting in increased ABV. The primary aim of the current study was to test this hypothesis for alcohol-related ABV.
To this aim, a cued Visual Probe Task (cVPT) was used (Figure 1), in which trials were divided into Picture and Probe types. On Picture trials, pairs of abstract cues were replaced by alcoholic and non-alcoholic images. The cues predicted at which locations the stimuli belonging to the different categories would appear. On Probe trials, probe stimuli appeared at the cued locations instead of the pictures, and participants had to respond to the probe. This allowed scores reflecting anticipatory attentional biases due to the predicted picture locations to be measured. The task was designed to remove some sources of noise from the calculation of ABV from these bias scores, by never repeating responses or stimulus locations from trial to trial (see Methods for details). Bias scores and ABV were related to conflict involving ambivalent associations, defined using separate univalent Single-Target Implicit Association Tests (STIATs). These tests are categorization tasks in which multiple categories are mapped to a single response key, leading to interference when the mapping is incongruent with the memory association between categories (De Houwer, Teige-Mocigemba, Spruyt, & Moors, 2009; Greenwald, McGhee, & Schwartz, 1998). Risky drinking has been related to associations between alcohol and approach (Ostafin & Palfai, 2006; Palfai & Ostafin, 2003; Thush & Wiers, 2007), which may also mediate effects of approach-avoidance retraining for alcoholism (Gladwin et al., 2015). It has been argued that effects on alcohol-valence associations (Houben, Nosek, & Wiers, 2010; Houben, Rothermund, & Wiers, 2009; R. W. Wiers, van Woerden, Smulders, & de Jong, 2002) may involve conflicting, i.e. both negative and positive, associations with alcohol (den Uyl, Gladwin, & Wiers, 2014). Using univalent STIATs allows these bipolar associations to be separated (Dickson, Gately, & Field, 2013), so that an individual could have high scores on both alcohol-positive and alcohol-negative associations simultaneously. These scores were transformed to ambivalence scores to operationalize the hypothesis of a relationship between conflict and ABV.
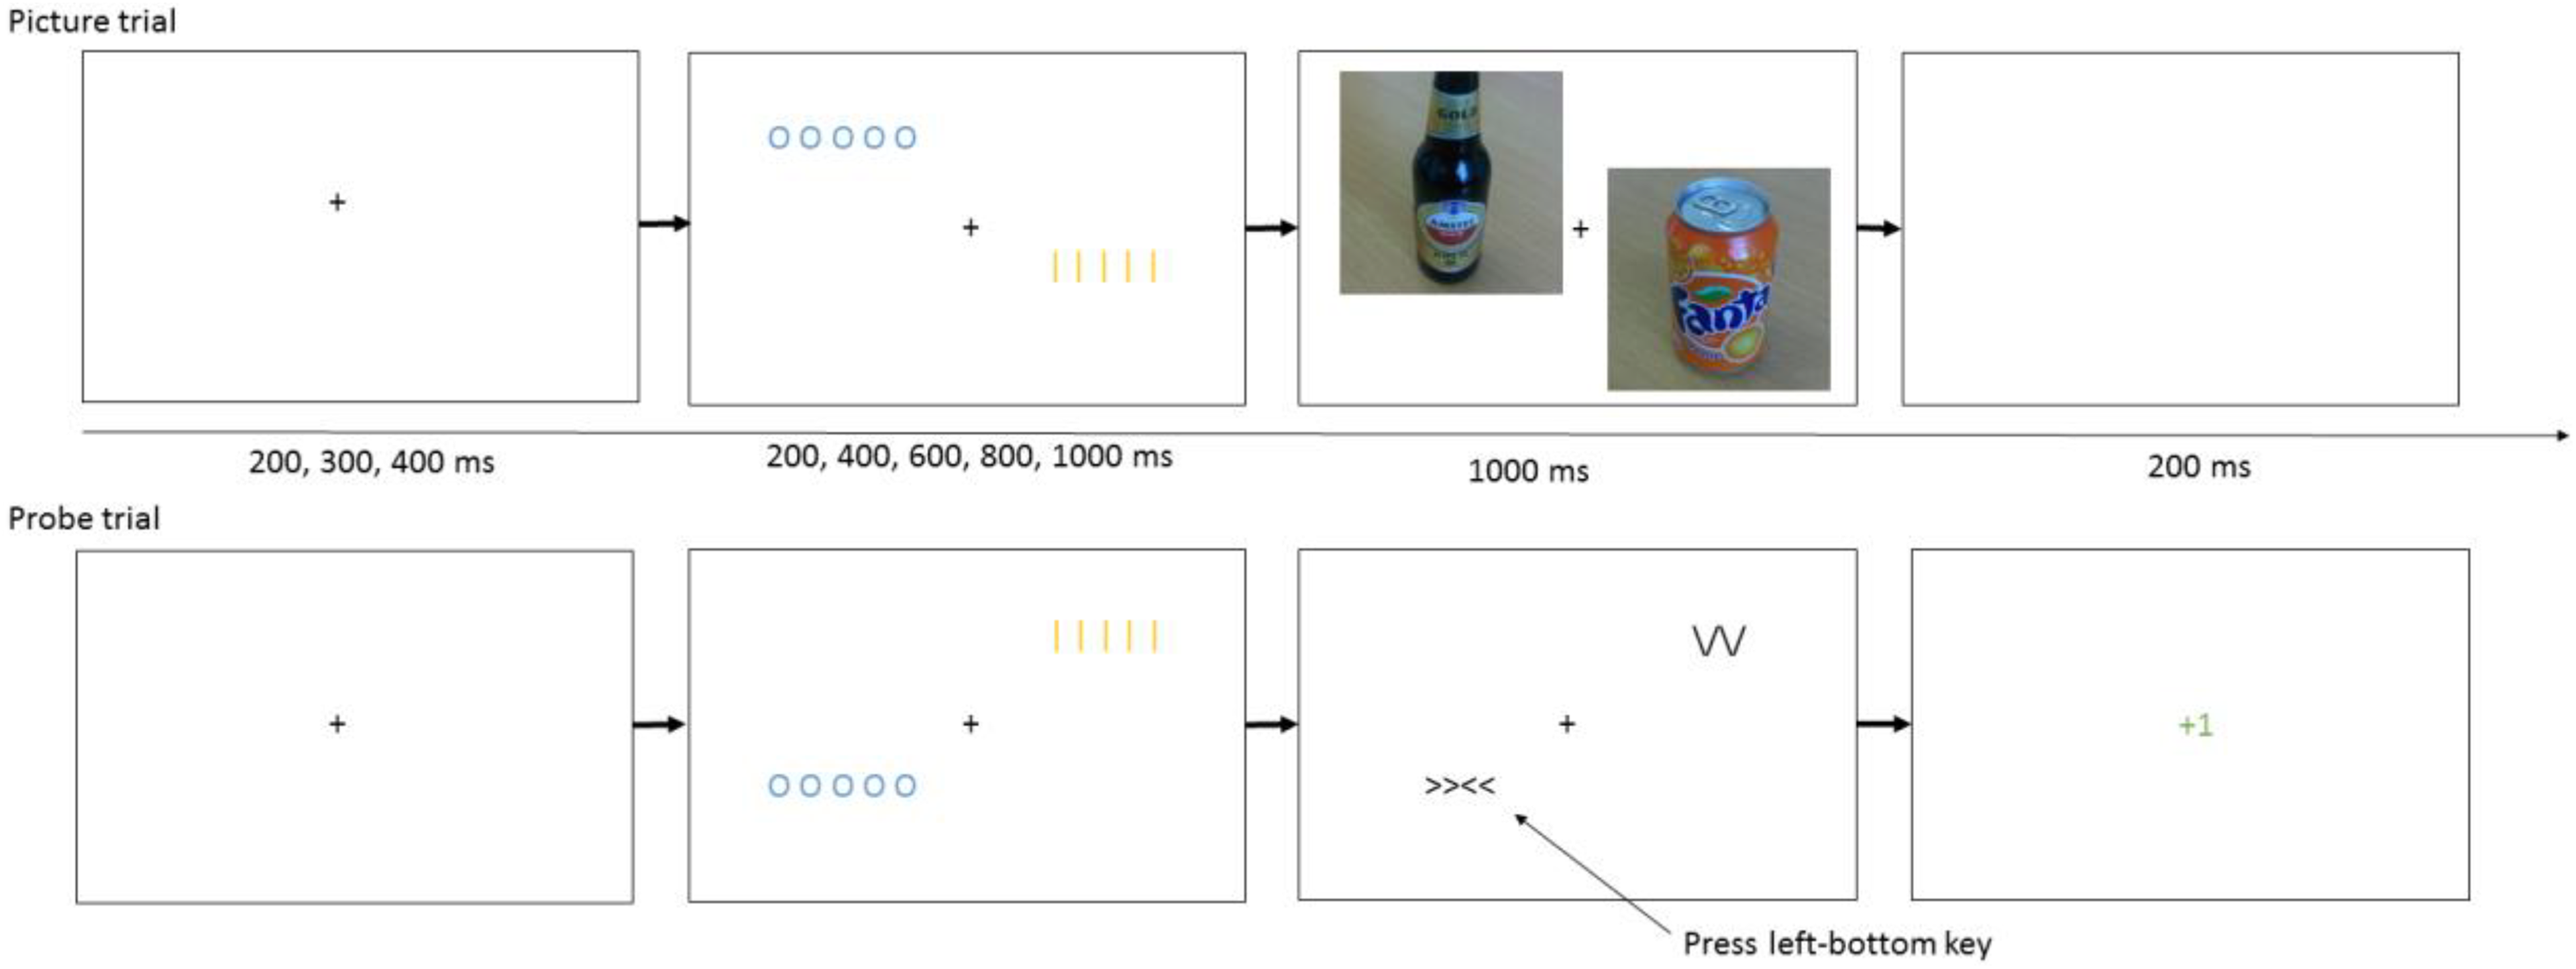
Illustration of the Anticipatory Attentional Bias Task
Further, as discussed above it is possible that effects on attentional biases are strongly dependent on the timing of probe stimuli relative to preceding cues. Based on previous research involving reactive attentional bias (i.e., evoked by the occurrence of a stimulus rather than by a predictive cue as in the current study) discussed above, effects involving an approach bias could be expected to occur at shorter Cue-Stimulus Intervals (CSIs) and avoidance at longer CSIs, and effects involving ABV could be expected around 600 ms. However, effects involving anticipatory biases could well involve different temporal dynamics, so that no strong specific predictions are possible. Therefore, in the current task a range of intervals were used between the presentation of cues and probe stimuli.
A secondary aim was to explore whether the anticipatory attentional bias was related to risky drinking and various motivations to drink or to refrain from drinking. While not the primary aim of the study, these analyses could indicate the type of psychological process involved with the bias and provide a first step and clear predictions for future studies.
Methods
Subjects
74 healthy adult participants (60 female, 14 male, mean age 21,
Materials
The online questionnaires and tasks were programmed in JavaScript, PHP, CSS and HTML; the code is available on request.
Questionnaires
The following questionnaires were used to measure hazardous drinking, craving, and motivational factors related to drinking and refraining from drinking. The 3-item Alcohol Use Disorders Identification Test - Consumption, AUDIT-C, is a brief but validated measure of hazardous drinking (Bradley et al., 2007; Bush, Kivlahan, McDonell, Fihn, & Bradley, 1998; Gordon et al., 2001; Gual, Segura, Contel, Heather, & Colom, 2002). Scores above 3 on the AUDIT-C are considered to reflect risky drinking (Bradley et al., 2007; Bush et al., 1998). The AUDIT-C score is the sum of the three items, each of which was scored as 0 through 4 so that the range of the scale is 0 through 12. Cronbach’s alpha in the current sample was .83.
Motives to drink were assessed using the Drinking Motives Questionnaire Revised, DMQ-R (M. L. Cooper, 1994). This questionnaire provides four subscales, reflecting a two-dimensional model of drinking motives with axes positive-negative and internal-external (Cox & Klinger, 1988): Enhancement, drinking to obtain internally generated positive reinforcement such as positive mood or well-being; Social, drinking to obtain externally generated positive reinforcement such as social rewards; Coping, drinking to reduce internally generated negative reinforcement such as the regulation of negative emotions; and Conformity, drinking to reduce externally generated negative reinforcement such as social rejection. Each subscale is the sum of five items, each of which was scored as 1 through 5 so that the range of each subscale is 5 through 25. Cronbach’s alpha in the current sample was .91 for Enhancement; .89 for Social; .78 for Coping; and .76 for Conformity.
Motives to refrain from drinking were measured using the Reasons for Abstaining or Limiting Drinking questionnaire, RALD (Anderson, Grunwald, Bekman, Brown, & Grant, 2011; Epler, Sher, & Piasecki, 2009). This questionnaire provides three subscales, measuring different types of motives to refrain from drinking: Loss of Control, Adverse Consequences, and Convictions (e.g., drinking being against someone’s religion). Each subscale is the mean of the contributing items (four for Loss of Control, three for Adverse Consequences, and two for Convictions), each of which was scored as 1 through 4 so that the range of each subscale is 1 through 4. Cronbach’s alpha in the current sample was .71 for Loss of Control; .67 for Adverse Consequences; and .21 for Convictions.
Craving for alcohol was measured with the Alcohol Craving Questionnaire – Short Form, ACQ (Connolly, Coffey, Baschnagel, Drobes, & Saladin, 2009; Singleton, Henningfield, Heishman, Douglas, & Tiffany, 1995). This questionnaire provides four subscales, of different aspects of craving: Compulsivity (urges and desires in anticipation of loss of control over drinking), Expectancy (urges and desires to drink in anticipation of the positive benefits of drinking), Purposefulness (urges and desires coupled with intent and planning to drink), and Emotionality (urges and desires to drink in anticipation of relief from withdrawal/negative effect). The scores on the Purposefulness scale were reversed, mapping 1 through 7 to 7 through 1, as low rather than high scores on this scale reflect intentions and plans to drink. Each subscale is the sum of the contributing three items, each of which was scored as 1 through 7 so that the range of each subscale is 3 through 21. Cronbach’s alpha in the current sample was .55 for Compulsivity; .69 for Expectancy; .39 for Purposefulness; and .85 for Emotionality.
Participants also completed questionnaires related to mental health, which were not of interest for the current analyses but are reported here for transparency: The Buss-Perry Aggression Questionnaire (Buss & Perry, 1992), the Patient Health Questionnaire-9 for depression (Kroenke, Spitzer, & Williams, 2001), the six-item Spielberger State-Trait Anxiety Inventory (Marteau & Bekker, 1992), and the Trauma Screening Questionnaire (Brewin et al., 2002).
Univalent Single-Target Implicit Association Tests (STIATs)
Three versions of the STIAT were used. A Practice version was presented first, to familiarize participants with the task. The order of the other two STIATs, for Alcohol-Positive and Alcohol-Negative associations, was randomized.
Practice consisted of three blocks of eight trials. In the first block, participants classified words into “Bipolar” categories: Living (word set: “Human”, “Animal”, “Bird”, “Tree”) or Non-living (“Rock”, “Gold bar”, “Table”, “Brick”). The category labels were shown on the top-left and top-right side of the screen, and participants had to press the corresponding response key (F or J, respectively) when a word appeared at the center of the screen. The task continued after a response. Errors were followed by the presentation of “Incorrect” in red (500 ms). The assignment of the categories to the left versus right side was randomized per subject. In the second and third block, the “Target” category was added: Geometric (“Triangle”, “Circle”, “Square”, “Rectangle”). The Target label was shown under the corresponding Bipolar category label: In one block Living, and in the other block Non-living. Participants now also had to press the corresponding response key when a Target word appeared. The order of these final two blocks was randomized.
The Alcohol-Negative STIAT consisted of seven blocks of 24 trials each. The Bipolar categories were Alcoholic (“Beer”, “Wine”, “Heineken”, “Amstel”, “Grolsch”, “Whiskey”, “Gin”) and Non-alcoholic (“Juice”, “Tea”, “Coffee”, “Water”, “Cassis”, “Milk”, “Cola”). The first block involved only the Bipolar categories. Subsequently the Target category “Positive” (“Confident”, “Social”, “Exciting”, “Relaxing”, “Acceptance”, “Worthwhile”, “Success”) was pseudo-randomly mapped to either the Alcoholic or the Non-alcoholic response. In the Congruent blocks (Alcohol-Positive) the Alcoholic and the Positive categories are mapped to the same response key, and the Non-alcoholic category to the other response key. In the Incongruent blocks (Non-alcoholic-Positive) the Non-alcoholic and the Positive categories are mapped to the same response key, and the Alcoholic category to the other response key.
The Alcohol-Negative STIAT had the same Bipolar categories Alcoholic and Non-alcoholic. The Target category was “Negative” (“Dangerous”, “Violent”, “Boring”, “Disgusting”, “Disapproval”, “Hangover”, “Failure”). The Congruent blocks contained the Alcoholic-Negative mapping. The Incongruent blocks contained the Non-alcoholic-Negative mapping.
Cued Visual Probe Task (cVPT)
The task consisted of a short training phase (5 blocks of 24 trials), followed by an assessment phase (20 blocks of 24 trials). Trials were identical in both phases, and consisted of two types, selected randomly per trial: Picture and Probe trials.
Picture trials started with a fixation cross presented for 200, 300, or 400 ms. This was followed by the presentation of two cues, located on the top-left and bottom-right of the screen, or on the bottom-left and top-right of the screen. These diagonals on which the cues were located alternated per trial. The cues were colored blue and yellow, and consisted of the symbols O O O O O and | | | | |. The color-symbol mapping was randomized. Cues were presented for 200, 400, 600, 800 or 1000 ms. The cues were then replaced by pictures. One of the cues was always replaced by an alcoholic stimulus (a color picture of an alcoholic beverage), centered on the cue location. The other cue was always replaced by a non-alcoholic stimulus (a color picture of a non-alcoholic beverage). Pictures only showed bottles or glasses of drinks, without any scenes or people. The mapping of cues to stimulus category was randomized over subjects. The pictures were onscreen for 1000 ms, followed by 200 ms of empty screen. Participants did not have to give any response on Picture trials.
On Probe trials, the fixation and cue parts of the trial were identical. Instead of pictures appearing at the cued locations, however, a probe stimulus, >><<, was presented at one of the locations, and a distractor stimulus, /\/\ or \/\/, at the other location. The probe stimulus was presented for 1000 ms, or until a response was given. The task was to quickly and accurately press a key corresponding to the probe location whenever it appeared. The keys were FIJR, pressed with the index and middle finger of the left and right hands, mapped to the corresponding position; e.g. the R-key was mapped to top-left, and was pressed with the middle finger of the left hand. On catch trials (5% probability), no probe was presented and subjects had to refrain from pressing. This was done in order to encourage searching for the probe stimulus rather than possibly attempting to infer the probe location based on viewing a distractor stimulus at the other location. Responses were followed by 200 ms feedback depending on accuracy: a green +1 for correct responses, a red -1 for incorrect responses, and a red “Too late!” if no response was given within the 1000 ms probe presentation duration.
Procedure
Participants performed the experiment online, starting with a page with instructions and an informed consent button. The questionnaires were then filled in. The order of the DMQ and RALD was randomized per subject, so that motives to drink and not to drink were not confounded with time-on-task. This was followed by the practice phase of the cVPT. Participants filled in an awareness check: Did they think there was a relationship between cues and probe location? If so, which color cue predicted the probe location? Did they think there was a relationship between cues and pictures? If so, which color cue predicted the alcohol picture? If participants did not know the answer, they were instructed to guess. Then the full cVPT was performed, followed by a repeat of the awareness check. Finally, the STIATs were performed, with the positive and negative versions in randomized order.
Preprocessing and statistical analyses
For the STIAT and cVPT data, the first four trials of the task and the first trials per block were removed to reduce noise due to starting up task performance. For the STIAT, trials with very long reaction times of over 3000 ms were also removed (the cVPT had a limited response window so that such trials could not occur). For the STIAT, only Target trials were used for analyses, as for Bipolar categories the effect of congruence versus incongruence is confounded with being the only response mapped to a key versus being one of two responses mapped to a key.
STIAT data were analyzed using paired t-tests to compare Block types (Target on Soft Drink versus Target on Alcohol), for the dependent variables RT and accuracy separately. Ambivalence scores for the STIATs were calculated as follows. First, the Block type contrast scores (Target on Alcohol minus Target on Soft drinks) for the Alcohol-Positive and Alcohol-Negative tasks were centered, i.e. the respective means of the contrast scores over participants were subtracted. Subsequently, the product of each participant’s Alcohol-Positive and Alcohol-Negative scores was used as the ambivalence score. Ambivalence-RT and ambivalence-accuracy scores were calculated for RT and accuracy respectively. Positive values thus indicate having Alcohol-Positive and Alcohol-Negative associations in the same direction. Corrected ambivalence scores were also calculated: These scores were adjusted by regressing out variance of the ambivalence score that could be explained by the two component scores (i.e., the Block-contrast scores for the Alcohol-Positive and the Alcohol-Negative tasks).
For the cued Visual Probe Task, ABV was calculated for each CSI. ABV was calculated as follows. Pairs of trials were selected, one of which was a Non-alcohol probe location trial and one of which was an Alcohol probe location trial. The N-th pair consisted of the N-th trials with the respective Probe Location. For each pair of trials, the bias was calculated as the RT on the Alcohol probe-location trial minus the RT on the Non-alcohol probe location trial. The ABV was calculated as the variance of the bias scores over trial pairs. The ABV thus reflects within-subject variability in bias scores over the course of the task. The primary analyses of the study consisted of correlations between ambivalence scores derived from the STIATs and the ABV, for each CSI. In order to increase confidence in interpretations in terms of ambivalence, effects concerning ambivalence measures were only reported if they were significant for both the basic ambivalence measure and the corrected ambivalence measure. The criterion for significance was set at 0.005 to correct for the five CSIs and two ambivalence scores (one for RT and one for accuracy). Tests were one-sided, as the hypothesis was that ABV would increase with ambivalence.
In the secondary exploratory analyses, for the STIATs, correlations were tested between questionnaire data and contrast scores for the Block Type effect (Target on Alcohol minus Target on Soft Drink). For the cVPT, correlations between bias scores and questionnaires and STIAT effects were analyzed for each CSI separately. Bias scores were the median RT for probe-on-alcohol trials minus the median RT for probe-on-non-alcohol trials. Within-subject effects of block type for the STIATs and probe location per CSI for the cVPTs were tested with within-subject (i.e., paired samples) t-tests. These tests were two-sided, as either approach or avoidance could occur based on the literature.
For the exploratory analyses, to address the multiple testing problem, nominally significant results at a p-value of .05 are reported and additional analyses were performed in order to provide an indication of significance given the large number of tests in the secondary analyses. Permutation tests were used to determine the distribution of the number of nominally significant results at p < .005 over all tests in an analysis. Results reaching the .005 level are indicated with an asterisk. An analysis was defined as all within-subject tests and correlations related to either the STIATs or the cVPT. For 10000 iterations, subject scores were randomly permuted, and this permutation was used for one of the vectors involved in correlations. The method thus preserved the dependence between measures and allowed a p-value to be calculated for the number of nominally significant results in an analysis, similarly to methods previously used in genetics (Gladwin et al., 2012) and neuroimaging (Gladwin, Vink, & Mars, 2016; Woo, Krishnan, & Wager, 2014). A distribution of the number of significant results expected under the null hypothesis was also obtained, giving an estimate of the median number of false positive results.
Results
Descriptive measures are provided in Table 1. AUDIT-C was positively correlated with DMQ-Social (r = .63, p < .001), DMQ-Coping (r = .36, p = .0017), DMQ-Enhancement (r = .67, p < .001), ACQ-Expectancy (r = .38, p < .0001), and ACQ-Purposefulness (r = .46, p < .001). We briefly note that correlations with RALD-Loss of Control (r = -.19, p = .11) and RALD-Convictions (r = -.19, p = .098) were numerically negative as would be expected but non-significant.
Descriptive statistics for questionnaire data

ABV and Ambivalence
STIAT-ambivalence on accuracy was positively correlated with ABV at 800 ms (uncorrected: r = .46, p < .001; corrected: r = .41, p < .001) and 1000 ms CSI (uncorrected: r = 0.31, p = .0040; corrected: r = 0.30, p = .0048). The hypothesis was thus confirmed for the 800 ms CSI. The effect at 1000 ms CSI was only a trend given the correction for multiple testing.
For completeness, we report within-subject effects concerning ABV. A within-subject effect of CSI was found using repeated measures ANOVA with Greenhouse-Geisser correction (F(4, 292) = 6.0, p = .00018, eta_p⁁2 = 0.076), due to decreasing ABV over longer CSIs. No correlations with AUDIT-C, drinking motives or craving were found. Concerning positive and negative alcohol associations, a positive correlation was found between ABV at the 200 ms CSI and the Block Type effect on RT on the Alcohol-Negative STIAT (r = 0.24, p = .041).
The split-half (even-numbered versus odd-numbered blocks) Spearman’s correlations with Spearman-Brown correction were .22 for the 200 ms CSI; .063 for 400 ms; .24 for 600 ms; .39 for 800 ms; and .46 for 1000 ms.
Alcohol-Positive STIAT
For the STIAT analyses (Alcohol-Positive and Alcohol-Negative together), the number of results significant at .005 (i.e., 2) was significant (p = .039). The median number of false positives was 0.
There were no effects on RT. On accuracy, Positive-on-Alcohol blocks had lower accuracy than Positive-on-Soft drink blocks (t(73) = -3.41, p = .00011*). A correlation between the Block Type effect and AUDIT-C was found (r = .27, p = .018) due to relatively high accuracy on Positive-on-Alcohol versus Positive-on-Neutral blocks with increasing AUDIT-C scores.
Alcohol-Negative STIAT
On RT, Negative-on-Alcohol blocks were faster than Negative -on-Soft drink blocks (t(73) = -2.77, p = 0.0070). Negative-on-Alcohol blocks were more accurate than Negative-on-Soft drink blocks (t(73) = 3.038, p = 0.0033*). Negative-on-Alcohol blocks became less accurate relative to Negative-on-Soft drink blocks with increasing DMQ-Social scores (r = -0.30, p = 0.0099) and DMQ-Enhancement scores (r = -0.31, p = 0.0065). Negative-on-Alcohol blocks became more accurate relative to Negative-on-Soft drink blocks with increasing RALD-Loss of Control scores (r = 0.26, p = 0.026).
cVPT
For the exploratory cVPT analyses, the number of results significant at .005 (i.e., 4) was significant (p = .016). The median number of false positives was 0.
There were no within-subject effects.
For risky drinking, a negative correlation between Probe Location effect and AUDIT-C scores was found at the 400 ms CSI only (r = -0.33, p = 0.0046*), reflecting faster responses to probes at the Alcohol cue versus Non-alcohol cue location with increasing AUDIT-C scores.
No correlations with DMQ subscales were found. For craving, ACQ-Compulsivity was negatively correlated with bias at the 400 ms (r = -0.32, p = 0.0049*) and 1000 ms (r = -0.25, p = 0.029) CSI. ACQ-Expectancies was negatively correlated with bias at the 400 ms (r = -0.23, p = 0.047), 600 ms (r = -0.24, p = 0.039), and 1000 ms (r = -0.34, p = 0.0031*) CSI. ACS-Emotionality was negatively correlated with bias at the 600 ms CSI (r = -0.24, p = 0.041). RALD-Adverse Consequences was positively correlated with bias at the 600 ms CSI (r = 0.24, p = 0.042), reflecting slower responses to probes at the Alcohol cue versus Non-alcohol cue location with increasing RALD-Adverse Consequences scores. RALD-Convictions was negatively correlated with bias at the 400 ms CSI (r = -0.23, p = 0.046).
For positive and negative alcohol associations, a positive correlation was found between bias and the Block Type effect on accuracy on the Alcohol-Negative STIAT at the 1000 ms (r = 0.27, p = 0.021) CSI. That is: Individuals with stronger Alcohol-Negative associations (i.e., positive scores on the Block Type contrast) were relatively slow to respond to probes at the alcohol location.
STIAT-ambivalence on RT was positively correlated with bias at the 200 ms CSI (uncorrected r = 0.35, p = 0.0022; corrected: r = 0.34, p = 0.0033*).
The split-half (even-numbered versus odd-numbered blocks) Spearman’s correlations with Spearman-Brown correction were .54 for the 200 ms CSI; .37 for 400 ms; .44 for 600 ms; .52 for 800 ms; and .18 for 1000 ms.
For descriptive purposes, correlations were calculated between the ‘static’ attentional bias on RT and ABV, for all 25 combinations of CSI. The two measures were only correlated at the same CSI for the 600 ms CSI (r = .28, p = .016). Further, static bias at the 200 ms CSI was correlated with ABV at the 400 ms CSI (r = .26, p = .027) and static bias at the 600 ms CSI was negatively correlated with ABV at the 200 ms CSI (r = -.29, p = .013). It did not therefore seem to be the case that static attentional bias and ABV are strongly related.
Discussion
The current study tested effects on a cued Visual Probe Task (cVPT) that aimed to measure anticipatory alcohol-related attentional biases. It was hypothesized that ambivalence in alcohol-related automatic associations is related to attentional bias variability. Ambivalence was calculated using univalent STIATs: These provided information on positive and negative alcohol-related associations that could be related to contradictory evaluative associations. Further, in exploratory analyses correlations were calculated between anticipatory attentional bias and questionnaires that measured various alcohol-related processes related to craving, motivation to drink and motivation to refrain from drinking.
The primary question was whether ABV would increase with a measure of ambivalence. This was found to be the case, at the 800 ms CSI and close to significance at 1000 ms, for accuracy-based ambivalence only. This result supports the hypothesis that bias variability reflects conflicts between contradictory influences on processes selecting cognitive functions. Further, as the effects were found only after the relatively long time delays, such conflict appears to be dependent on sufficient time elapsing since the initiation of the underlying processes (Cunningham et al., 2007; Gladwin & Figner, 2014; Gladwin et al., 2011). Notably different from the normal, non-cued Visual Probe Task in the previous study, no relationship between risky drinking and variability measures was found. This indicates that the fluctuations related to risky drinking found previously are caused by processes that were excluded in the current version of the task. This could involve the viewing of actually-presented alcohol-related stimuli, rather than processes selecting covert attentional responses to or from such stimuli. However, the presentation of stimulus pairs on alternating diagonals also excluded potential sources of variability related to repeated stimulus locations or responses.
For the cued-task analogues of typical attentional bias measures reflecting consistent tendencies affecting RT or accuracy, a number of nominally significant correlations between anticipatory attentional bias and alcohol-related individual differences were found. A bias towards alcohol was related to various aspects of craving (compulsivity, emotionality, and expectancies), and a bias away from alcohol was related to negative associations with alcohol. These effects were found most prominently at the 400 ms CSI. Such relationships between bias and craving are in line with previous research on cognitive biases and subjective craving (Field & Cox, 2008; Field et al., 2005). As the effects were found in the context of predictive cues, rather than as reactions to presented stimuli, the results support the global theoretical viewpoint that covert, cognitive responses (such as attentional shifts) are selected based on the predicted outcome of their selection (de Wit & Dickinson, 2009; Gladwin & Figner, 2014; Gladwin et al., 2011). Such processes would lead to the shifting of attention towards the location of a craved stimulus, or away from the location of a stimulus with negative associations. Motivation not to drink was found to be related to biases leading to both slower (Adverse Consequences) and faster (Convictions) responses at the Alcohol cue location. This suggests different underlying processes for these motivations, where conviction-motivations may involve a level of attraction or “forbidden fruit” temptation, while concern for adverse consequences induce a more consistent attentional avoidance. Risky drinking was only related to attentional bias on RT at the 400 ms, risky drinking being related to faster responses at the Alcohol cue location. In a previous study in which a different version of the cVPT was used (Gladwin, 2016), risky drinking was also associated with a bias towards predicted Alcohol cue locations, although at a longer CSI (1200 ms). This difference could be due to details of the task and procedure, which involved different probe stimuli and responses, did not use the diagonalized stimulus locations, and had a shorter training time that could have resulted in weaker associations between predictive cues and stimuli on Picture trials.
Although the primary aim of the univalent STIATs was to derive ambivalence measures, these tasks also provided some potentially interesting results in themselves. Participants showed overall strong negative associations, expressed in both STIATs. On the Alcohol-Positive STIAT, risky drinking was related to relatively positive associations. On the Alcohol-Negative STIAT, drinking motives played a role, with less negative automatic associations being related to Social and Enhancement motives to drink, and more negative automatic associations being related to Loss of Control motives to refrain from drinking. Such effects show that these univalent STIATs are suitable for further study. An important advantage of these tasks is in applications aimed at experimentally reducing biases. Effects on standard alcohol-valence IATs appear noisy, which has been suggested to be due to the complex effects of the combined influence of positive and negative associations (den Uyl et al., 2014). Of particular interest is the Alcohol-Positive bias, as this provides a clear target as a mediating variable for methods to reduce the bias, for instance via tDCS (den Uyl et al., 2014) or training (Gladwin et al., 2015; R. W. Wiers, Eberl, Rinck, Becker, & Lindenmeyer, 2011).
A limitation of the current study is its non-clinical and relatively small student sample of social drinkers, although this population certainly includes risky drinking and was suitable for the primary aim of the study. It would appear interesting to apply a cVPT within a clinical population and determine whether anticipatory effects predict outcome, or compare social drinkers with individuals with drinking problems. Another limitation of the exploratory part of the current study is the number of tests, which must be acknowledged to increase the overall false positive rate. We attempted to address this by differentiating nominally significant results from analysis-wise significant tests at a stricter threshold using the permutation approach. However, there are clear advantages to accepting this limitation. The current approach provides information that would be lost to meta-analyses and plans for future research with a strictly corrected threshold. Using tests per CSI rather than multivariate tests has the advantage of providing interpretable effects. These tests also reflect the fact that as the CSI factor becomes higher resolution, it becomes more like a continuous variable, similar to the time dimension in psychophysiology where data consist of signals sampled with a certain frequency. This requires a different approach than a factor with a small number of discrete levels, such as Probe Location. Further, although care must be taken in terms of spurious patterns, some findings appeared to logically agree with each other, such as the cluster of results involving craving. This is not directly reflected in statistics but increases confidence in the effects, relative to a more inconsistent set of results. Nevertheless, it is important to acknowledge that individual test results are best considered primarily in terms of clearer predictions for future studies using cVPTs until replicated. Finally, the use of an online design has advantages and disadvantages: While this technology allows efficient testing and makes work possible without a laboratory, there is less ability to control and observe the behavior of participants during the experiment. However, individuals with conspicuously insufficient performance can be excluded, as in laboratory research, and it appears that online data are not generally so noisy or abnormal as to preclude expected effects (Chetverikov & Upravitelev, 2016; van Ballegooijen, Riper, Cuijpers, van Oppen, & Smit, 2016).
There are a variety of directions for further research. Overall, the current results suggest that cued Visual Probe Tasks would be worth exploring in larger and in clinical samples. An important design choice will be the set of CSIs to test. Based on the current results, these should include at least 400 ms and 800 ms. The 400 ms CSI is of particular interest for consistent-bias measures related to craving, while the 800 ms CSI appears to be of interest for variability related to ambivalence. Another direction is the context of Attentional Bias Modification (ABM), a promising but debated method in which training tasks are used to reduce symptoms via changing automatic processes related to attentional biases (Clarke, Notebaert, & MacLeod, 2014; Cristea, Kok, & Cuijpers, 2016; Gladwin, Wiers, & Wiers, 2016; Schoenmakers et al., 2010). First, variability measures may be important to consider as a relevant training outcome, which has as yet been rarely done. Second, if fluctuations rather than consistent biases reflect addiction-relevant processes, the question is raised whether interventions should not also target variability, or noise, rather than direction of bias. Such work appears to be arising from the context of ABM, using threatening stimuli in the context of PTSD (Badura-Brack et al., 2015; Khanna et al., 2015) and in non-clinical student populations (Gladwin, 2017), and could be considered similar to previous approaches aimed at general downregulation in the alcohol context (Fadardi & Cox, 2009). In these studies, a form of Attention Control Training was used that was identical to the condition usually considered sham in ABM. That is: There was no consistent contingency being trained, but this actually appeared to normalize reactivity to salient stimuli. This may involve learning that highly salient emotional stimuli are goal-irrelevant. Notably, true random cue-probe contingencies appear to be essential: When the training contingency is inconsistent over the whole task, but there is consistency within each block (and therefore task-relevance of emotional information), this leads to worse outcomes on various measures of cue sensitivity (Gladwin, 2017). This was speculated to reflect undesirable effects on salience when the contingency is non-random, since the stimulus feature involved in training is task-relevant and therefore retains or potentially increases its salience. This problem would be avoided by using predictive cues in training tasks based on the cVPT. Another direction for future research is the use of psychophysiology. The anticipatory design of the task provides a period of measurement on each trial undisturbed by trial events or responses. Such designs allow the study of preparatory processes using, e.g. EEG (Brunia, 1993; P. S. Cooper, Darriba, Karayanidis, & Barceló, 2016; Korucuoglu, Gladwin, & Wiers, 2014). The use of abstract, initially neutral cues would provide an advantage for psychophysiological studies, by removing effects due to cue reactivity or any visual features confounded with stimulus category. Of particular interest may be measures of neural oscillations related to conflict or competition (Cohen & Donner, 2013; Gladwin & de Jong, 2005; Poljac & Yeung, 2014), that would be predicted to occur around CSIs at which variability is highest. Finally, using cVPTs as well as VPTs, and including a range of CSIs and consistency and variability measures would appear to open up new possibilities for computational modelling of attentional biases. The rich data derived from such studies would provide constraints and patterns for models to fit and thereby aid the development of theory.
In conclusion, the current design of the cVPT appears suitable for further study, including measures of awareness and an explicit training phase removing the problem of post-hoc definition of training blocks. The use of abstract predictive cues makes the task particularly suitable for studying bias variability, and a theoretically interesting result was that the data suggest that attentional bias variability reflects conflicting influences on selection processes due to conflicting associations. Previous results using a normal VPT which showed associations between bias variability and risky drinking were not found using the cVPT, suggesting that such effects involve cue reactivity rather than anticipatory or predictive processes.
Footnotes
Declaration of interest
The authors report no conflicts of interest.