
Abstract
In education, infographics may be used to promote active learning and engage learners in the creation of more diverse learning artefacts. This study aims to analyze the application of infographics in higher education. The authors conducted a scoping review of the scientific articles to analyze the use of infographics across a variety of university subjects. The findings revealed that the most frequent educational practices were those that merged both ready-made infographics and students’ hands-on experience in creating their own infographics. Such learning activities facilitated the learning of the subject-related material and helped students to advance with the creation of this popular form of modern communication. The tasks including infographics also represented an enhanced mission of higher education as students were given opportunities to develop a number of personal and career readiness skills and capabilities simultaneously, such as digital, visual and information literacy, critical thinking, creativity, communication and collaboration skills. The educational recommendations and technological solutions proposed might diversify teaching and learning practices in higher education.
Introduction
Nowadays, infographics have become prevalent in many diverse sectors. The use of this visual form has considerably increased in professional communication and social networking, for example, on Pinterest, Facebook and Twitter (Toth, 2013). In scientific communication, infographics are used to explain experiments, explore datasets, communicate findings and share knowledge in more concise and visually attractive ways (Saunders et al., 2017; Scott et al., 2017). For example, many scientific journals have started to include sections of infographics for short overviews of research articles and their findings. Moreover, infographics have been gaining increasing popularity even in résumé writing (Lee and Cavanaugh, 2016) and infographic making websites allow users to choose from a range of résumé templates (e.g. Canva, Kinzaa). Many prominent organizations worldwide include infographics as a major means of information provision on their websites (e.g. The World Health Organization). There are also some specific area-oriented (e.g. YLMSportScience for sport topics, Infographics – Compound Interest for chemistry topics) or general websites (e.g. Cool Infographics or Daily Infographic) that centre on data transmission via infographics. In this fast-paced world, individuals prefer shorter as well as quicker forms of communication and this makes infographics a popular form of communication. Given the aforementioned trends, educators can no longer neglect the need for a more frequent incorporation of infographics in higher education.
The attractiveness of infographics lies in the fact that they deliver “the maximum amount of content in the least amount of space while still being precise and clear” (Dunlap and Lowenthal, 2016: p. 42). Most importantly, they can be used as stand-alone communication tools that do not require additional search of information and are easy to disseminate (Joosten, 2012; Toth, 2013). Typically, infographics are made of two types of components, i.e. content (texts, facts, data and knowledge) and visual elements (graphics, colors, icons and signs) (Siricharoen and Siricharoen, 2015). They represent multimodal compositions for meaning making, including visual information, language, colours, layout and typography (Fragou and Papadopoulou, 2020). The design of infographics ranges from very complex sets of interactive elements to simple layouts (Lazard and Atkinson, 2015), which is easily achievable thanks to a variety of modern infographic making tools online. Whereas earlier infographics were considered as professional illustrations, the ability to create them has already become a basic digital skill (Jones et al., 2019).
The fact remains that the use of textual information and knowledge provision in written forms still dominates in formal educational settings (Kędra, 2018). As the final information and knowledge representation is usually short and simple, infographics are not considered to be common educational tools. However, the representatives of Generation Z that comprise the majority of students at universities are highly visual (Bicen and Beheshti, 2019; Fragou and Papadopoulou, 2020; Kędra, 2018) and their attention span is short (Chicca and Shellenbarger, 2018). It is therefore necessary to reconsider methods used to provide information for learning. Infographics may be used for both shorter and more visual (or multimodal) ways of information provision (Chicca and Shellenbarger, 2018; Fragou and Papadopoulou, 2020; Mocek, 2017) as well as supplement longer portions of textual information.
In higher education, infographics may be utilized for instructional purposes as students are given all necessary information at a glance, which facilitates understanding and memorization. For instance, Mocek (2017) suggested using infographic syllabus design to provide essential information, which has been proved beneficial for syllabus information retention and student engagement. However, the use of infographics for subject-related content transmission and its acquisition is more common.
Students may be provided with educational material in the form of infographics prepared by others or asked to create their own infographics. These two practices can be evaluated in terms of passive or active learning. While traditional lectures where educators seek to transmit knowledge and students are passive watchers or listeners are traditionally considered to be passive, active learning methods entail discussions, practicing what has been learned and teaching others. Considering this, cases when students are just shown infographics created by others typify passive learning. Instead, they should be engaged in the processes of their own infographic making where they can actively construct meaning. Kibar and Akkoyunlu (2017) confirmed that infographics created by students themselves made them into active creators of knowledge instead of being quiet consumers of it.
On the other hand, researchers warn about some limitations of using active learning methods because of an increased need for cognitive efforts and collaboration when tasks are done in groups. Having done a literature review on the application of active learning methods in the context of higher education, Deslauriers et al. (2019) reported that students felt an inadequate amount of learning, which was not reflected in their actual achievements. They also complained about being forced to interact with each other and assume greater responsibility for their learning (Deslauriers et al., 2019). Among the advantages of active learning, Deslauriers et al. (2019) reported the increased students’ attendance and engagement in the learning process.
The integration of infographics in higher education well aligns with other modern tenets of education too. According to reflexive pedagogy, as explained by Cope and Kalantzis (2017), educators should switch away from the focus on cognition (either asking learners to remember course material or be able to apply procedures correctly) and tasks centering on too limited types of learning artefacts. Instead, they should emphasize the processes of making diverse artefacts, which are better created by learners working in groups. Accordingly, too frequent asking of much reading of the course material and then testing students’ abilities to remember it could be replaced with tasks that require to self-choose material and create multimodal infographics based on it.
Social learning, collaborative knowledge and the need to engage students in the creation of varied learning artefacts are also emphasized in student-centered environments, the effectiveness of which has already been proved in higher education (Jonassen and Land, 2012). More specifically, student-centered environments can be characterized by: “(a) centrality of the learner in defining meanings; (b) scaffolded participation in authentic tasks and sociocultural practices; (c) importance of prior and everyday practices in meaning construction; and (d) access to multiple perspectives, resources, and representations” (Land et al., 2012: p. 8). In the process of creating infographics, university students can become active constructors of meaning. The process requires searching for suitable sources and thinking critically of what needs to be included as well as summarized in shorter ways. As a result, this may promote deeper processing of knowledge, which promotes meaningful learning (Spector et al., 2013).
While formal learning environments, starting from pre-school education, are usually characterized by the development of convergent thinking (i.e. everyone needs to get one right answer or apply the same procedure), creation of infographics might be used to develop divergent thinking and creativity. Students are usually given freedom to choose what multimodal content needs to be included and how it should be organized. As highlighted among the principles of student-centered environments, the tasks of creating infographics are also authentic as they are close to real life in a number of aspects. Importantly, they teach to use an increasingly popular communication form.
Whenever learners are given collaboration-based tasks to create infographics, this practice serves as a venue for collective knowledge creation and learning to collaborate. Considering the increasing popularity of project-based work (Cope and Kalantzis, 2017; Boss and Larmer, 2018), both aspects are highly relevant. From a cognitive perspective, learners gain access to multiple perspectives and knowledge representations, which might significantly improve the quality of infographics in comparison to the ones prepared individually. As for social aspects of collaborative tasks, students are given opportunities to develop a number of collaboration subskills, such as participation (interaction and activity in the process of learning), perspective taking (ability to view a situation through the eyes of other collaborators) and social regulation (negotiating, self-evaluation, initiative and responsibility taking) (Hesse et al., 2015).
The process of creating infographics is also related to the use of digital tools in higher education. Whenever technology is utilized just for the sake of transmission of what others know and execution of simple tasks or operations, such cases illustrate a mere increase of learners’ productivity (Jonassen, 2011; Warren and Wakefield, 2013). For example, the use of a spreadsheet to save quantitative data can illustrate this kind of practice. Instead, educational researchers and practitioners advocate for a more advanced use of technology or its use as mindtools that help to extend cognitive abilities of learners (e.g. see the collection of articles in Spector et al., 2013). More specifically, Jonassen (2000) defined mindtools as “computer-based tools and learning environments that have been adapted or developed to function as intellectual partners with the learner to engage and facilitate critical thinking and higher-order learning” (p. 9). We consider infographic tools to be mindtools because they can aid students in constructing and representing knowledge in various ways. These tools also promote critical thinking by engaging them in cognitive simplification as big portions of information are not possible in infographics. Conversely, they demand that students creatively select, summarize, and organize information to make it serve the intended purpose. Such tools might help to perform tasks in quicker and more professional ways in comparison to students working alone. Accordingly, infographic tools display the characteristics of mindtools or use of technology for a purpose that goes beyond productivity increase.
Researchers and practitioners have already reported a number of positive outcomes related to the integration of infographics in higher education. Infographics both facilitate the acquisition of the subject-related material and help learners to develop a number of real-life and career readiness capabilities and skills (Alqudah et al., 2019; Kibar and Akkoyunlu, 2017; Toth, 2013; Vanichvasin, 2013). For example, Toth (2013) observed that the tasks of creating infographics helped learners to become more creative. Alqudah et al. (2019) concluded that presenting lecture material in infographics increased students’ perception and positively affected their interaction. Overall, students were satisfied with the tasks including infographics (Siricharoen and Siricharoen, 2015).
However, considering the integration of infographics in higher education, practitioners and researchers indicate that the use of such teaching and learning tools is not very common or only in the initial stage (e.g. Alyahya, 2019; Anderson et al., 2019; Fragou and Papadopoulou, 2020; Jones et al., 2019; Lee and Cavanaugh, 2016). They note that educators either lack educational ideas of how to utilize infographics or are unaware of the positive research-informed outcomes that these practices might deliver. As a result, the insufficient integration of infographics in formal educational settings prevents students from mastering the use of this form of omnipresent communication. To address this gap, our study aims to analyze practices of using infographics in diverse university subjects. More specifically, we intend to disclose how and why infographics are used in higher education, what the results of these practices are and which infographic making tools might be utilized. The review offers practical educational solutions for university educators seeking to promote active learning, develop higher-order thinking skills and engage students in the creation of more diverse learning artefacts.
Methodology
We conducted the scoping review on the use of infographics in higher education by applying the first five stages of the methodological framework initially proposed by Arksey and O'Malley (2005) and further advanced by Levac et al. (2010): identification of the research questions, identification of relevant studies, study selection, charting the data, and collating, summarizing and reporting the results. The sixth stage of consultation was considered as optional in our study.
After identifying the research questions, we aimed to select scientific articles from various disciplines across higher education depicting the use infographics during the period of 2016–2020. A more detailed visualization of the article selection process is present in Figure 1. The flowchart of the scholar article selection process for the scoping review.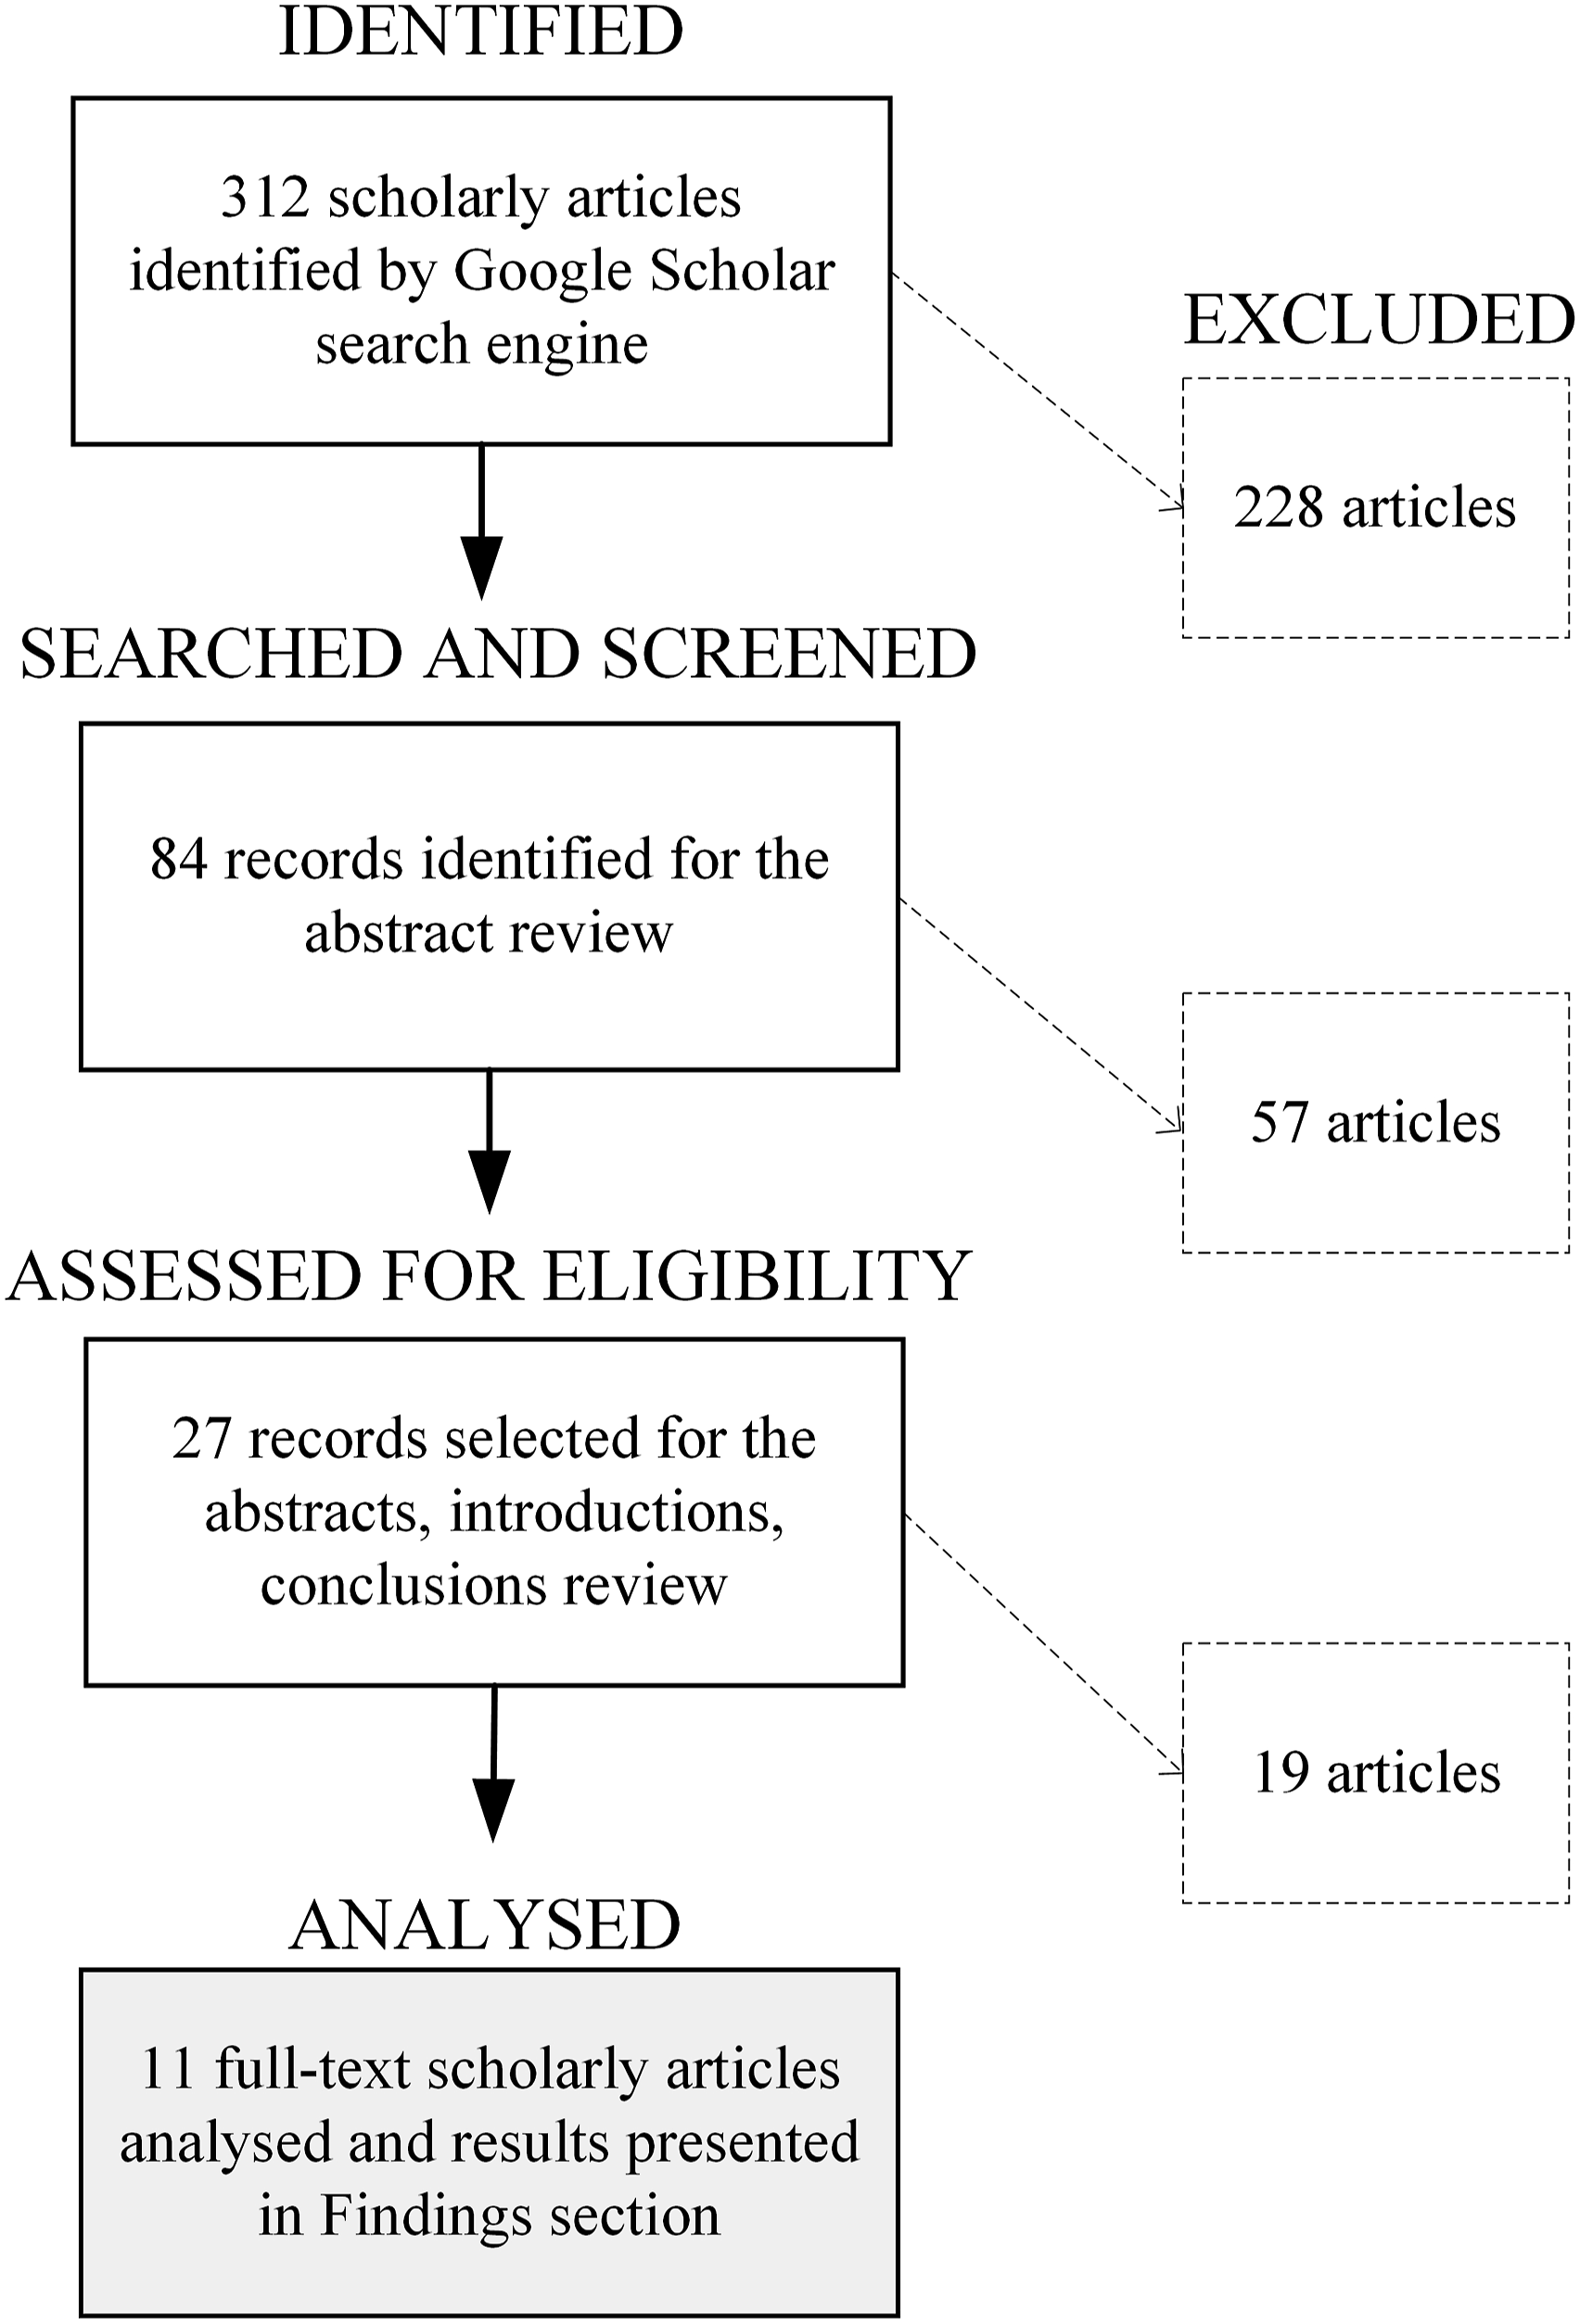
In the last stage, we analyzed 11 articles in detail and interpreted the findings analytically. Afterwards, we discussed the results and proposed recommendations on the use of infographics for educators working in the field of higher education.
Findings
Summary of educational practices including the use of infographics.
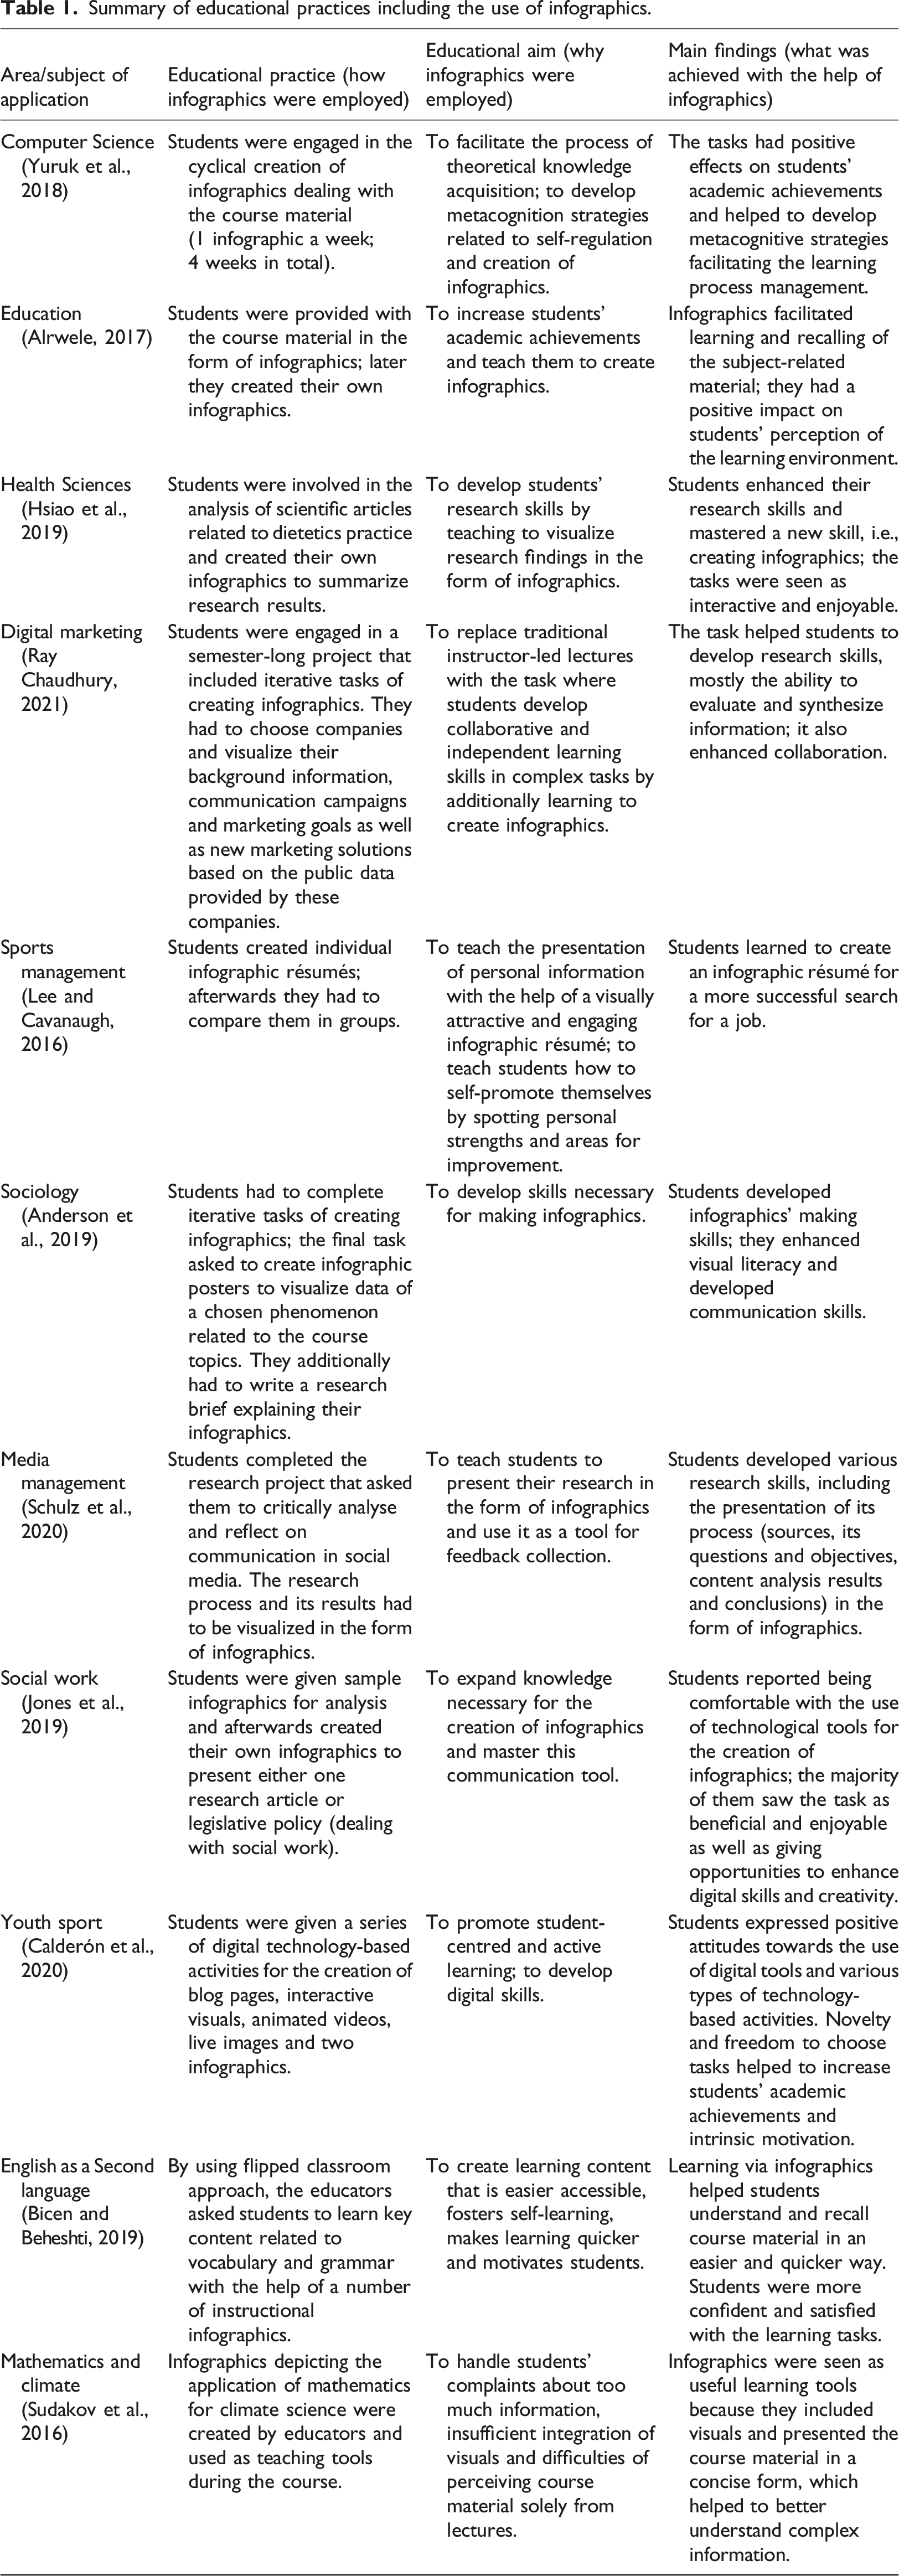
From the educational practices reviewed, it can be seen that university educators designed various short assignments or longer multistep projects illustrating the use of infographics. These practices were developed either individually (e.g. Yuruk et al., 2018) or by groups of educators working in the same field (e.g. Jones et al., 2019). Infographics were used in three major ways: to provide course material, to engage students in the creation of infographics for various purposes or, most frequently, as a combination of both (e.g. Alrwele, 2017). Educators asked students to learn with the help of material provided in the form of infographics (e.g. Bicen and Beheshti, 2019), to produce infographics related to the course material (e.g. Yuruk et al., 2018), to use infographic format to present summaries of research articles (e.g. Jones et al., 2019) or their own research (e.g. Hsiao et al., 2019; Schulz et al., 2020) and to create infographic résumés (e.g. Lee and Cavanaugh, 2016). For example, in the research project devised by Schulz et al. (2020) students were required to self-choose topics that interest them and carry out individual social media research. Specifically, they had to conduct deductive and conductive content analysis (by additionally learning how to use content analysis software NVivo11Pro) of communication of online communities on YouTube channels. The aims of the educators were that the course participants become better at understanding social media communication and additionally develop research skills. At the end of the course, the students were required to present their research findings in infographics showing their research process and its results, i.e. questions and objectives, content analysis results, conclusions and sources used.
Students designed infographics either individually (e.g. Lee and Cavanaugh, 2016), in pairs or in bigger groups (e.g. Calderón et al., 2020; Ray Chaudhury, 2021), usually made of 3–5 members. To increase students’ responsibility and the quality of final infographics, Jones et al. (2019) suggested that they need to be made public, for example, by asking students to share them on social media sites such as Twitter. In the majority of cases, students were given the freedom to choose topics for infographics and material to create them (e.g. Schulz et al., 2020; Jones et al., 2019).
Some educators explicitly stated that the tasks were designed with the main aim of teaching students to create infographics (e.g. Anderson et al., 2019; Jones et al., 2019; Schulz et al., 2020), while the rest considered this goal secondary (e.g. Calderón et al., 2020). Using infographics to facilitate the acquisition of course material was the most common (e.g. Alrwele, 2017; Bicen and Beheshti, 2019; Sudakov et al., 2016; Yuruk et al., 2018). For example, Bicen and Beheshti (2019) stressed the importance of using infographics to provide the course material in more visually appealing and condensed forms. Similarly, Sudakov et al. (2016) provided students with the course material in the forms of infographics as they were complaining about the lack of visual information and information overload. Infographics were commonly applied for giving students tasks to visualize the research process and its results (e.g. Hsiao et al., 2019; Schulz et al., 2020). Among other aims, the educators also listed opportunities for mastering new digital tools and therefore developing digital literacy (Ray Chaudhury, 2021), enhancing visual literacy (e.g. Anderson et al., 2019), information literacy (e.g. Ray Chaudhury, 2021) and creativity (Jones et al., 2019). The necessity for learning to create infographics in order to prepare for real life was also emphasized. For example, Lee and Cavanaugh (2016) taught students to present themselves in short résumé infographics. Anderson et al. (2019) asked students to learn how to create infographics in order to make them more successful in daily communication. As indicated by some educators, the engagement of students in the creation of infographics could be used to replace traditional teaching/learning methods with more active and innovative ones (e.g. Calderón et al., 2020; Ray Chaudhury, 2021).
To make students more skilled in the creation of infographics, educators suggested a number of different measures. The tasks ranged from a single creation of an infographic to a series of tasks of creating infographics. Hands-on practice for the creation of own infographics was the most dominant in the cases reviewed. The majority of educators indicated the need to immerse students in iterative tasks of creating and refining infographics (e.g. Yuruk et al., 2018; Anderson et al., 2019; Ray Chaudhury, 2021). Educators provided examples of properly prepared infographics (e.g. Jones et al., 2019; Ray Chaudhury, 2021), included students into the analysis of either sample infographics (e.g. Anderson et al., 2019) or their own ones based on some provided criteria (e.g. Jones et al., 2019), asked to self-reflect on the process of refining infographics or the processes of making them (e.g. Jones et al., 2019), instructed on necessary design elements (e.g. Ray Chaudhury, 2021) and provided detailed organizational aspects (e.g. Anderson et al., 2019; Jones et al., 2019). For instance, when asking to create infographics based on research articles, Jones et al. (2019) gave students the list of the main sections that needed to be included, such as a thesis statement, a research question, major findings or other key issues related to the chosen topic. During the multistep process to make students more skilled in the creation of infographics, Anderson et al. (2019) started from assessing the students’ level of experience of creating infographics. As it was insufficient, they gave information about organizational elements of infographics, introduced online platforms suitable for their creation and then engaged the students in more practical tasks, such as the analysis of the samples of infographics first provided by the educators and later chosen by themselves. An additional measure utilized by Anderson et al. (2019) was the production of written explanations as supplements of the students’ own infographics.
As the cases reviewed showed, educational practices utilizing the creation of infographics may incorporate various assessment methods or their combinations in different stages of the task. Apart from educators’ assessment, peer-assessment can also be utilized as an educational strategy. For example, Jones et al. (2019) observed that peer evaluation can significantly improve the quality of infographics and advised using this form of assessment in the process of learning to create infographics. Similarly, Anderson et al. (2019) concluded that peer feedback is beneficial in the process of creating and refining infographics. However, Jones et al. (2019) noticed that the quality of peer review might not be always proper and therefore argued for the inclusion of additional measures to teach students of doing that. Before students had to provide feedback for their peers, they included a peer review exercise based on the criteria provided in advance. The need to revise initial drafts based on the feedback from educators or peers was indicated as a very important measure (e.g. Jones et al., 2019). Self-reflection on the process of learning to create infographics was also reported as a useful measure in the cases reviewed. In the study of Jones et al. (2019), for instance, the students had to provide written feedback (either on paper or in blog posts) on their own process of learning to create infographics.
A common practice among educators was to assess infographics based on the criteria presented in advance, usually provided in the form of either rubrics or checklists. Most commonly, these criteria fell into two main groups: content and visual design. For example, in the study by Yuruk et al. (2018), the infographic scores were given for two groups of aspects, i.e. content or quality of textual information and the design or visual elements. For the grading rubric, Anderson et al. (2019) included elements such as format, layout, visualization, fonts, colours, citations and information. Alrwele (2017) organized the checklist into three groups: organization and aesthetics, utility and information. Infographic assignment criteria devised by Jones et al. (2019) included: 1) purpose and content (infographics have to include compelling content and both meaningful and useful information), 2) organization (it has to be consistent and clear so as to reveal the central topic), 3) visualization/use of graphics and data (data has to be clear, images have to be adapted to content), 4) writing mechanics (writing should be accurate, demonstrate no errors; sources have to be well chosen and ethically attributed). As explained by Anderson et al. (2019), the required elements of infographics can be listed in three columns and marked as exceeding expectations, meeting expectations and lacking additional work.
Educators reported a number of benefits related to the integration of infographics in teaching/learning processes. They noted that both course-related material provision in the form of infographics and students’ engagement in their creation had positive results on academic achievement in terms of cognition. For example, Bicen and Beheshti (2019) confirmed that course material presented in the form of infographics facilitated the understanding of it. The students complimented the provision of the material in this form. Similarly, the findings from the study conducted by Yuruk et al. (2018) proved that creation of infographics helped students understand and recall the main points of the subject. As concluded by Alrwele (2017), infographics facilitated the acquisition of the course material as well as increased its retention. As indicated by educators (e.g. Alrwele, 2017; Hsiao et al., 2019), students were content with the integration of infographics in their learning processes.
The findings from some cases (e.g. Alrwele, 2017; Bicen and Beheshti, 2019; Hsiao et al., 2019) confirmed that collaboration in the processes of making and refining infographics increased students’ satisfaction with tasks. As noted by Yuruk et al. (2018), the students were active when facing the tasks of knowledge visualization in groups. In the study conducted by Ray Chaudhury (2021), the educators observed that despite the fact that the students expressed some negative emotions about the nature of such an unusual task at the start of it, later they showed positive attitudes to it. Ray Chaudhury (2021) concluded that the tasks of creating infographics in groups helped to develop collaboration and research skills, such as learning to evaluate information, extract main points and present information or knowledge in concise ways. During the tasks integrating infographics, students developed critical thinking skills (e.g. Martix and Hodson, 2014; Hsiao et al., 2019), communication skills (e.g. Anderson et al., 2019) and learnt to reflect on their own learning in general (e.g. Alrwele, 2017).
Regarding technological solutions, educators utilized various digital tools suitable for the production of infographics. The tools used in the cases reviewed are reflected in Figure 2. It presents only the studies that indicated the use of specific tools. Among them, the use of Piktochart was the most common Martix and Hodson, 2014. Examples of infographic tools used by educators (prepared with SlideKit add-on for Google Slides).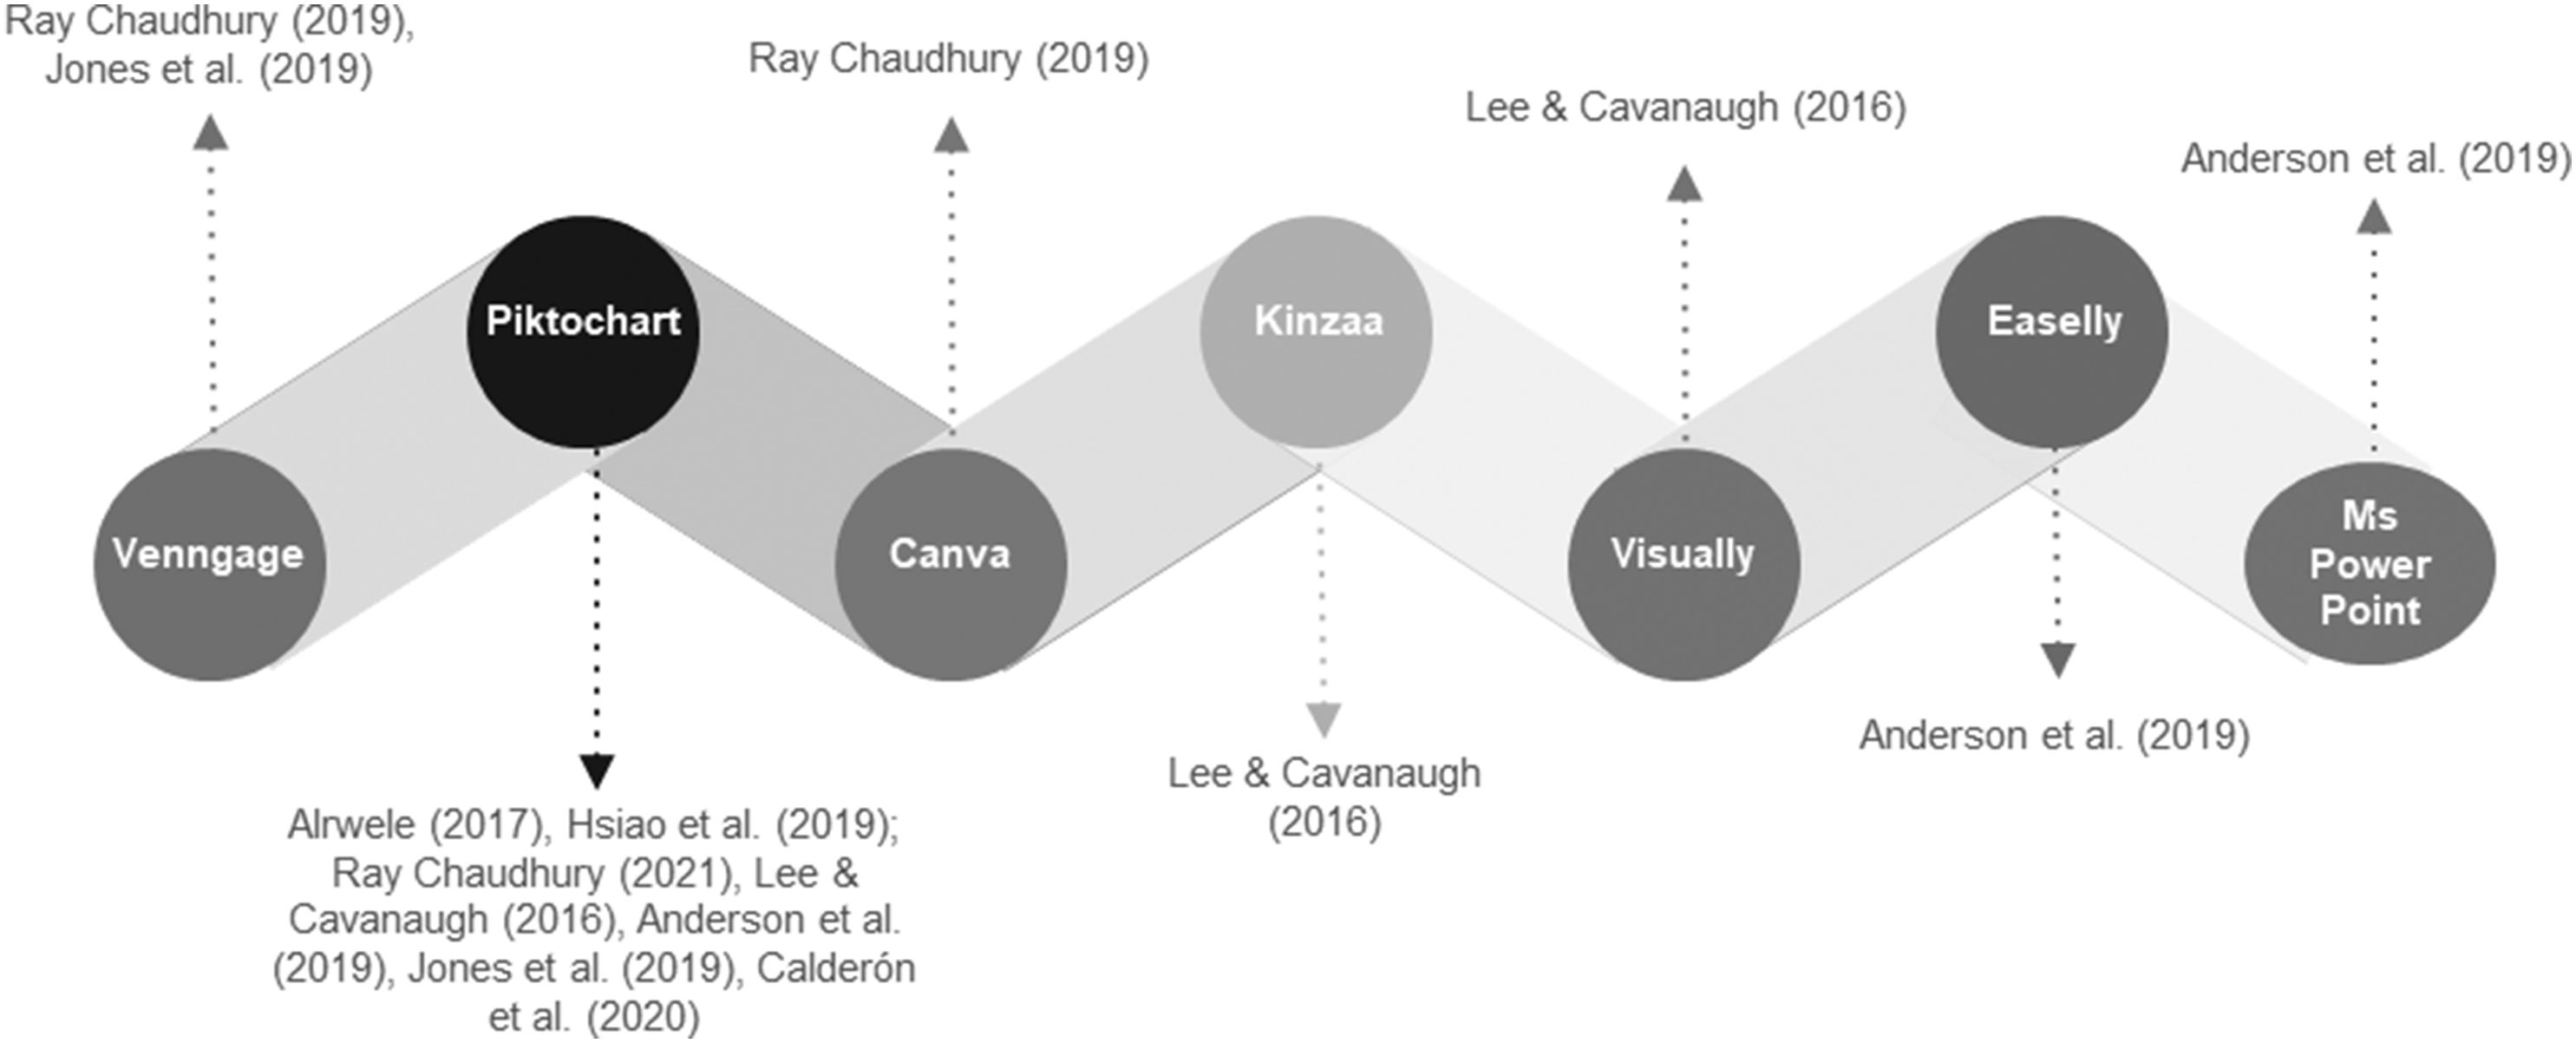
The ease of using modern infographic tools is reflected in the finding that none of the educators mentioned students’ inability to master them quickly. To facilitate the processes of the creation of infographics with the help of digital tools, some educators found it useful to redirect students to the websites of well-prepared examples of infographics or websites of infographic tools that also include professional examples (Jones et al., 2019; Ray Chaudhury, 2021).
Discussion and conclusions
The cases reviewed confirmed that infographics might be used in varied ways and for a number of educational purposes. Whenever course material is supplemented with infographics, they facilitate its acquisition. This form of subject-related content provision matches the preferences of the representatives of Generation Z, the majority of whom are visual learners and prefer less textual information in educational settings. The integration of infographics can also help to overcome challenges related to students’ short attention span.
The tasks of making infographics help students to become more skilled in the creation of this popular form of communication. As infographics are created with the help of digital tools, such practices are suitable to develop digital literacy. They also illustrate the use of technology as mindtools or tools that help students to strengthen their thinking abilities rather than serve for a mere increase of their productivity. When generating textual content for infographics, students learn to research information, critically analyze its suitability and condense it so that it fits in one-page templates (most commonly). However, when it comes to the integration of visual aids and the overall design of infographics, the use of infographic tools makes it semi-automated as students need to simply choose from a range of visually appealing templates and discrete elements. The websites of infographic tools additionally include short video or textual tutorials or even live assistance (e.g. Piktochart), which makes mastering of them efficient. The difficulties might only be related to the fact that they usually limit free use of them. For instance, Piktochart allows to create and download only five visuals for free and limits the formats in which they can be downloaded.
Apart from helping students to become more skilled in the creation of infographics, such practices also engage them in the creation of more diverse learning artefacts, which is a necessary direction in modern education (Cope and Kalantzis, 2017). Students might be bored with too frequent use of the tasks that ask them to produce sets of slides instead of creating more varied forms of knowledge representation. It is also necessary that students are given opportunities to choose the topics or material that are relevant to them, as reflected in the majority of the cases reviewed. This might increase their engagement and responsiveness.
Overall, the cases reviewed confirmed that students are satisfied with tasks with a focus on creating infographics, which goes in line with the findings indicated by Siricharoen and Siricharoen (2015). By calling such tasks novel, students demonstrate greater engagement. The increase of students’ motivation and engagement with the help of active learning methods was also reported by Deslauriers et al. (2019). The fact that in one case the tasks involving infographic creation were seen as unusual and therefore received negative comments at the start of them implies that some students still expect traditional teaching and learning methods and might need extra explanations about the benefits of active forms of learning. It might be possible that not all students are willing or prepared for tasks that require more collaborative as well as cognitive efforts. This also accords with the earlier conclusions made by Deslauriers et al. (2019) about possible limitations of using active methods in higher education.
Tasks involving the creation of infographics help to better understand and recall course related material. Although the final form of infographics presents condensed information, the process of its selection might immerse students in deeper learning as they need to think critically and for a prolonged time of what needs to be included. The supplementation of the course material with different forms of knowledge visualization (e.g. first in the form of longer texts and then in shorter summaries in the form of infographics) might give access to multiple forms of representations. Notably, the processes of making infographics based on the course material provide students with the opportunity to become more active creators of own knowledge, which has already been proved to yield better learning outcomes (Deslauriers et al., 2019; Cope and Kalantzis, 2017).
The majority of the cases where students collaborate to create infographics help them to develop collaboration skills. Such practices illustrate more conversational and social learning, which belongs to modern directions in education (Jonassen and Land, 2012; Cope and Kalantzis, 2017). In addition, such tasks give students additional practice of learning to create collective knowledge. Both ability to work in teams and collective knowledge creation are highly appreciated in an increasingly project-based world (Boss and Larmer, 2018; Cope and Kalantzis, 2017).
Most importantly, the findings from the practices reviewed confirm that infographic making tasks are suitable for the development of a set of important skills and capabilities simultaneously. They include critical thinking, information literacy, digital and visual literacy, research skills, creativity and communication skills. These findings are in line with those obtained by Alqudah et al. (2019), Kibar and Akkoyunlu (2017), Toth (2013) and Vanichvasin (2013). Therefore, by ensuring holistic development of students, infographics are promising educational tools suitable for diverse subjects in higher education. They bridge the gap between what students are prepared for in higher education and what they might need in real life, where infographics are ubiquitous.
Recommendations
Based on the findings from the articles reviewed and our own implications, Figure 3 outlines our suggestions for the design of the tasks to engage students in the creation of infographics: Suggestions for the tasks to engage students in the creation of infographics (made with Piktochart).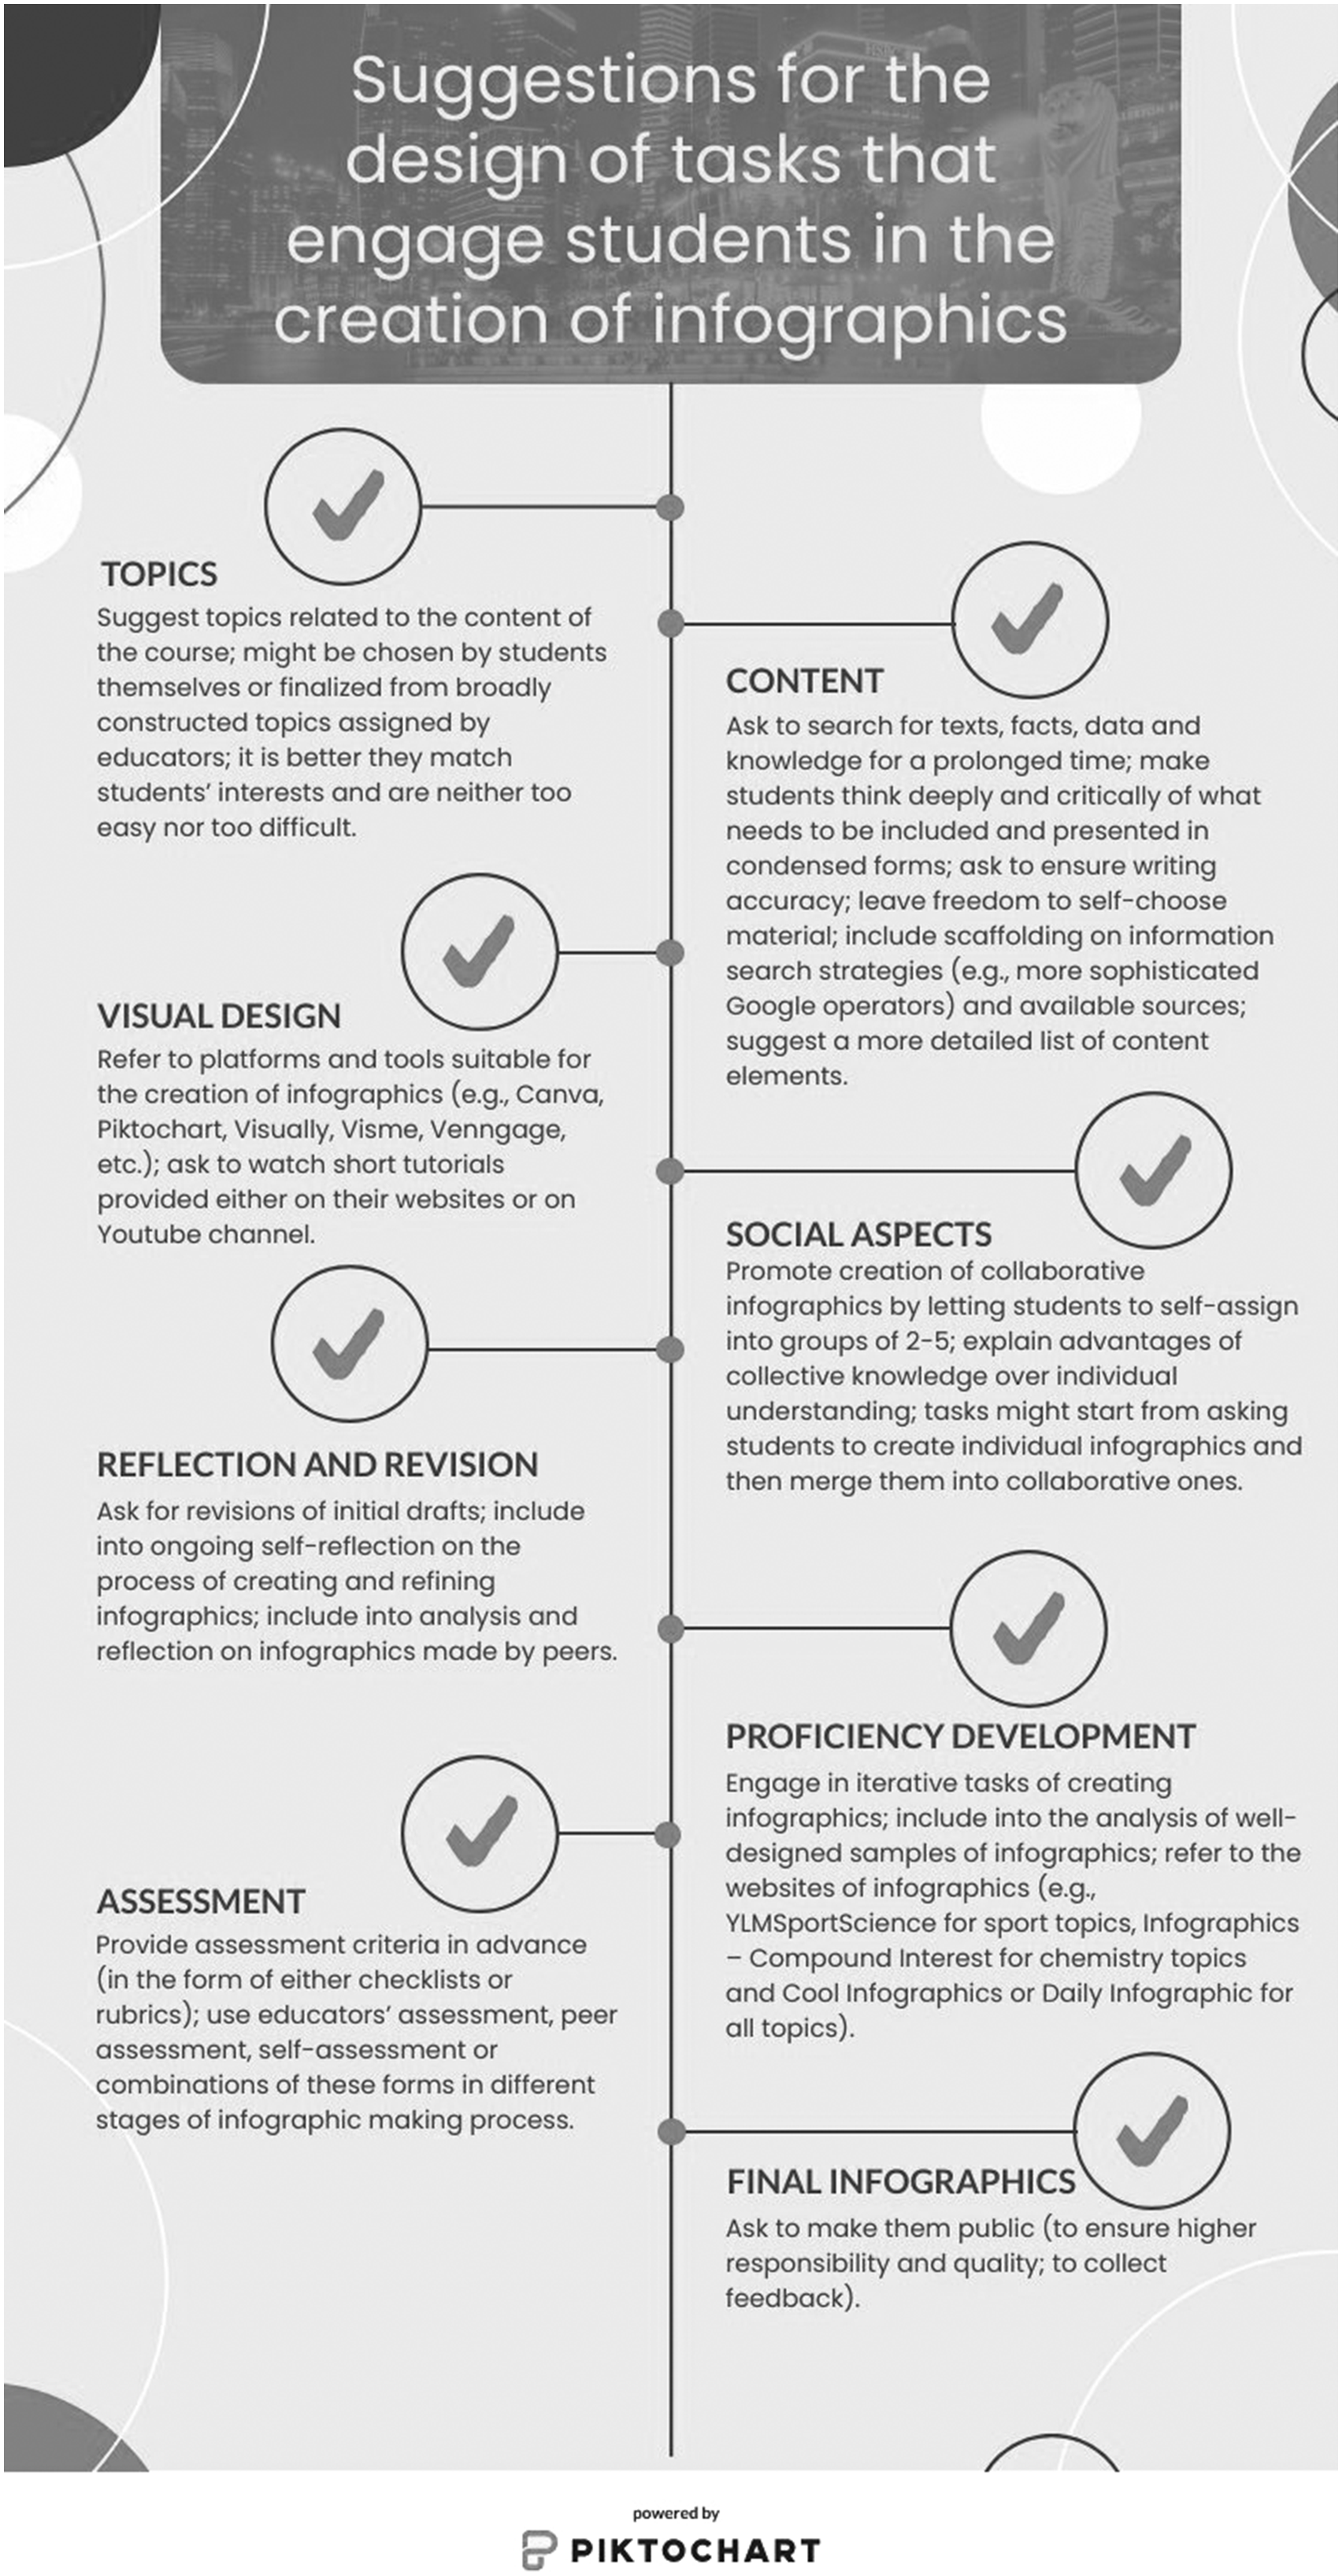
Having been offered different ideas of using infographics and a number of technological tools, educators could create more diverse, meaningful and engaging learning experiences. Given the short attention span of students and their preference for visual information, the use of infographics could reduce the dominance of textual information or even frequently replace MS PowerPoint slides, which has become commonplace in university studies. Importantly, we recommend that educators work in teams while seeking the proper design and implementation of tasks including infographics. It is also advisable that such practices are refined based on self-reflection and students’ feedback.
To make students more skilled in the creation of infographics, educators should design iterative practices where they create infographics and reflect on these processes. Students’ active participation in the processes of self- and peer-assessment may speed up and facilitate their advancement in this field. It is also recommended that students are taught proper ways of giving and receiving feedback, for example, by using detailed protocols for feedback offered by experienced educators. To guide and facilitate the processes of making infographics, students should be provided with clear assessment criteria in advance. For example, rubrics or checklists might be utilized for this purpose. Two main groups of criteria might comprise content and design elements. Considering the constraints put on free access to the most popular and advanced infographic tools, universities might be making institutional subscriptions to these tools.
To increase the value of such practices, we suggest putting students in groups while giving them tasks to create infographics. The collective knowledge and shared understanding may increase the effectiveness of communication and reduce cases of miscommunication, which is usually the result of a narrow individual understanding and knowledge. At the same time, these practices could be beneficial for the development of collaboration. Students should be also taught ethical scientific communication and citing of various information sources, including online images. Finally, educators should be trained to design infographics not only in order to devise educational practices for students, but also to integrate them effectively in scientific communication.
Footnotes
Acknowledgements
We wish to thank the anonymous reviewers who have dedicated their time and expertise to reviewing our manuscript. Their insight and expertise greatly assisted our research.
Declaration of conflicting interests
The author(s) declared no potential conflicts of interest with respect to the research, authorship, and/or publication of this article.
Funding
The author(s) received no financial support for the research, authorship, and/or publication of this article.
Availability of data and materials
The datasets used and/or analysed during the current study are available from the authors on a reasonable request.