
Abstract
In this research, we investigated whether business students enrolled in a statistics course gained more by engaging in traditional face-to-face (FTF) learning or online learning. Empirical evidence suggested that students learned statistics more effectively when engaged with an instructor in a traditional FTF classroom versus through online learning; however, when the option of teaching virtually in fully online (ONL) classes was available, students successfully learned about statistics whether in a traditional FTF classroom or a ONL learning experience. In addition, evidence suggested that students’ overall satisfaction with the course and the instructor was higher in the FTF setting than in the ONL setting. Evidence also suggested that offering online zoom lecture meetings in the ONL setting remarkably enhanced students’ satisfaction with the course and the instructor and, importantly, reduced the gap in effective instruction between traditional FTF and ONL settings.
Introduction
Due to the COVID-19 pandemic, we may not have the opportunity to completely implement and fully facilitate traditional face-to-face (FTF) courses again for a while. For that reason, we need to shift our instructional opportunities online, making online delivery an important instructional mode. However, there is significant evidence (e.g., Glass and Sue, 2008; Lokken, 2011; Mills and Raju, 2011; Trenholm and Peschke, 2020; Trenholm et al., 2019; Vilardi and Rice, 2014; Xu and Jaggars, 2011) that online delivery (especially, fully online [ONL]) may pose a challenge when delivering technical math-related courses (mathematics, statistics, physics, etc.) because online instruction may be less dynamic than traditional FTF delivery, even though current technology and techniques have improved the nature and effectiveness of online delivery. To examine this theory, we designed a case study involving, “Statistics for Business,” a technical math-related course and required core course for all business students. A number of business students have been struggling with learning this course, which inspired us to study this issue by looking at instructional methods (INS) that may aid students experiencing difficulty in learning statistics. We compared student learning performance in and satisfaction with a business statistics course in a traditional FTF classroom versus ONL learning with/without virtual teaching.
“Statistics for Business” focuses on statistical concepts and applications used in business decisions and situations. Through this course, business students gain greater understanding of how managers deal with uncertainty, how statistics enable managers to more quickly and efficiently make more appropriate and smarter business decisions, and how managers provide more stable leadership to their staff. For example, when instructors talk about ways to apply the normal probability distribution, they might describe how managers use it to design a warranty policy for customers. As another example, in examining applications of hypothesis tests, instructors might tell students how managers formulated a hypothesis test to determine whether a shipment of parts should be accepted or rejected and returned.
Although “Statistics for Business” is a required core course for business majors, compared with other business courses (“Marketing Strategy,” “Consumer Behavior,” “Introduction to Marketing Management,” “Principles of Business Administration,” “Managing & Behavior in Organizations,” etc.), this course may pose a challenge for students because it is a mathematics course. Several challenging topics are covered, such as probability theories, hypothesis tests, analysis of variance, regression analysis, decision analysis, etc. Therefore, unlike other business courses listed here, learning about these challenging statistical topics requires strong problem-solving skills. Many business students face “math phobias” or “math anxiety” (Bessant, 1992) and do not feel confident and competent in dealing with math-related subjects—these fears may cause them to avoid engagement with these topics (Oathout, 1995), hindering their learning about statistics. To help students overcome their concerns about math, it may be helpful to use basic methods when teaching math-related courses to students who have “math phobia/anxiety.” That is, instructors need FTF access to students to show them step-by-step processes for solving problems, guide them during computations, and clarify diverse concepts, as well as help them understand how to apply statistical concepts and skills in making business decisions. This more dynamic learning process will show students that statistics is a relevant subject that is not boring and deserves their attention and interest.
Furthermore, one of the essential missions of business faculty is to train students to be leaders who can utilize management techniques and skills to manage, direct, plan, and control an organization to achieve business goals and operations. Since “Statistics for Business” is a business course, instructors who teach it must be cognizant of this mission when teaching statistics. For example, instructors may sometimes engage in classroom game-play experiments when teaching topics such as probability distributions (binomial probability distribution, hypergeometric probability distribution, etc.). Ample evidence shows that classroom game-play is a fun, lively, and creative way to teach and learn a subject (e.g., Dickie, 2006; Lin, 2018; Lin and Dunphy, 2013;). This method also promotes students’ motivation to learn/interest in learning models. Students not only learn statistics but also learn how to lead and manage a group to complete the games and achieve their goals while they engage in classroom game-play experiments. More importantly, game-play strengthens interactions and communications between students and between students and instructors—instructors can use this method to build a strong rapport with students. Thus, this learning process can be an important tool in training our business students to future leaders of organizations. Unfortunately, implementing these types of training activities in ONL settings holds significant challenges—challenges that are not present in FTF settings.
Despite instructors’ belief that FTF instruction on statistics is a more effective strategy, nearly all universities/colleges in the United States offer a number of ONL classes. This includes “Statistics for Business.” Fully online courses require students to be motivated, independent, organized, self-regulated (McMahon and Oliver, 2001; Phipps and Merisotis, 1999), and highly engaged in learning activities, such as online discussions and quizzes (Rajabalee et al., 2020). Students’ significant participation in online learning activities can enhance their critical skills and practical competencies, and hence improve grades (Banoor et al., 2018). The role of instructors in ONL classes is akin to that of advisors who advise and assist students when they have questions and need assistance. Communications between students and instructors in ONL classes can occur mainly via emails (i.e., interaction is not dynamic and is slower than FTF communication) or can occur via both emails and online zoom meetings (i.e., online virtual classes).
A number of studies have broadly compared student learning achievement with traditional FTF versus ONL, and the results of these comparisons have been mixed—either significant or no difference (e.g., no difference: Dell et al., 2010; Holmes and Reid, 2017; Paul and Jefferson, 2019; Porter et al., 2014; Summers et al., 2005; significant: Arias et al., 2018; Cavanaugh and Jacquemin, 2015; Christmann, 2017; Driscoll et al., 2012; Helms, 2014; Holbert, 2017; Slover and Mandernach, 2018). Very few studies have focused on the subject of statistics (e.g., Christmann, 2017; Summers et al., 2005). Summers et al. (2005) did not find statistically significant differences in grades between these two different settings, but they found that students’ overall satisfaction was statistically and significantly different—students were less satisfied with online than with traditional FTF statistics classes. On the other hand, Christmann (2017) demonstrated that students enrolled in a traditional FTF statistics class performed significantly better than students enrolled in an online statistics class.
Consequently, we designed an experiment in which the instructor did or did not teach virtually in ONL classes. (Note that ONL does not require instructors teaching virtually, but it depends on instructors if they are willing and believe that offering some virtual lectures can assist students to learn better.) We then investigated this question: will business students learn statistics effectively in a ONL class, or is a traditional FTF experience a more effective way to learn statistics when the instructor did or did not teach virtually in ONL classes? Two research questions were developed for this study:
Additionally, we wonder if student satisfaction as measured in teaching evaluations will be dissimilar in these two different instructional settings. For that reason, our third research question was as follows:
Methodology
Experimental design
To conduct this research, we designed an experiment. We selected one instructor who taught both the FTF and ONL “Statistics for Business” course in the same semester in Fall 2018 and 2019. Below, we present how we designed the experiment for these two settings. 1. Lectures. In the FTF setting, the instructor gave students regular lectures in the classroom twice a week. Each meeting lasted around 75 min. The instructor used the traditional chalk board during the lecture (and sometimes used the classroom computer to show students how to use Excel and Minitab programs). Students took lecture notes. In the ONL setting, the instructor in Fall 2018 did not provide students online zoom lecture meetings, but the instructor in Fall 2019 offered students online zoom lecture meetings (teaching virtually) and also posted these zoom lectures online. In both semesters, the instructor provided students with short YouTube video lectures for each chapter. In addition, the instructor posted PowerPoint lecture notes on the class website so that students could download them to study. The instructor used the same textbook in both settings. 2. Discussions. In the FTF setting, the instructor always prepared questions for each meeting to guide students toward thinking critically during classroom discussions. Classroom discussion questions were short, and students needed to respond instantly. In the ONL setting, the instructor created weekly online discussions regarding each week’s topic. Discussion questions differed by instructional location. Online discussion questions were normally broader than classroom discussion questions, so students needed more time to think and answer. 3. Homework Assignments. In both FTF and ONL settings, the instructor gave students the same homework assignments weekly. In the FTF setting, after students submitted their homework in class, the instructor immediately spent a few minutes (around 20–25 min) reviewing each problem and showing students how to solve them, step-by-step. Students could ask questions at any time, and the instructor instantly responded before moving on to the next problem. In the ONL setting, the instructor in Fall 2018 did not physically review every problem with students, but the instructor in Fall 2019 spent a few minutes in online zoom meetings to review each problem and responded to students instantly. In both semesters, the instructor emailed students detailed solutions for each homework assignment. 4. Classroom Exercises. In the FTF setting, after finishing each chapter, the instructor immediately gave students exercises (3–4 problems) to practice in the classroom. Although students worked on the exercises, the instructor walked around to see if students needed help. Doing so gave the instructor a chance to individually assist students with math problem-solving. After 15 min, the instructor went over each problem and showed students detailed solutions step-by-step so that students could understand the problem solutions. Although the instructor went over each problem, students could ask questions at any time; the instructor would instantly respond before moving on. In the ONL setting, the instructor in both semesters did not provide students the same opportunity as in the FTF setting. 5. Classroom Game-Play Experiments. In the FTF setting, the instructor designed several classroom game-play experiments for students, on topics such as binomial probability distribution and hypergeometric probability distribution. When the instructor lectured on these two topics, he used game-play experiments to enable students to experience virtual reality and distinguish between binomial and hypergeometric distributions. (These two distributions are similar but have differences—students can be easily confused by these two probability distributions.) Classroom game-play experiments are the best way to let students experience virtual reality because classroom game-play experiments are designed to reflect real activities. Of relevance here is the fact that students learn statistics from experiencing virtual reality. More importantly, game-play experiments are a fun, lively, and creative INS. There is empirical evidence that classroom game-play experiments exert a positive and statistically significant effect on student learning achievement (e.g., Dickie, 2006; Emerson and English, 2016; Emerson and Taylor, 2004; Frank, 1997; Gremmen and Potters, 1997; Lin, 2018, 2020; Lin and Dunphy, 2013). In the ONL setting, the instructor could not provide students with the same important opportunity as he did in the FTF setting. 6. Exams. There were three exams (two midterm exams and one final exam). To conduct this research, the instructor wrote the same exams for both FTF and ONL settings. However, exam questions in Fall 2019 differed from the questions in Fall 2018. This was to prevent students from collecting exam information and solutions from previous years. Although exam questions in Fall 2018 and 2019 differed, the instructor wrote on the same topics and developed exams of the same difficulty for Fall 2019 as for Fall 2018. All exam questions involved problem-solving—there were no multiple-choice questions and no essays. Since students in the ONL setting took exams at home, to compare these two settings, the instructor also let students in the FTF setting take exams at home. Exams were to take the same amount of time in each setting. Students were given 48 h to complete each exam. Students could use references, but were not allowed to discuss (via email, text, phone call, etc.) exams with anyone else or copy answers—this was regarded as cheating. We assumed that students did not cheat although this assumption might not have been true. In the FTF setting, the instructor went over the exam problems and also gave students solutions after distributing the exams. However, in the ONL setting, the instructor in Fall 2018 could not physically go over the exam problems with students, but the instructor in Fall 2019 spent some time in online zoom meetings, going over the exam problems with students. In both semesters, the instructor emailed exam solutions to students. 7. Office Hours Assistance. In the FTF setting, the instructor provided FTF office hours weekly in his office. In the ONL setting, the instructor in Fall 2018 did not offer students online zoom office hours, but the instructor in Fall 2019 offered students online zoom office hours. No matter which settings, students could email the instructor whenever they had questions. The instructor did his best to respond to students with in 24 h.
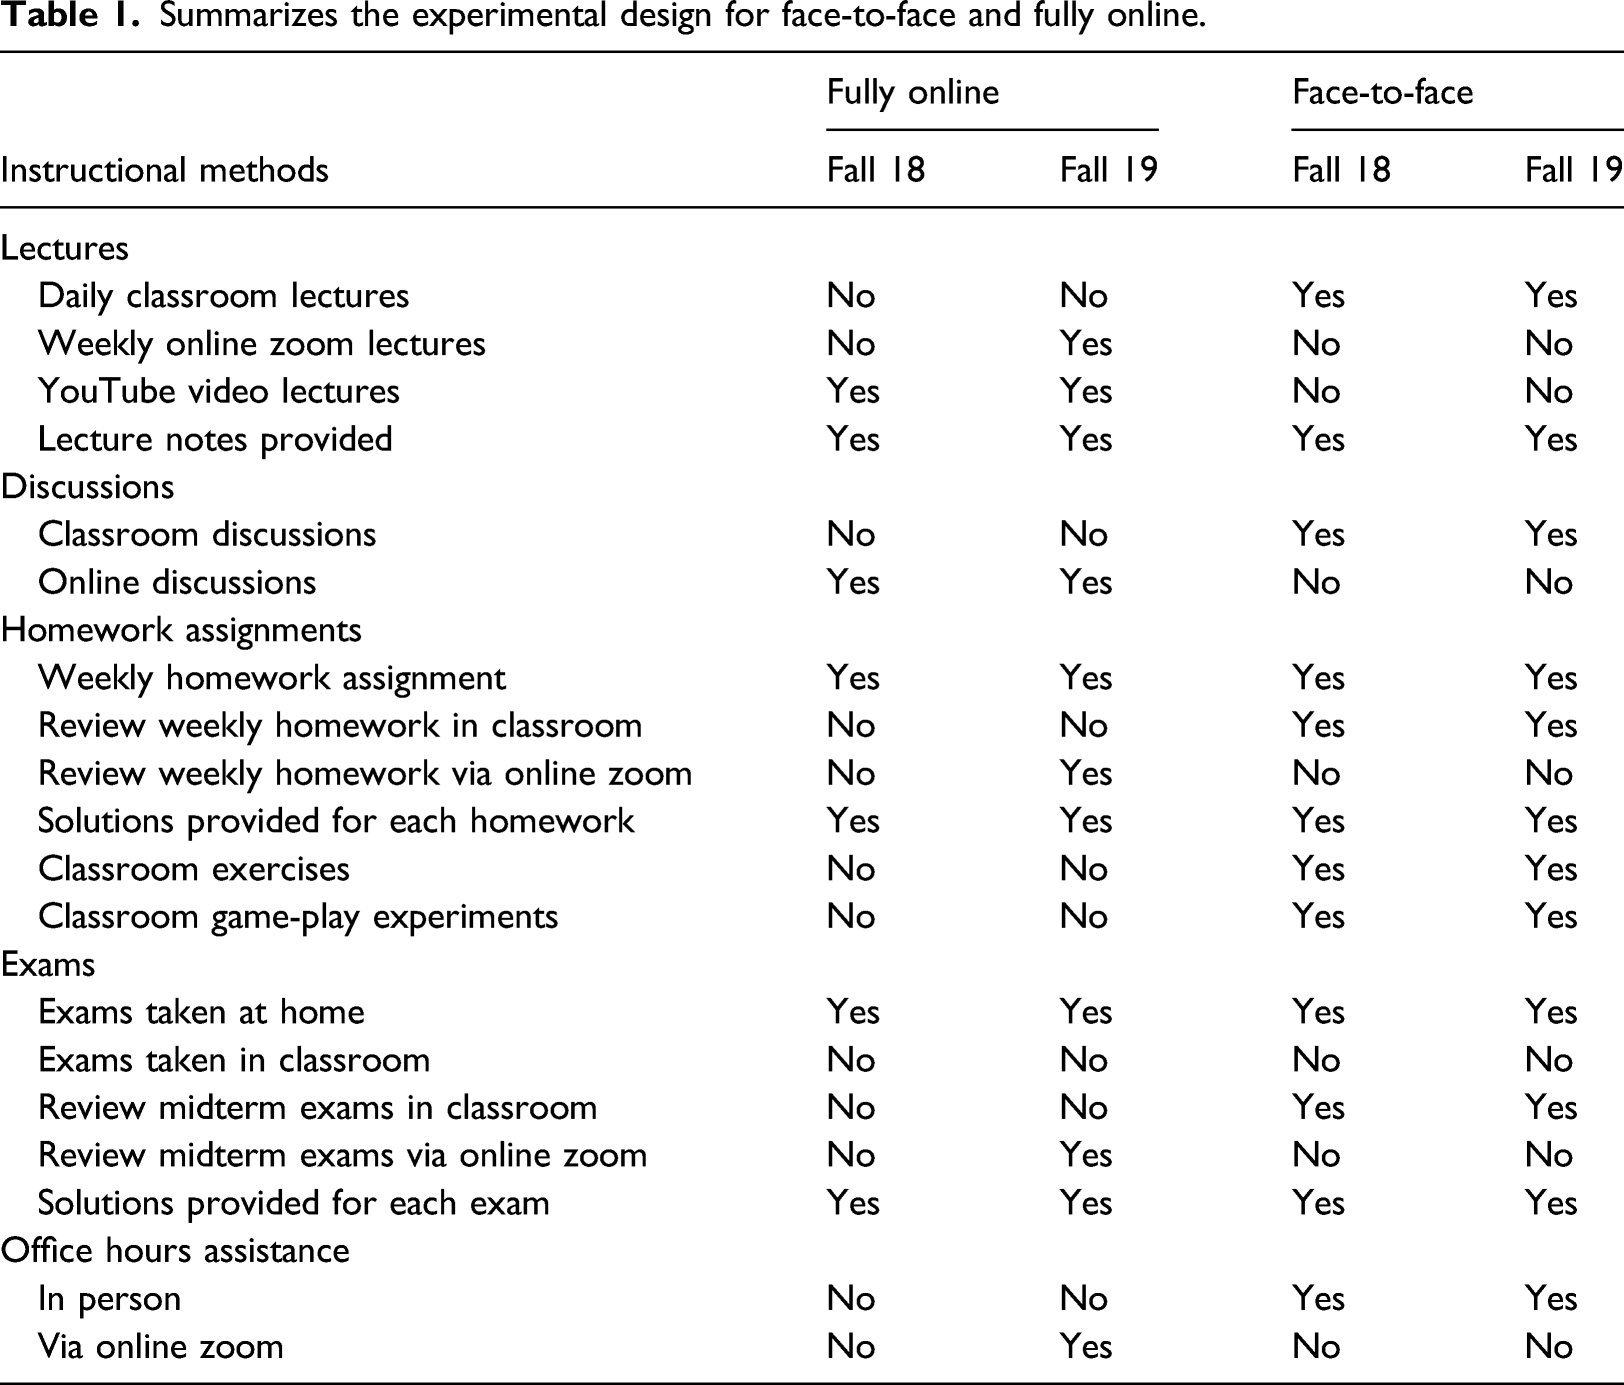
Summarizes the experimental design for face-to-face and fully online.
Subjects and data
The subjects were 59 business undergraduate students enrolled in traditional FTF “Statistics for Business” classes (29 students in Fall 2018 and 30 students in Fall 2019) and therefore participated in the experimental group, while 65 business undergraduate students enrolled in ONL “Statistics for Business” classes (31 students in Fall 2018 and 34 students in Fall 2019) and therefore participated in the control group.
It should be noted that the prerequisite for this course is Finite Mathematics and Microcomputer Applications & Computing. Students who were enrolled in the online course used Canvas as its online web-based learning management system. The instructor had been certified by Quality Matters (QM), a certification program that trains instructors to master online teaching—participants become savvy in technology and online communication and interaction.
The instructor used the same textbook for both settings, but the grading policy for each type of course was a little different. In the FTF setting, graded items included three exams (70%), weekly homework assignments (20%), and class discussion participation and attendance (10%). In the ONL setting, graded items included three exams (70%), weekly homework assignments (10%), and online weekly discussions (20%). It should be noted that the university required online discussions to be at least 20% of the course grade so that weekly homework assignments in the ONL setting only could weight 10% of the course grade. Three exams and weekly homework assignments in both settings were the same. The only difference was online discussions and class discussions.
Regression results for Hypothesis 1 (Face-to-face vs. online in Fall 2018).
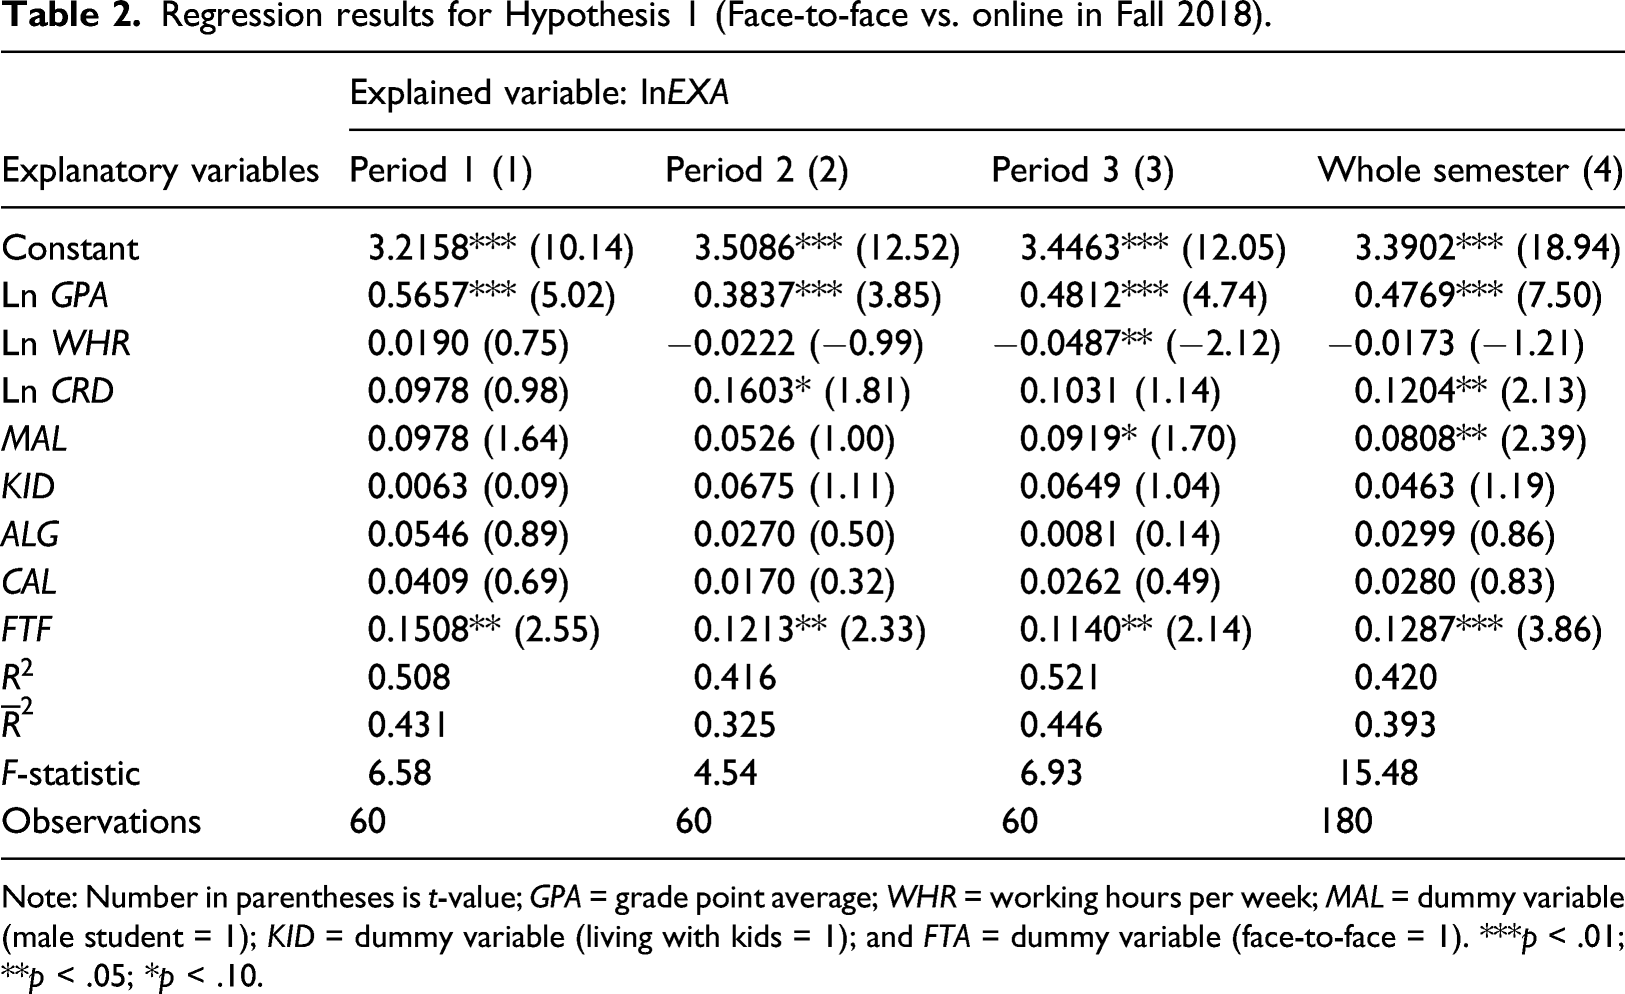
Note: Number in parentheses is t-value; GPA = grade point average; WHR = working hours per week; MAL = dummy variable (male student = 1); KID = dummy variable (living with kids = 1); and FTA = dummy variable (face-to-face = 1). ***p < .01; **p < .05; *p < .10.
Regression Results for Hypothesis 2 (Face-to-Face vs. Online in Fall 2019).
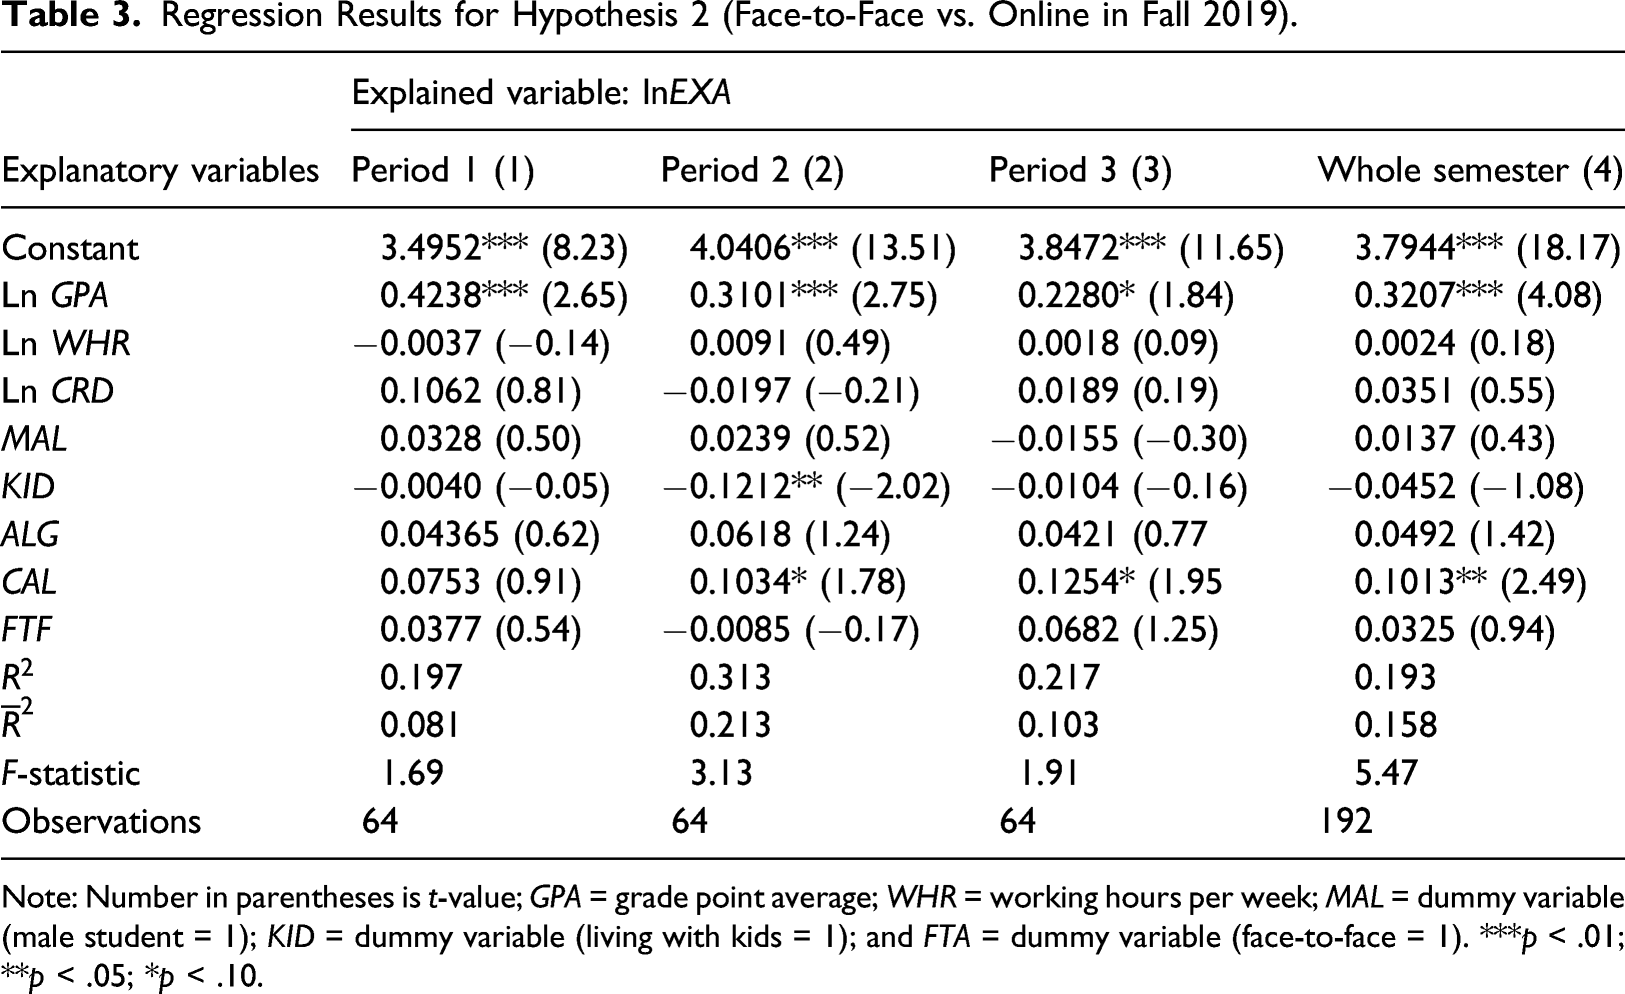
Note: Number in parentheses is t-value; GPA = grade point average; WHR = working hours per week; MAL = dummy variable (male student = 1); KID = dummy variable (living with kids = 1); and FTA = dummy variable (face-to-face = 1). ***p < .01; **p < .05; *p < .10.
The data used in this study included both instructor-reported data and student-self-reported data. This research, which utilized students’ GPAs and exam scores (EXA), was approved by the Institutional Review Board (IRB). Data sources and measurements are described below. 1. Exam Score (EXA). We used three EXA as a proxy for a student’s academic learning performance. These three EXA for both groups were recorded and provided by the instructor. 2. Grade Point Average (GPA). We used GPA as a proxy for a student’s scholarly quality and motivation to learn course materials. Each student’s GPA was provided by the Registrar’s Office. 3. Efforts (EFF). There were two types of effort: in-class and out-of-class. Lecture attendance was adopted for in-class effort. However, there was no lecture attendance for the ONL setting. Instead, all EFF for the online setting were out-of-class EFF. If we surveyed students’ out-of-class EFF for both groups, there would be a bias in the experiment because students in the FTF group had both in-class and out-of-class effort. That is, there might be less out-of-class effort in the FTF group than in the ONL group. Students who attended classes may have learned a lot from the instructor in class so they may not have spent significant time studying for the course at home or in the library. Moreover, students’ self-reports of time spent studying for the course may not be precise. Thus, the survey data for the variable “out-of-class effort” may not be reliable. Consequently, we ignored in-class and out-of-class EFF even though effort is an essential factor in determining a student’s learning performance. 4. Credit hours taken in the semester (CRD). One of a student’s opportunity costs in taking the course is the student’s total CRD. This information was obtained from the Office of the Registrar. With regard to student work hours for pay per week (another opportunity cost of taking the course), information was collected via self-report on a questionnaire. The questionnaire is described later in this paper. 5. Gender (GEN). Gender was a dummy variable. Thus, male (MAL) was set as 1, and female was set as 0. The instructor reported each student’s GEN. (Note that we consider this variable, because some empirical evidence [e.g., Cortright et al., 2011; Paisey and Paisey, 2004; Woodfield et al., 2006] showed that GEN could affect a student’s lecture attendance, in turn influencing a student’s learning performance.) 6. Living with young kids (KID). This was a dummy variable. “Yes, KID whose age is below 10 years old” was set as 1, while “No, do not live with young kids whose age is below 10 years old” was set as 0. Again, this variable also required students’ self-report via a questionnaire. The questionnaire is described later in this paper. (Note that we considered this variable because a student’s domestic circumstances could have an impact on the student’s learning performance, especially when the student is a parent and has little kids [less than 10 years of age] living with him/her. These young children may need more parental attention and care. Care may crowd out some of the time needed to study for the course, and hence would cause the student to perform poorly.) 7. Math background (MAH). Although Finite Mathematics was required as a prerequisite for “Statistics for Business,” a stronger MAH was necessary for students who wished to learn about statistics. Therefore, we used Intermediate Algebra (ALG) and Calculus (CAL) to reflect a student’s stronger MAH. These two variables were dummy variables as well. We set “Completed” as one and “Never completed” as 0. We obtained the information on these two variables from the Office of the Registrar. 8. Instructional method (INS). In this research, we compared two INSs: FTF and ONL. Thus, we set 1 as “students in the FTF group” and 0 as “students in the ONL group.” Hence, the variable of “FTF” was also a dummy variable.
There were two more variables—total work hours for pay per week (WHR) and living with young kids (KID). Both required students to self-report via a questionnaire. We designed a short questionnaire that probably took students less than 1 min to complete. The survey was done in Period 1. Before students started the survey, they were notified that they could choose whether or not to participate in the study, and that the survey did not count towards their final course grade. The short questionnaire is shown below: 1. Are you working for pay this semester? Yes: ___; No: ___. If “yes”, how many hours approximately per week are you working for pay? ____. 2. Do you live with young kids whose age is below 10 years old? Yes: ___; No: ___.
In addition, it should be noted that it was difficult to determine the reliability of the participants’ response via survey. We understood that there could be a very small possibility that a very few students might not honestly respond, but we could not control this situation. Fortunately, these two variables (WHR and KID) were not essential factors in this research, meaning that our ability to collect information on them would not significantly affect our main results.
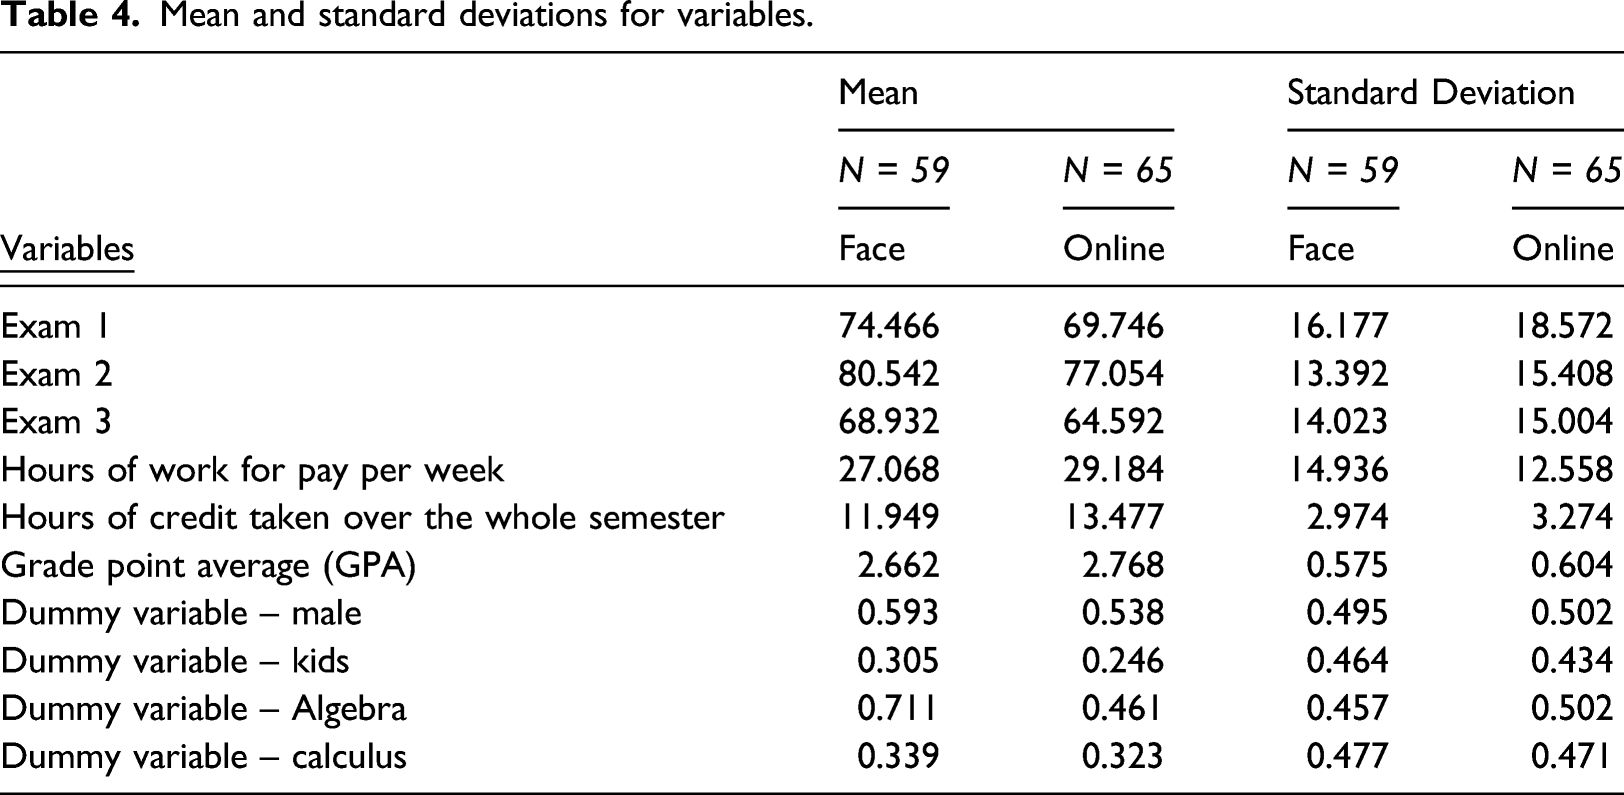
Mean and standard deviations for variables.
Research method: the multiple-regression analysis
We adopted the multiple-regression analysis to design our research method. Two hypotheses were tested to verify whether they could be supported in this research. These two hypotheses were: Hypothesis 1: Lacking the option of virtual instruction through ONL classes, students will learn statistics better in traditional FTF classroom than ONL classes. Hypothesis 2: Despite the option of virtual instruction through ONL classes, there will be no significant difference between students learning statistics in a traditional FTF classroom and through a ONL learning experience.
The basic framework for a student’s learning performance can be displayed as follows
It should be noted that the above determinants of the basic framework are not an assemblage of suppositions. Instead, they are essentially based upon numerous empirical findings from previous studies (e.g., Cohn and Johnson, 2006; Dickie, 2006; Frank, 1997; Lin, 2013a, 2016, 2018).
We assume that a student’s exam performance was modeled as a transcendental function. For that reason, equation (1) can be shown in terms of the transcendental model as below
We constructed a regression model to test both Hypotheses 1and 2 by taking natural logarithms of both sides of equation (2). The exam performance function becomes linear, and thus the regression model can be displayed as follows
In this formulation, the null hypothesis is that parameter
Results
Hypothesis 1
The results for FTF versus online in Fall 2018 for equation (3) are presented in Table 2. As shown, the null hypothesis that traditional FTF teaching is not related to student learning performance was rejected, because traditional FTF teaching (FTF, dummy variable) exerted a positive and statistically significant effect on students’ exam performance at the 5% and 1% levels for each exam period and the whole semester, respectively.
As a result, Hypothesis 1 was supported. Students learned statistics better in the traditional FTF classroom than through a course offered ONL without zoom lectures. This finding was consistent with Christmann’s (2017) finding.
Hypothesis2
The results for FTF versus online in Fall 2019 for equation (4) are reported in Table 3. As shown, the null hypothesis that traditional FTF teaching is not related to student learning performance was not rejected, because traditional FTF teaching (FTF, dummy variable) did not exert a statistically significant effect on students’ exam performance at any level for each exam period and the whole semester.
Consequently, Hypothesis two was supported. In the ONL setting, when the instructor provided students with online zoom lecture meetings, students did not learn statistics significantly better in the traditional FTF classroom than when ONL. That is, there was no significant difference between these two settings in student learning about statistics. In other words, when the instructor offered his own lectures via online zoom meetings in the ONL setting, the method improved students’ learning in statistics in the ONL class.
Student satisfaction
Our empirical evidence suggested that students did not necessarily learn statistics more effectively in the FTF than the ONL setting. Does this evidence also imply that students seeking to learn statistics may not be more satisfied with the FTF setting than with the ONL setting? To investigate whether student satisfaction with the course and the instructor would be influenced by different instructional settings, we compared official student evaluations of teaching designed by the university in both settings. Student evaluations are an essential indicator of students’ overall academic experiences and achievement, and thus could reflect overall satisfaction with both the course and instructor.
Due to its use of two different instructional settings—FTF and online, the university in 2014 authorized the Center for Innovation and Scholarship in Teaching and Learning (CISTL) to re-design two different online surveys according to the methodologies in the Course Experience Questionnaire (CEQ) developed by Ramsden (Ramsden, 1991), the National Student Survey (NSS) developed by Ashby, Richardson, and Woodley (Ashby et al., 2011), and Students’ Evaluations of Educational Quality (SEEQ) developed by Marsh (Marsh, 1982) as an indicator of instructors’ teaching performance. Additionally, the CISTL sought instructors’ and upper-level administrators’ opinions and suggestions about re-designing the official student evaluations of teaching, focusing on aspects of both classroom and online teaching environments.
Official student evaluations of teaching: Questions in each instrument.
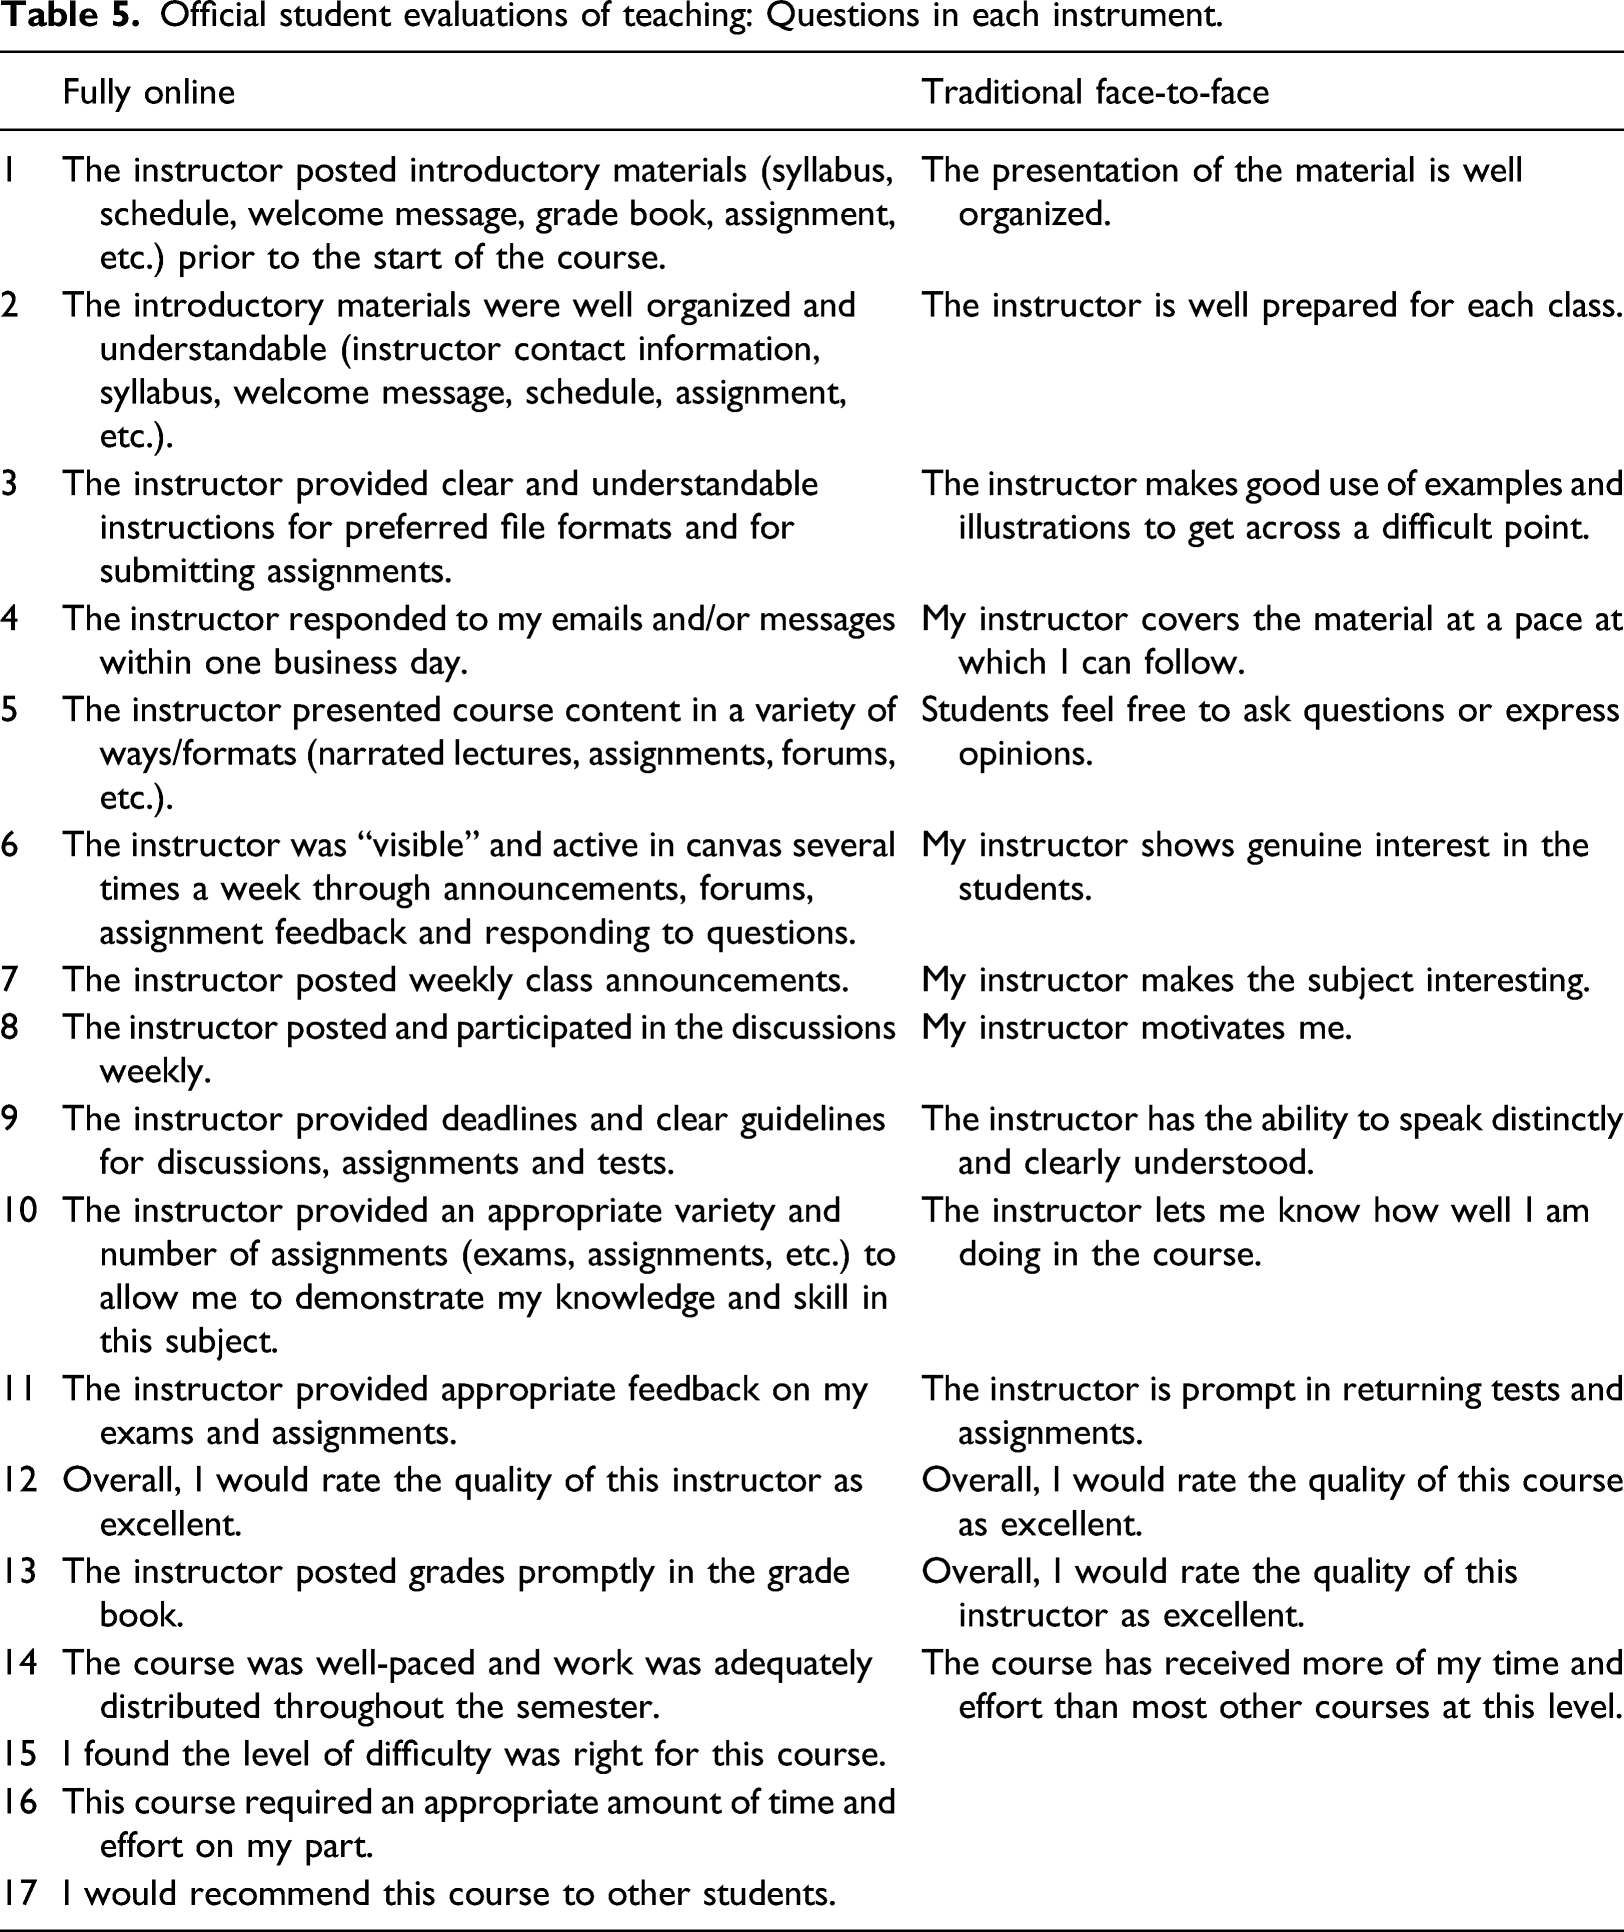
Similarly, Questions 2, 6, and 12 in the online setting were selected for reasons similar to those for questions relating to the FTF setting. Question 2 asked about an instructor’s ability to organize online materials, enabling students to easily understand the material; Question 6 related to an instructor’s online visibility, competence, and commitment. Finally, Question 12 identified students’ overall satisfaction with online instruction for the course. [Note: Question 2 = the introductory materials were well organized and understandable (instructor contact information, syllabus, welcome message, schedule, assignment, etc.); Question 6 = The instructor was “visible” and active in Canvas several times a week through announcements, forums, assignment feedback and responding to questions; and Question 12 = Overall, I would rate the quality of this instructor as excellent.]
Student satisfactions.
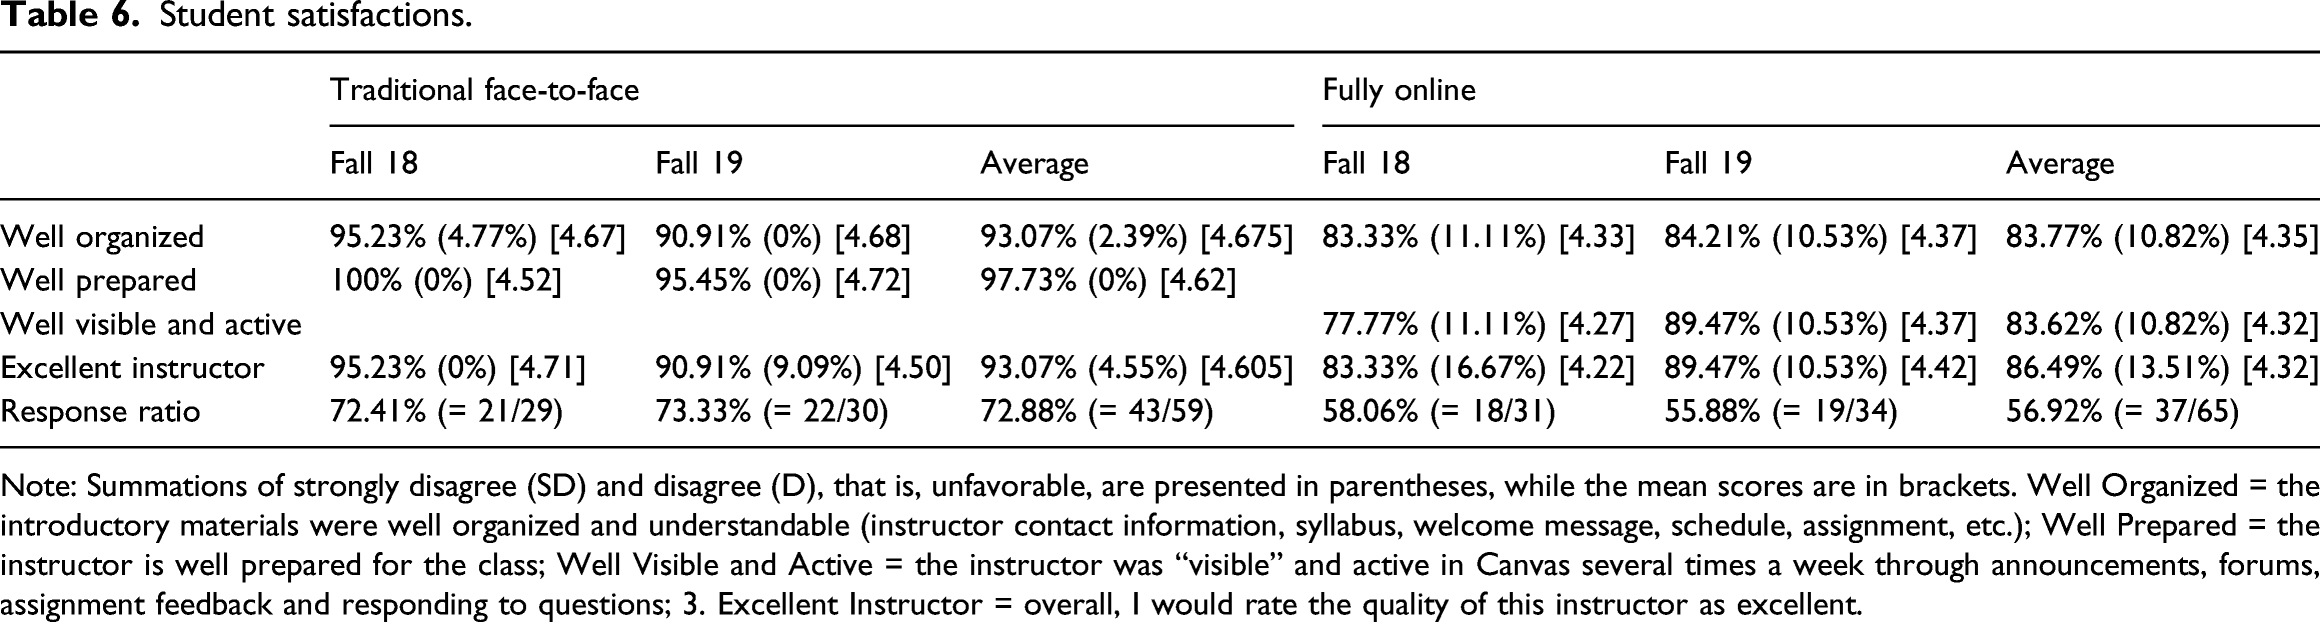
Note: Summations of strongly disagree (SD) and disagree (D), that is, unfavorable, are presented in parentheses, while the mean scores are in brackets. Well Organized = the introductory materials were well organized and understandable (instructor contact information, syllabus, welcome message, schedule, assignment, etc.); Well Prepared = the instructor is well prepared for the class; Well Visible and Active = the instructor was “visible” and active in Canvas several times a week through announcements, forums, assignment feedback and responding to questions; 3. Excellent Instructor = overall, I would rate the quality of this instructor as excellent.
Average for favorable.
Mean Score = (Percentage of strongly agree) x 5 + (Percentage of agree) x 4 + (Percentage of undecided) x 3 + (Percentage of disagree) x 2 + (Percentage of strongly disagree) x 1.
Therefore, the mean scores are presented in brackets in Table 6 (and in Figure 2). Mean score.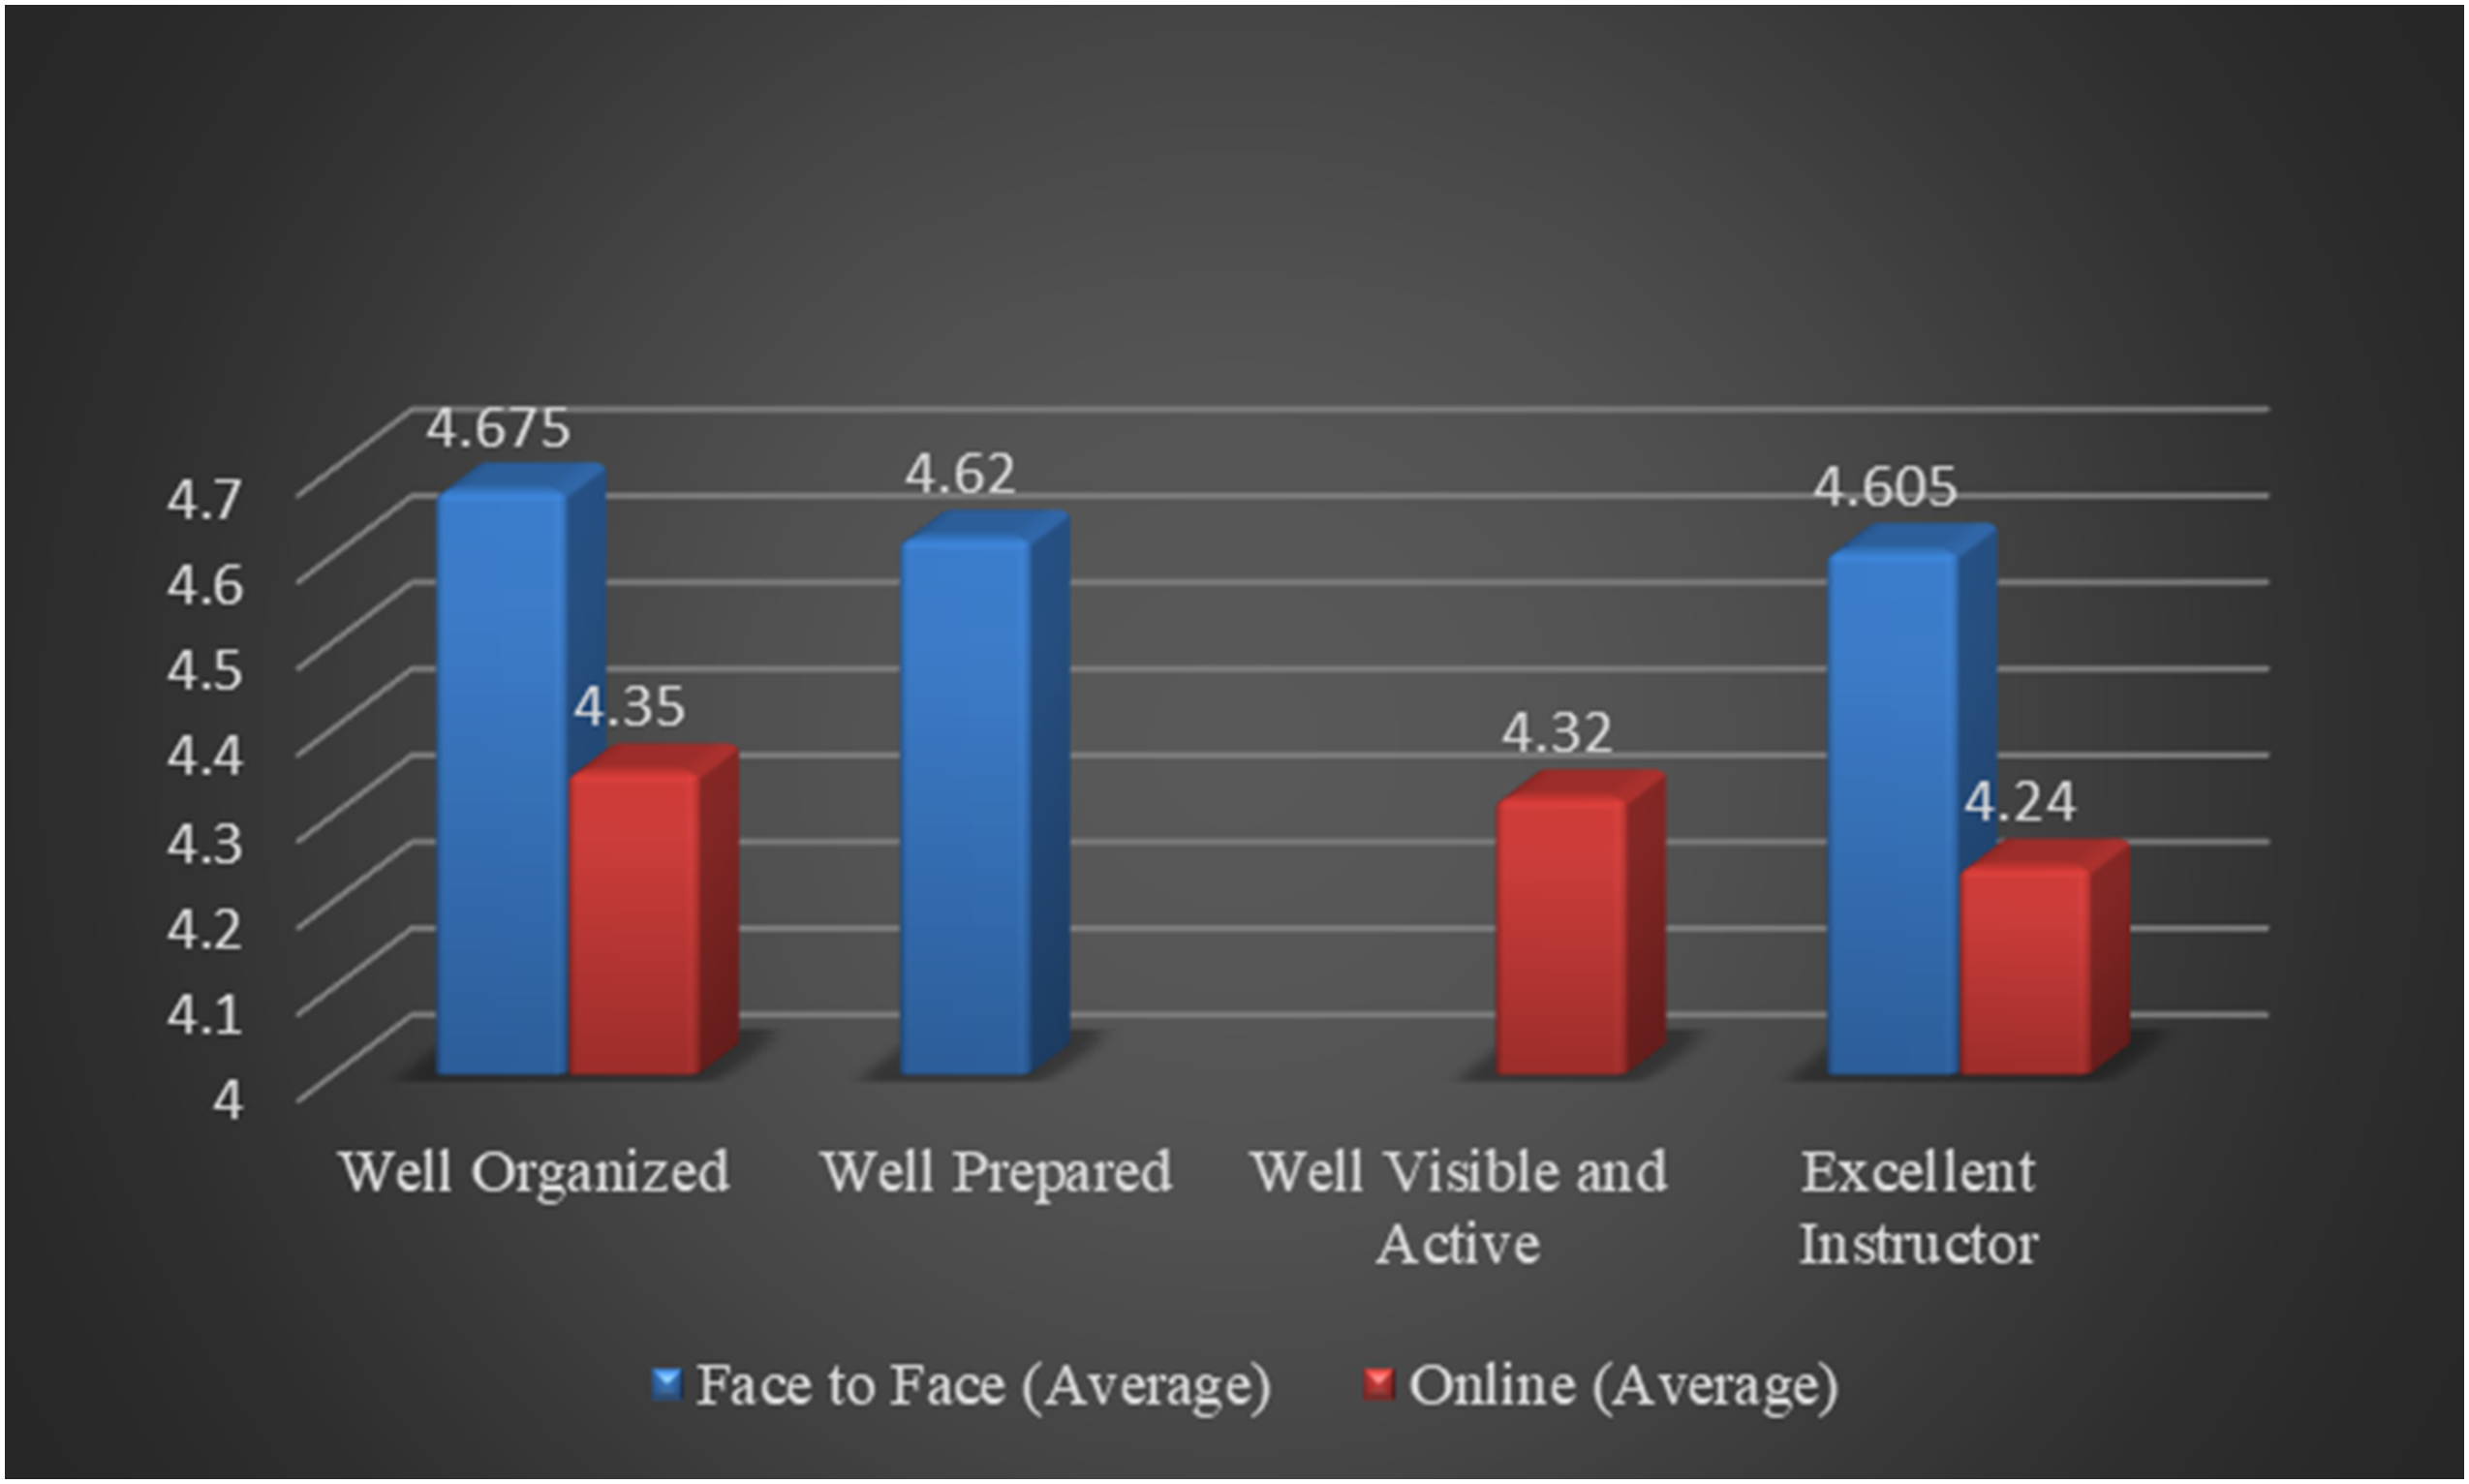
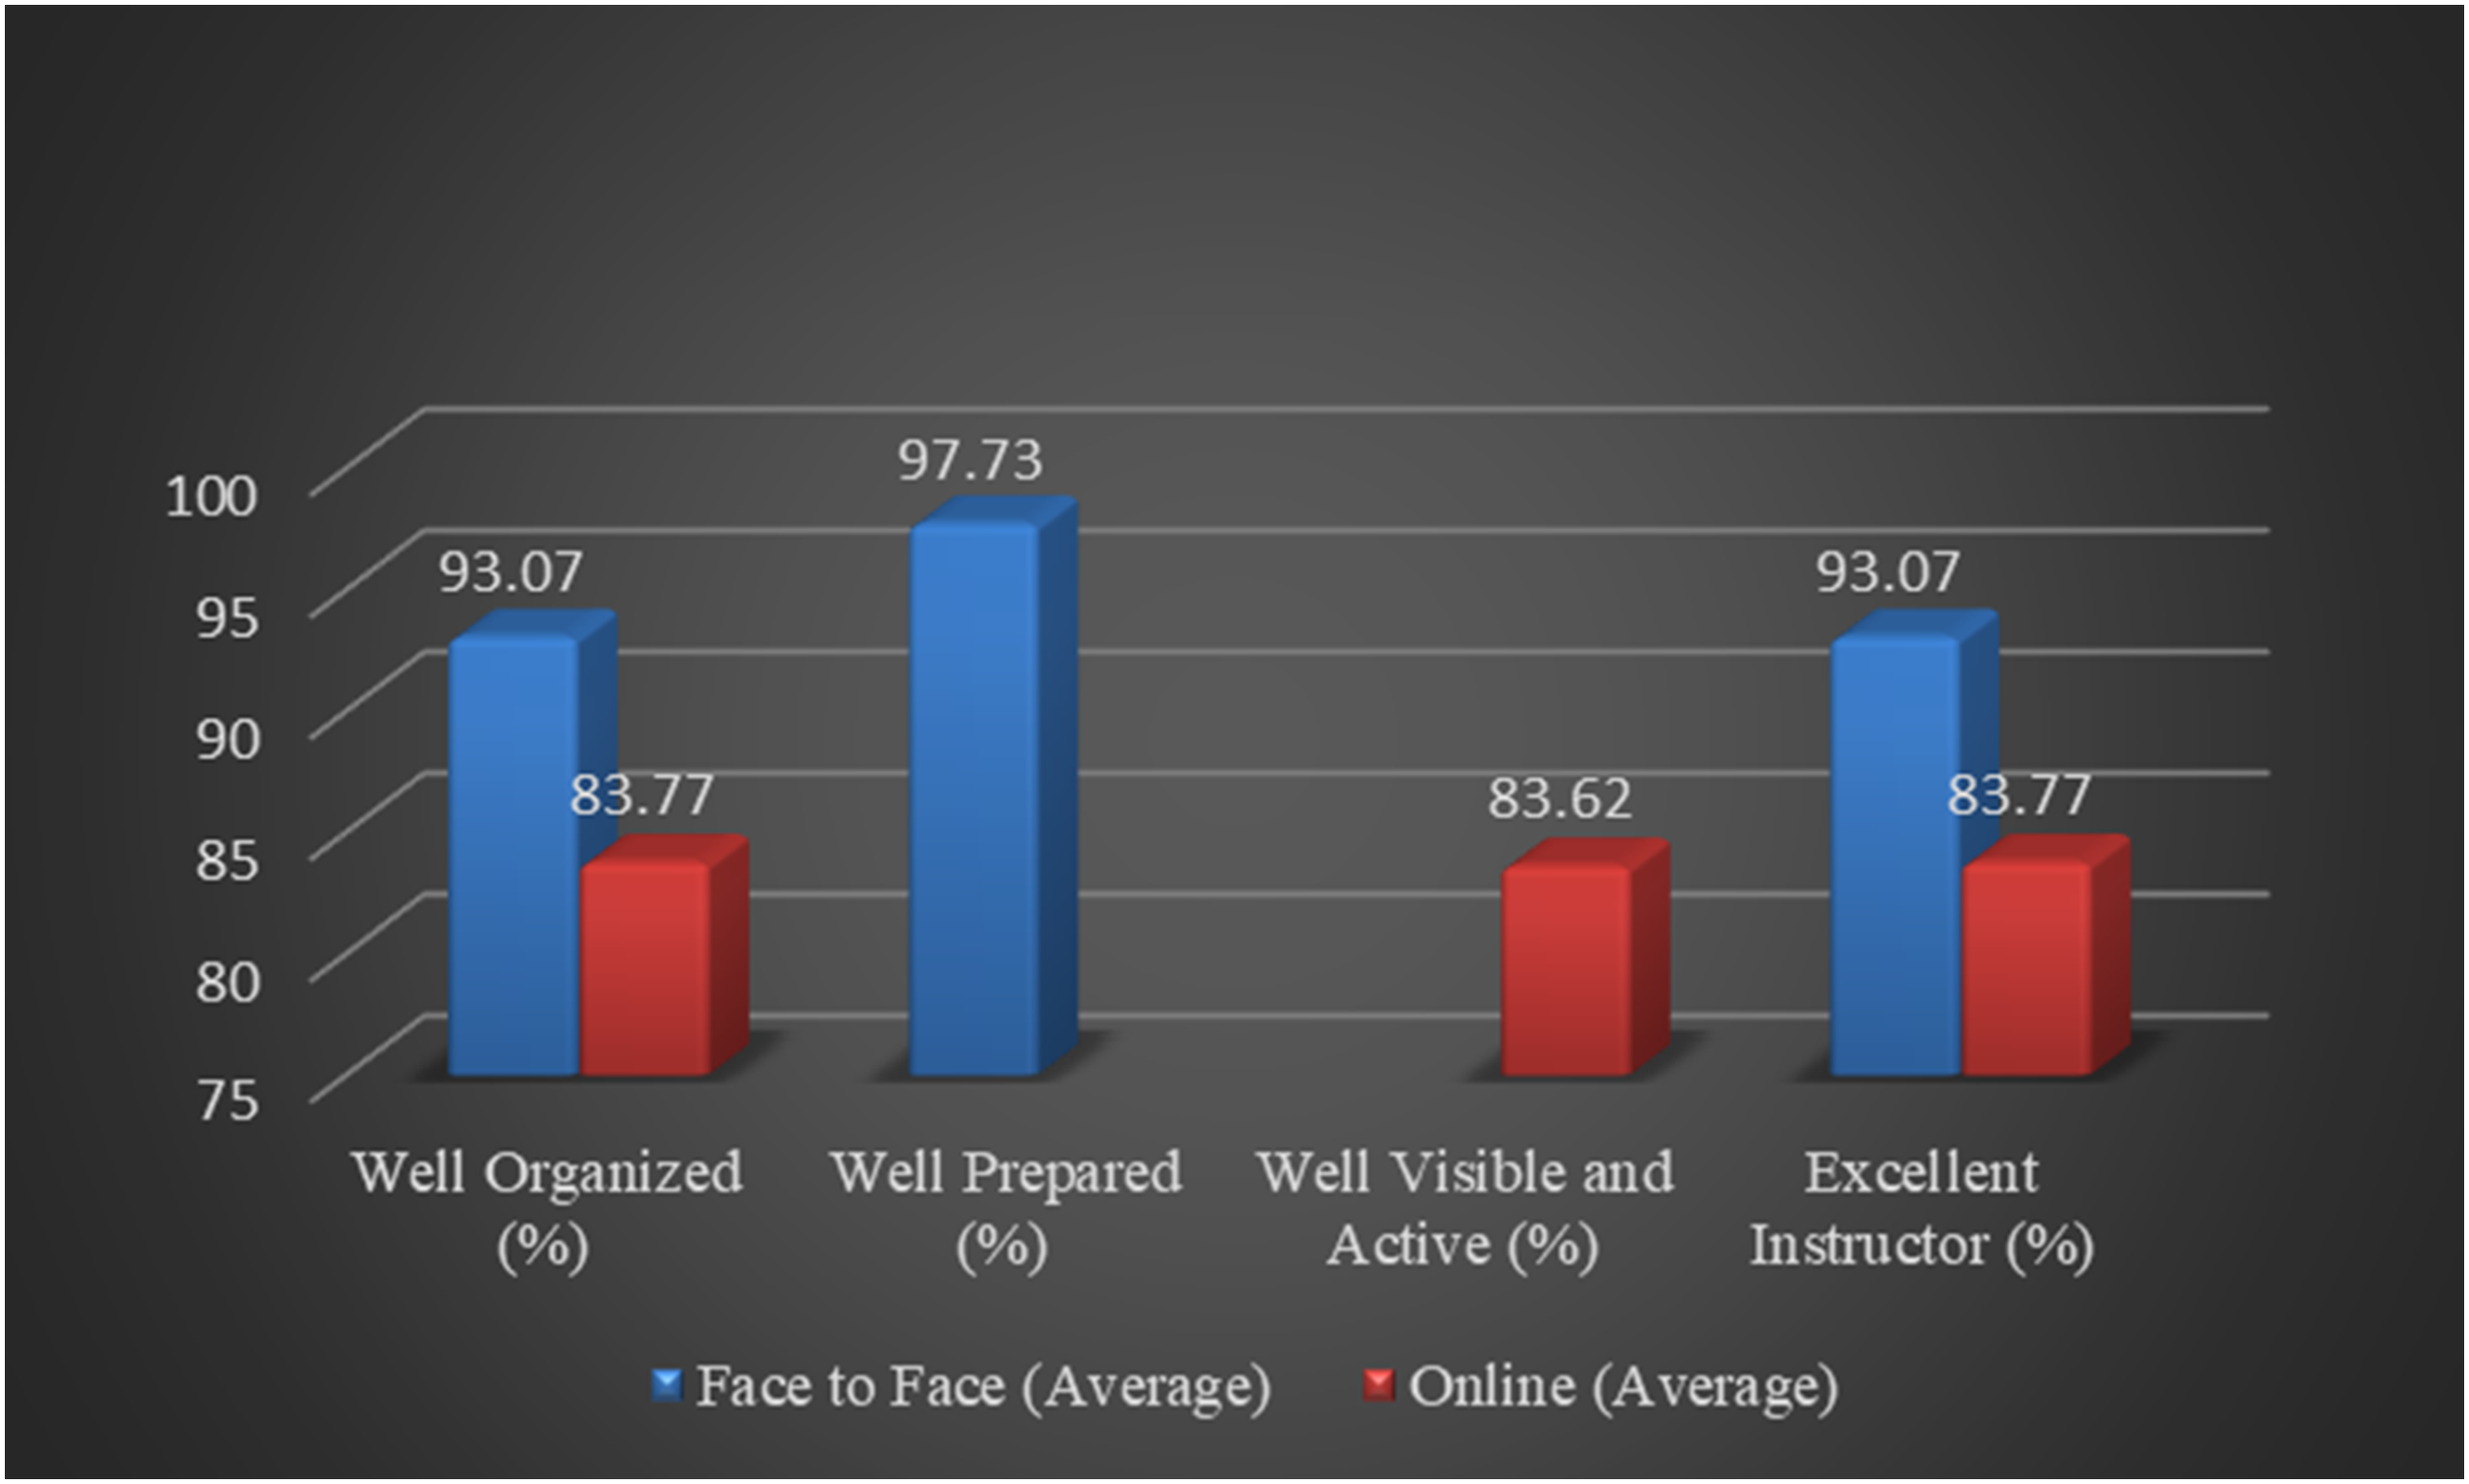
As shown in Table 6 (and Figure 1), the averages for “favorable” in the FTF setting for “Well Organized,” “Well Prepared,” and “Excellent Instructor” were all greater than 93%. However, the averages for “favorable” in the ONL setting for “Well Organized,” “Well Visible and Active,” and “Excellent Instructor” were around 83–86% (below 90%), which was approximately 10% lower than for the FTF setting. In addition, as displayed in Table 6 (and Figure 2), the average of the mean scores in the FTF setting for “Well Organized,” “Well Prepared,” and “Excellent Instructor” were all greater than 4.6. Nevertheless, the average of the mean scores in the ONL setting for “Well Organized,” “Well Visible and Active,” and “Excellent Instructor” were around 4.3 (below 4.4), nearly 0.3 lower than for the FTF setting.
According to the evidence shown above, students’ overall reports of satisfaction with the course and the instructor were higher in the FTF setting than in the ONL setting. However, if we take a closer look at Table 6 (also, Figures 1 and 2), we reach a different conclusion. Let us compare the online settings in Fall 2018 and Fall 2019—the percentages for “favorable” for “Well Organized,” “Well Visible and Active,” and “Excellent Instructor” were all higher in Fall 2019, than in Fall 2018, while the percentages for “unfavorable” for these three items were all lower in Fall 2019 than in Fall 2018. In addition, the mean score for these three items were all higher in Fall 2019 than in Fall 2018. More importantly, the percentage for “favorable” for “Well Visible and Active” was much higher in Fall 2019 (89.47%) than in Fall 2018 (77.77%). Moreover, the mean score for “Excellent Instructor” was much higher in Fall 2019 (4.42) than in Fall 2018 (4.22). Furthermore, let us re-compare the FTF and ONL settings in different years. The percentage difference for “favorable” for “Excellent Instructor” between FTF and online was much lower in Fall 2019 (1.44% = 90.91%–89.47%) than in Fall 2018 (11.9% = 95.23%–83.33%); while the mean score difference for “Excellent Instructor” between these two settings was also much lower in Fall 2019 (0.08 = 4.50–4.42) than in Fall 2018 (0.49 = 4.71–4.22).
The evidence shown above demonstrated that offering zoom lecture meetings in the ONL setting significantly improved students’ satisfaction with the course and the instructor and notably reduced the gap between the traditional FTF and ONL settings.
Consequently, our finding was consistent with Summers et al.’s (2005) finding that students’ overall satisfaction with the course and the instructor could be influenced by the availability of different instructional settings and methods.
Discussions
Two questions remain for discussion. First, why cannot students learn statistics more effectively when engaged with an instructor in ONL versus traditional FTF classroom learning? Second, why cannot students’ overall satisfaction with the course and the instructor be higher in the ONL setting than in the FTF setting? In this section, we discuss potential reasons.
As shown in Table 1, six INS were used in FTF instructional settings but not in ONL settings in Fall 2018. (Note: we will discuss the online setting in Fall 2019). They were (1) daily classroom lectures, (2) classroom discussions, (3) review of weekly homework assignments in the classroom, (4) classroom exercises, (5) classroom game-play experiments, and (6) review of midterm exams in the classroom. To investigate how students who are engaging in learning in FTF settings felt about these six INS, and the ways doing so is benefiting their learning in statistics, we designed a questionnaire on the six INS. This survey was distributed at the end of the semester but before the final exam in the FTF group. Before starting the survey, students were told that they could choose whether to participate in the study and that the survey did not count toward their final course grade. The questionnaire is presented below:
Which of the following do you believe can aid your learning of statistics? (Choose all that are applicable.) 1. Daily classroom lectures 2. Classroom discussions 3. Review of weekly homework assignments in the classroom 4. Classroom exercises 5. Classroom game-play experiments 6. Review of midterm exams in the classroom
Students chose all six INS. Based on their feedback, we identified the top three most effective methods for learning statistics in the traditional FTF instructional context. These top three were (1) classroom exercises, (2) review of weekly homework assignments in the classroom, and (3) daily classroom lectures.
Obviously, these three methods all pointed to the same essential requirement: instant and proximal interactions between students and the instructor. As mentioned earlier, statistics is a math course that is challenging for many students who may not be able to study independently. For these students, proximal access to an instructor who can show them how to solve exercises and problems step-by-step and who can immediately provide answers and feedback is invaluable to an effective instructional experience. “Classroom exercises” and “review of weekly homework assignments in the classroom” were the first and second most important methods, respectively. The reason is that students need instant assistance in resolving problems, and a physically present instructor can provide this immediate service in the classroom, saving students significant time in resolving their difficulties with understanding statistics and statistical methods.
“Daily classroom lectures” was the third method selected by students. Many students need daily classroom lectures that include explanations of important concepts in detail, point out important materials that require additional attention, and focus on problem-solving step-by-step. For example, the topic of “Hypothesis Tests” was a challenging topic for many students. Students struggled with formulating null and alternative hypotheses (whether using a two-tailed test or one-tailed test [upper-tailed or lower-tailed]), and with using test statistics (whether using z test, t test, F test, or
In Fall 2019, the instructor improved the design of the online setting by offering students weekly online zoom lecture meetings, reviewing weekly homework via online zoom, and offering assistance during office hours via online zoom. Although student learning in statistics improved and satisfaction with the course and the instructor increased, the evidence still did not show that online learning was better than traditional FTF classroom learning. Why?
According to the instructor’s report, the online zoom lecture meetings were offered once a week and each was a short lecture (approximately 50 min) per week, which was shorter than the regular classroom lecture (150 min) per week. In addition, not all students attended the online zoom lecture meetings—normally, fewer than 40–50% of students attended online meetings. Moreover, only a few students asked for assistance during office hours via online zoom. We believe that the main reason for the low online attendance rate was that most students’ schedules could conflict with the online zoom meeting schedule. In addition, since the instructor also posted the zoom lectures online and students could watch video lectures whenever they had time, students might not have a strong incentive to attend the online zoom meetings. For that reason, some students may not feel that the instructor is available for and cares about their learning so that they may not be perfectly satisfied with the course and the instructor.
In addition to instant and proximal interactions between students and the instructor, another reason could be students’ opportunity cost as shown in students’ employment hours. As reported in Table 4, the mean number of hours spent at work for pay (29.184 h) for the ONL group was 2.116 h greater than the mean number of hours spent at work for pay (27.068 h) for the FTF group. This information implied that most students in the ONL setting worked longer and more than most students in the FTF classroom setting. Among students engaged in ONL instruction, many actually needed to spend more time studying for the course because the online setting somewhat resembled an independent study class and thus lacked the advantages of the FTF setting mentioned above. On the other hand, students might spend less time studying but more time on-the-job, which could result in a less satisfactory performance than those receiving instruction in an FTF setting.
Furthermore, an instructor’s design of an online course may be imperfect and require improvement. For example, the instructor may offer students more flexible office hours via online zoom meetings, so students may attend and feel that the instructor is available for and cares about their learning. Certainly, if students are not able to study independently and always rely on instructors’ basic instructions, they may not enjoy online learning and may not perform well. All in all, it is possible that these students have elected to enroll in online courses due to employment and their class schedule, not because they prefer online learning.
In short, we believe that instant and physical interaction between students and the instructor as well as number of hours spent on employment could be the two main reasons for why students may not learn statistics more effectively in ONL than in traditional FTF settings.
Conclusions
In this study, we compared traditional FTF classroom and ONL instruction and the effectiveness of each for student learning. We used “Statistics for Business” as a case in this investigation. Our empirical evidence demonstrated that students learn statistics better when in the traditional FTF setting than when engaging in learning offered ONL. That is, student learning occurred more consistently in the traditional FTF setting rather than in learning offered fully online. However, when the instructor taught virtually in a fully online setting, students learned statistics as well as if they were learning in an in-class setting.
Moreover, we compared student evaluations of teaching occurring in both settings to ascertain whether students were more or less satisfied with one option or the other, and the extent of their actual learning in these different instructional settings. The results suggested that students, overall, were more satisfied with the course and the instructor in the FTF setting than in the fully online setting. That is, participation in one of these two instructional settings could influence students’ overall satisfaction. Nevertheless, we also found that when the instructor taught virtually in a fully online setting, students’ satisfaction with the course and the instructor notably improved.
Furthermore, we discussed and explained why students could not learn statistics more effectively when engaged with an instructor in fully online versus traditional FTF classroom learning. Findings showed that teacher-student interaction and instant feedback as well as employment hours could be the two primary reasons for greater success in learning statistics in traditional FTF settings rather than in fully online settings. Although the instructor offered online zoom lecture meetings and office hours via online zoom in Fall 2019 in the fully online setting, the majority of students still did not participate in the online zoom meetings, thereby missing the best opportunity to instantly interact with the instructors and receive prompt feedback from them.
In contrast, even though online classes may be less dynamic in terms of teacher-student interaction and instant feedback than is true for traditional FTF classes, convenience and flexibility are definitely two essential advantages of online classes (e.g., Holbert, 2017 and Slover and Mandernach, 2018 showed that online is better than FTF). Especially during the COVID-19 pandemic, online classes made it possible for students to continue to engage in learning without interruption. Such unforeseen emergencies make the availability of online instructional settings important to teaching and learning.
Our study made two important contributions: (1) Our research method differed from prior ones (e.g., Christmann, 2017; Summers et al., 2005) that used an independent t test—we engaged in model building to develop an estimated multiple-regression equation that enabled us to assess the relationship between an outcome (the dependent variable) and multiple predictors (the independent variables), notifying us about the predictive information associated with each predictor when we control for all other predictors. (2) We adopted an instruction method that involved virtual teaching in a fully online class and demonstrated that students learned statistics better in this blended class than through a fully online class that did not include virtual elements. Instructors who teach fully online may consider offering students some virtual lectures, such as review sections, to strengthen communication and interaction between students and instructors. Therefore, our study contributes importantly to the practical aspects of teaching statistics fully online.
Nevertheless, our research had one limitation: take-home exams increased the opportunity for cheating. We should note that we did not uncover direct and strong evidence of this unfortunate activity. Therefore, while the possibility of cheating could bias our investigation, we believe that this bias (if present) would not significantly influence our empirical findings because if it occurred, we believe it did so among a small percentage of all students.
Finally, our research limitation pointed to an important issue: while cheating on exams in online classes is a long-standing problem, what does this possibility mean for those eventually receiving degrees through online programs? We leave this and related questions for future investigation and discussion.
Footnotes
Declaration of conflicting interests
The author(s) declared no potential conflicts of interest with respect to the research, authorship, and/or publication of this article.
Funding
The author(s) received no financial support for the research, authorship, and/or publication of this article.
Author Biography
Tin-Chun Lin is a Full Professor of Economics at Indiana University–Northwest. He serves as an Editor-in-Chief for International Journal of Economic Issues; Asian Journal of Arts, Humanities and Social Studies; Studies in Economics and International Finance; and Asian Journal of Economics and Finance; and as a Guest Editor for Sustainability.