
Abstract
Moisture dynamics of wood and wood-based materials play a major role in wood durability against different decay organisms. Their impact becomes evident when wood is exposed, but not permanently wet. To date, however, this has only been taken into account indirectly and therefore inadequately when testing the durability of wood. While test methods are available, for example, to determine the permeability of wood, larger amounts of data, covering a larger range of materials and generated by a larger number of testing laboratories, are required to ensure acceptance and allow for the classification of moisture-related dynamics in wood. This study aimed therefore at investigating the intra-species variation of moisture dynamics of different European-grown wood species. Different stem zones of Norway spruce (Picea abies), Scots pine (Pinus sylvestris), European larch (Larix decidua), European beech (Fagus sylvatica), English oak (Quercus robur), and black locust (Robinia pseudoacacia) were examined. Their moisture dynamics were determined using different methods that take into account both the uptake of liquid water and the absorption and release of water vapour. The moisture dynamics differed significantly not only between the wood species examined, but partly also between the stem zones, particularly between juvenile and mature heartwood.
Keywords
Introduction
In addition to the material-inherent resistance of wood against decay fungi, the moisture dynamics of wood have a significant impact on biological durability. Hydrophobic extractives such as oils, resins, or waxes, as well as anatomical features that increase the moisture exclusion of wooden tissues, can be effective against the wetting of wood.1,2,3 Hence, the conditions for the growth and decay of fungi and other wood-destroying organisms can be significantly impaired. Although the interrelationship between the moisture dynamics of wood and its biological durability has long been known,4,5 the former still receives little attention in durability testing. 6 Solely, in above-ground field tests, the moisture performance is indirectly considered. 7 In contrast, neither laboratory decay tests with basidiomycete monocultures nor in-ground field tests do not account for moisture behaviour, because wood specimens are kept permanently wet.8,9
More recently, efforts were made to determine the moisture dynamics of wood using standardised methods and to make it usable for durability classification.6,10 According to the European standard, 11 the ‘permeability to water and performance in use of wood and wood-based materials are also important issues. However, because standardised methods aiming to assess and classify these factors do not exist and/or have not been extensively experienced yet, preliminary guidance is given […]’. However, the latter has so far been limited to referring to different testing standards such as CEN/TS 16818:2018 (floating, submersion and desorption tests), 12 EN 927-5:2023 (floating tests), 13 and EN ISO 535:2023 (Cobb method). 14 These methods allow to determine the permeability of wood to water, but it is not clear from EN 350:2026 11 how permeability to water can be classified. The current debate addresses different approaches to classify permeability and its integration into the existing classification of biological durability. Classifying the two properties separately would inevitably raise the question of which class or property is more relevant. This is particularly important because permeability does not play a role in use conditions, where wood is permanently wet such as in soil or water contact. Alternatively, it had been proposed to calculate both properties separately, express them as relative values (in analogy to x-values, see e.g. EN 252), 9 calculate a weighted average of both, and link x-value ranges to durability classes. Whatever a solution might ultimately look like, the development of such a solution and agreement on it are made more difficult by the fact that there is still far too little data available. The permeability and other moisture dynamics of more materials should be tested and determined by further test laboratories in order to create a larger database and a higher acceptance of the property itself and the available test methods.
Previous work showed recently that biological durability can be severely affected by natural variability. 15 Similarly, the moisture dynamics of wood are also subject to a high degree of variability. Therefore, this study aimed at investigating the intra-species variation of moisture dynamics of different European-grown wood species. For this purpose, the moisture dynamics of wood should be determined using different methods that take into account both the uptake of liquid water and the absorption and release of water vapour.
Materials and methods
Wood specimens
Sets of wood specimens of three different dimensions and configurations (Figure 1) were prepared from Norway spruce (Picea abies), Scots pine (Pinus sylvestris), European larch (Larix decidua), European beech (Fagus sylvatica), English oak (Quercus robur), and black locust (Robinia pseudoacacia). Except for beech, the inner, central and outer heartwood (i.e., hwinner, hwcentral, and hwouter) were distinguished. In addition, sapwood (sw) of Norway spruce and Scots pine were tested separately; the sapwood portions of the remaining heartwood-forming species were too small for preparing specimens with the required dimensions. The number of replicates for each combination of test, wood species and stem section was n = 10.
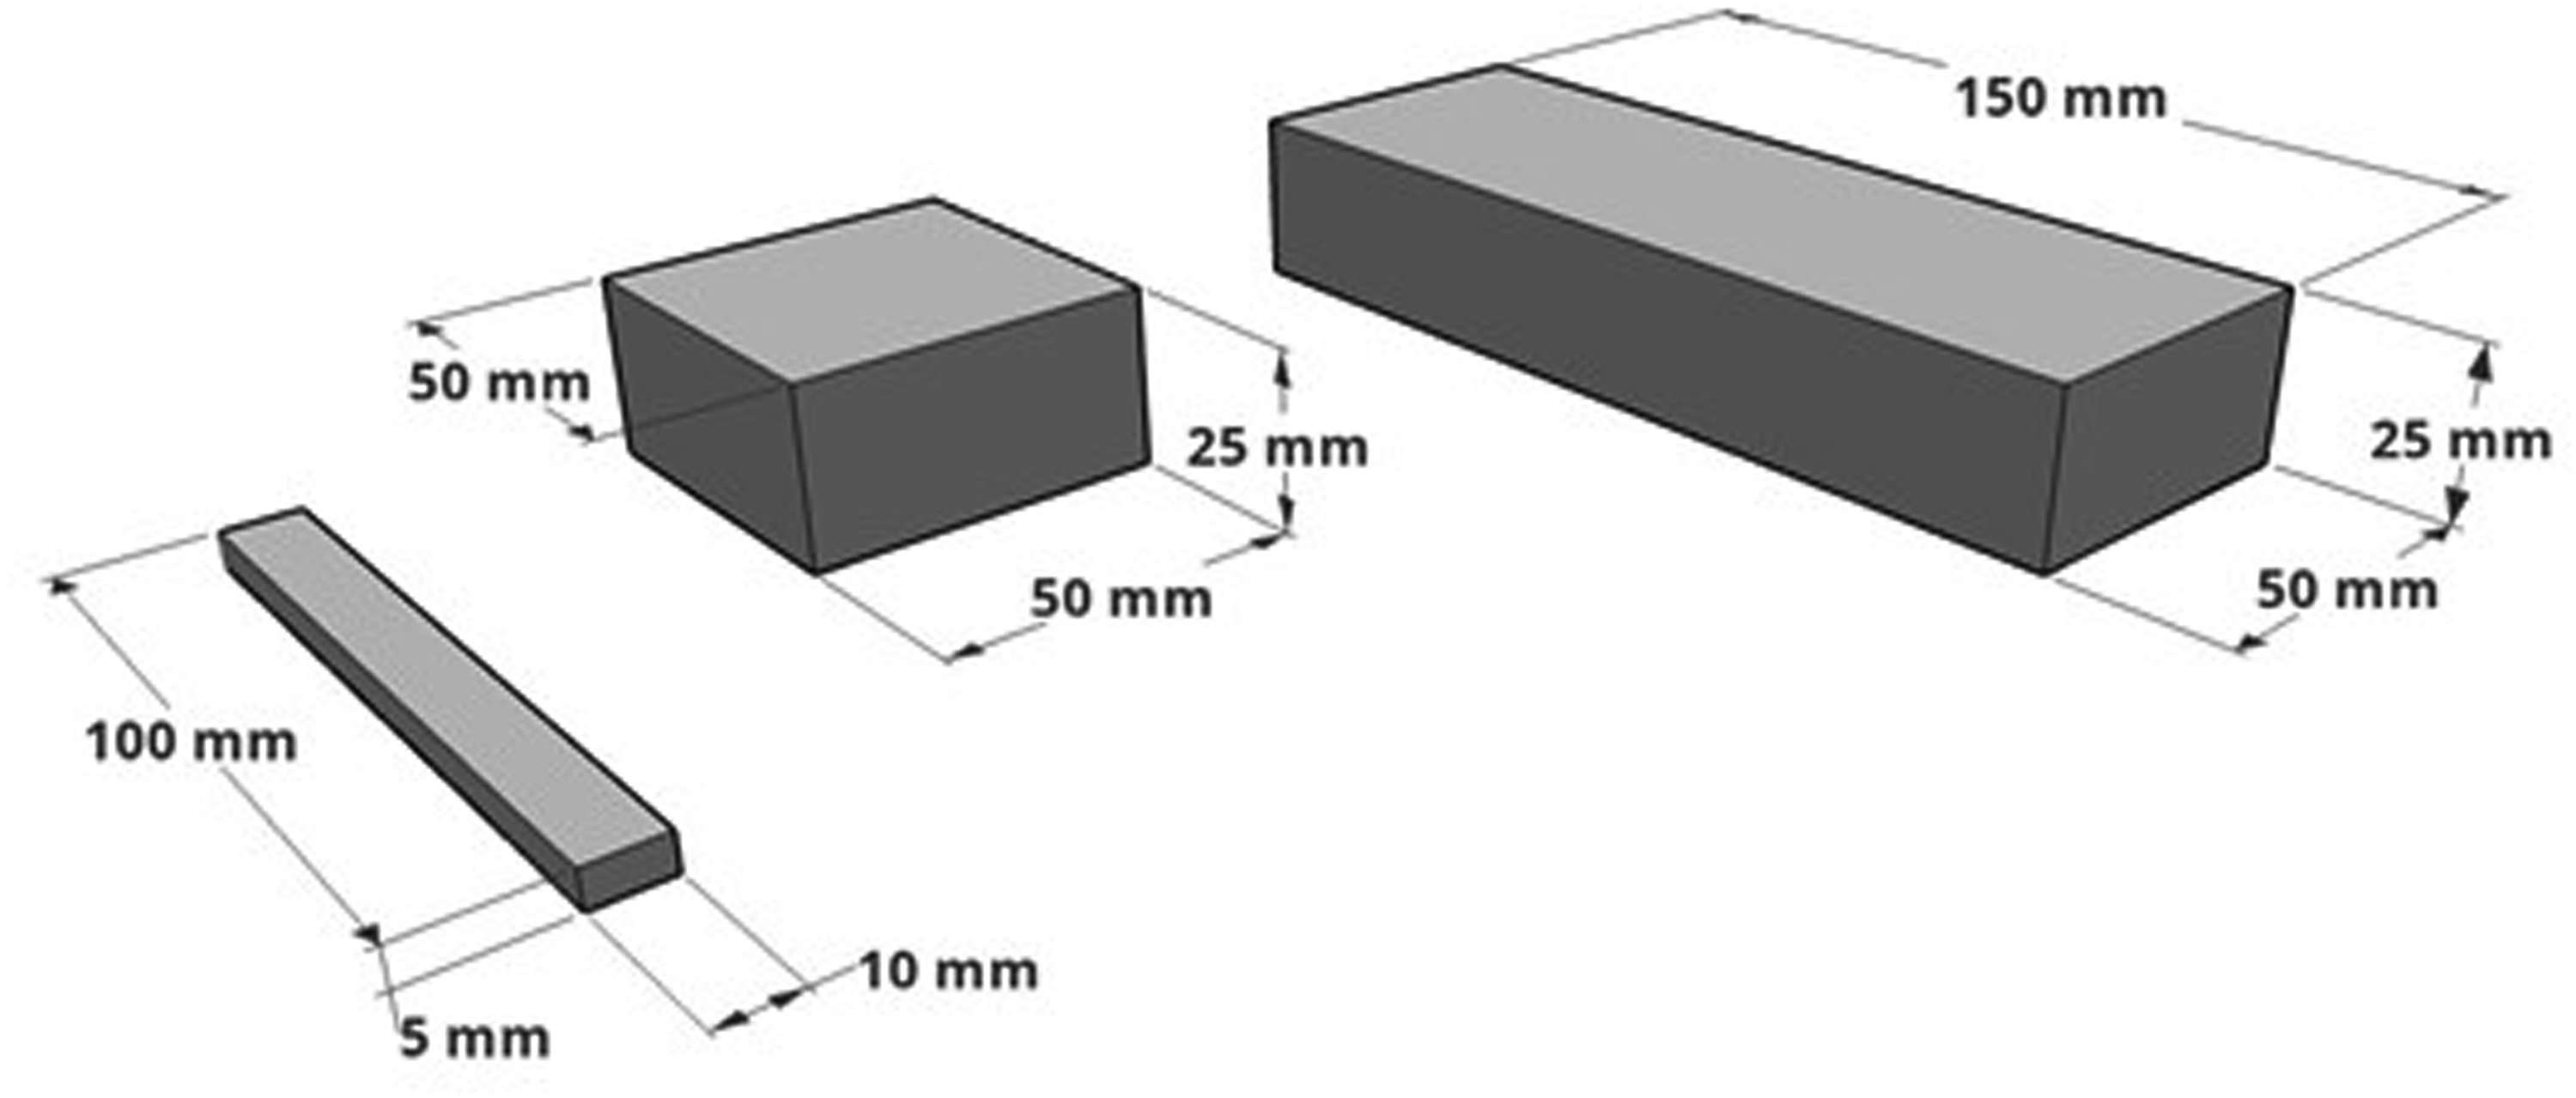
Specimen configuration for 24 h water uptake and release tests (W24), capillary water uptake tests, floating tests, and submersion tests (from left to right).
Specimens of 100 (ax.) × 10 × 5 mm were subjected to 24-h water uptake and release tests (W24 tests). 7 The sides of floating (50 (ax.) × 50 × 25 mm) and submersion (150 (ax.) × 50 × 25 mm) specimens were sealed with a polyurethane sealant (Sikaflex® 221i, Sika Austria GmbH, Austria, Figure 1, dark grey) prior testing the moisture performance according to CEN/TS 16818:2018.
Laboratory moisture performance tests
Capillary water uptake test
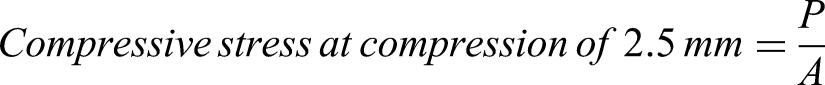
Short-term water absorption, i.e., the capillary water uptake (CWU) was measured in a tailor-made device (CWU-metre, Figure 2). Specimens of 100 (ax.) × 5 × 10 mm were conditioned at 20 °C/65% relative humidity (RH) till the constant mass of the specimen was achieved. The specimens were fixed in the CWU-metre so that the specimens' end-grain surfaces were positioned to be in contact with water for 200 s. The specimens were subsequently weighed to the nearest 10−3 g. The capillary water uptake was determined over time in g/cm² according to equation (1):
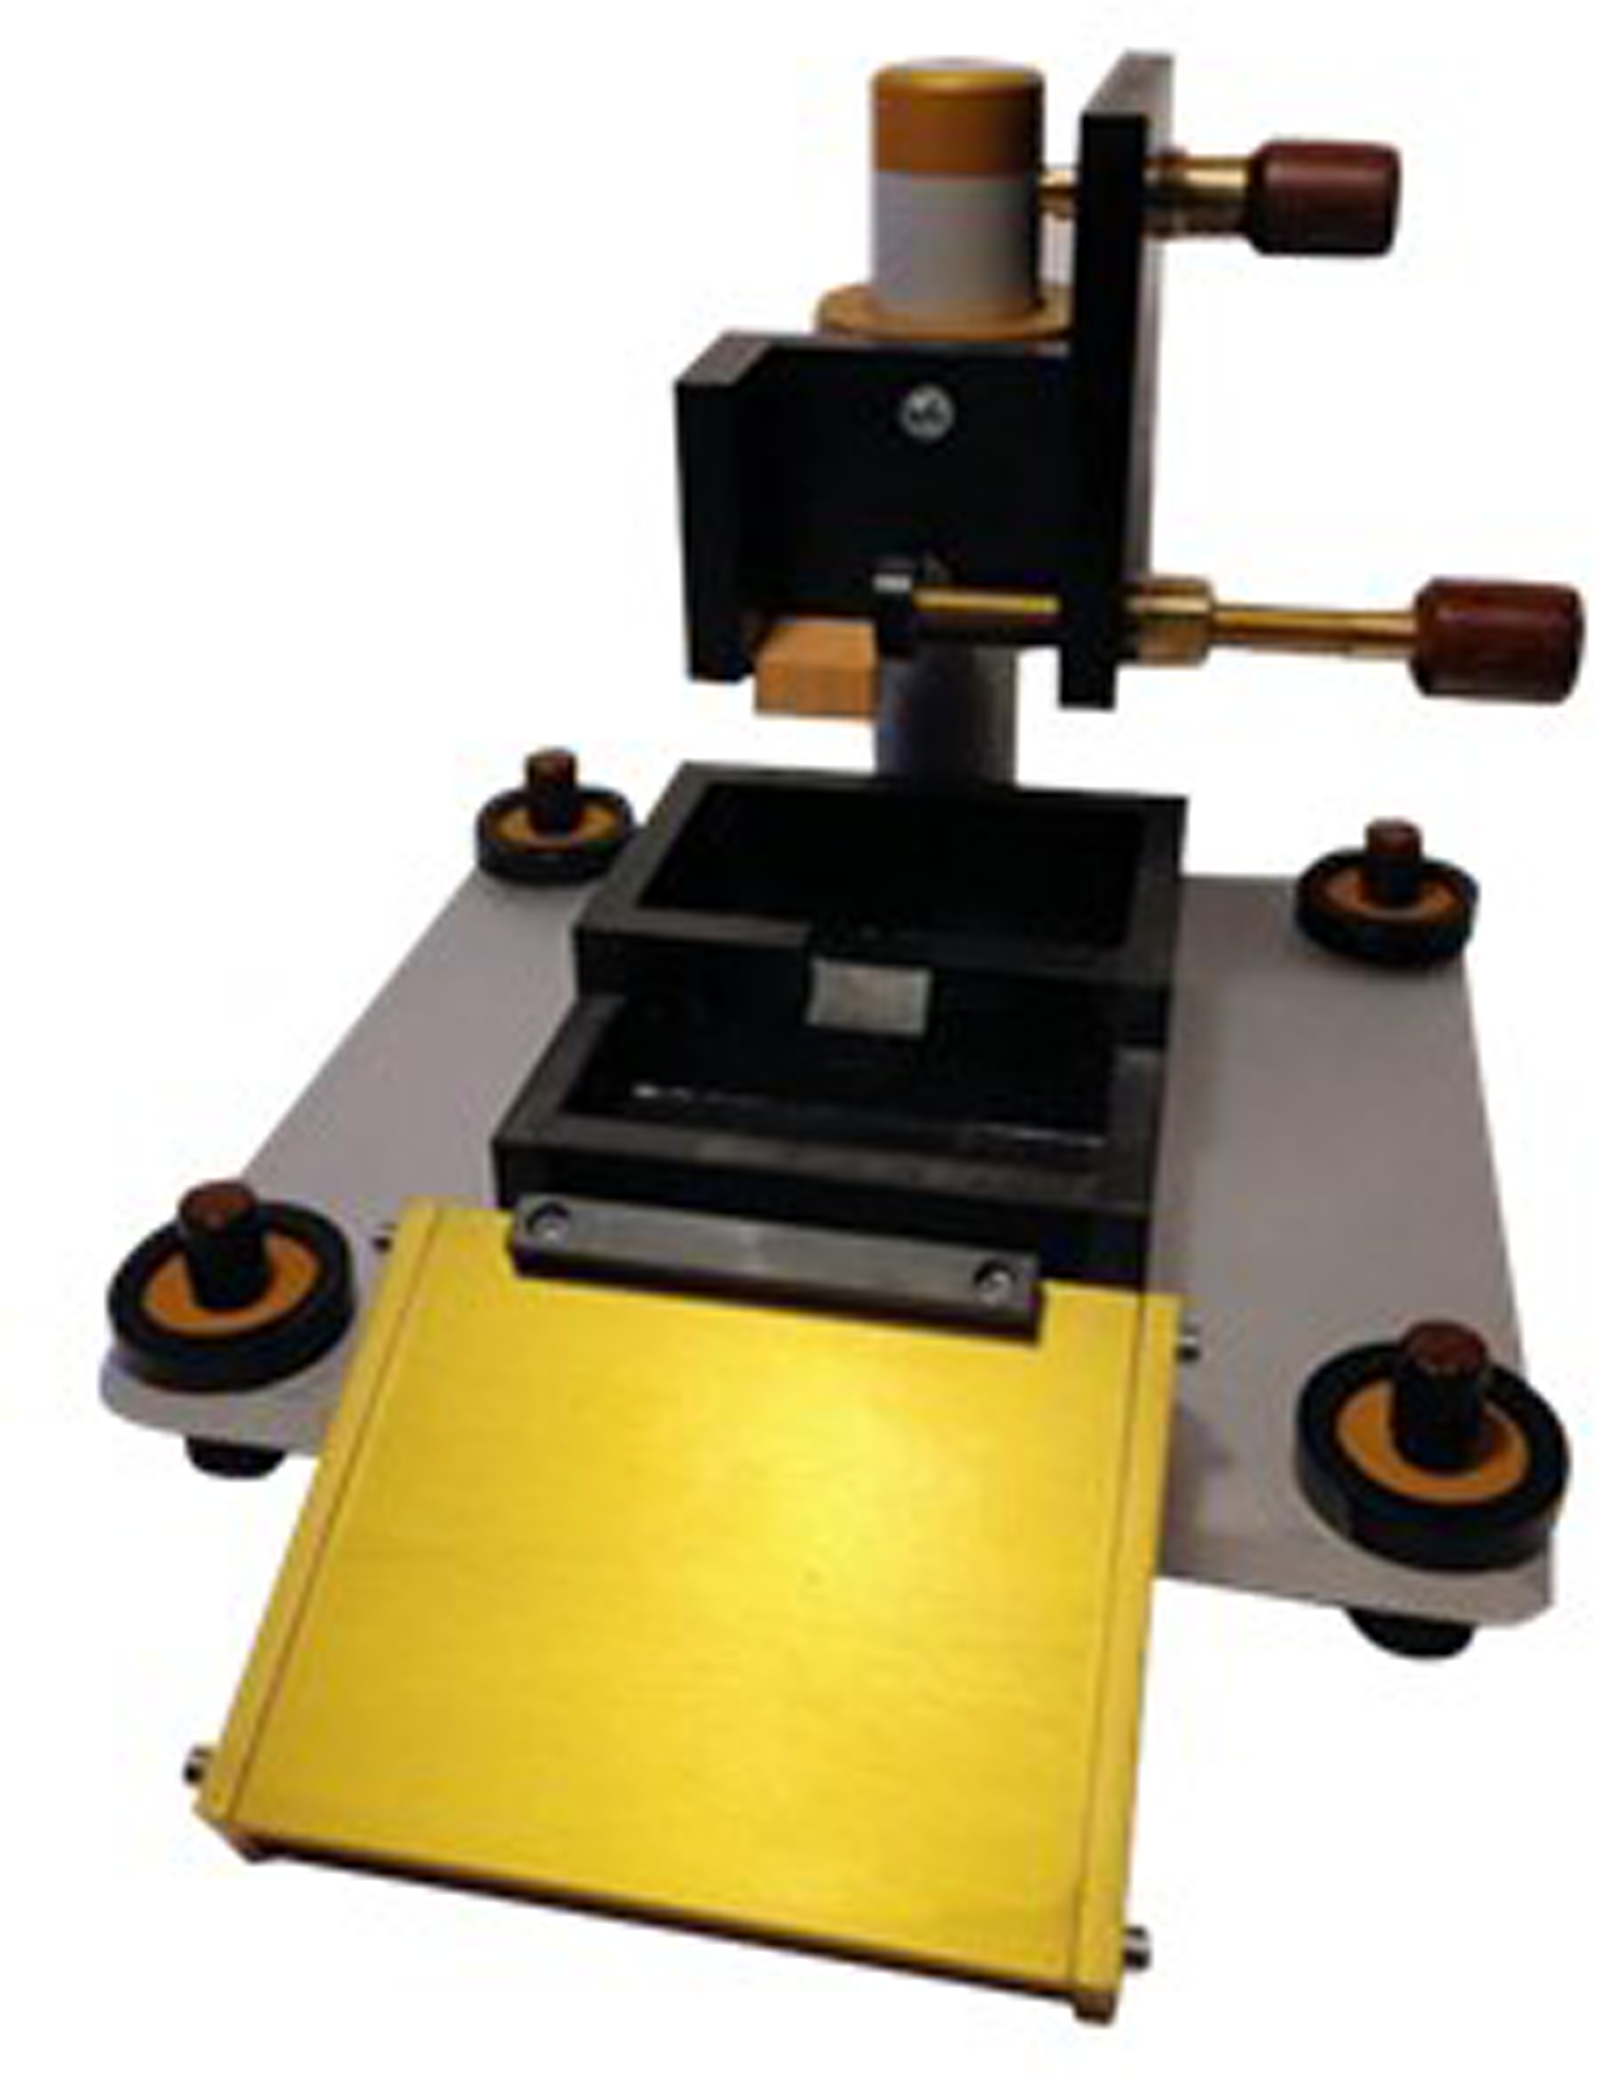
Measurement device for determining the capillary water uptake of wood in longitudinal direction (CWU-metre): water basin with an overflow to guarantee a constant water level and to prevent the test specimens from submerging too deeply into the water.
CWU = capillary water uptake [g/cm²] m65%RH = mass at 20 °C/65 % RH before CWU testing [g] m200s = mass after 200 s in contact with water [g] A = cross-sectional area of the specimens [cm²]
W24-tests (24-h water uptake and release tests) 7
Liquid water uptake by submersion
Specimens of 100 (ax.) × 10 × 5 mm were oven-dried at 103 °C until constant mass. The oven-dry mass was measured to the nearest 10−3 g. Oven-dry specimens were submerged in a sealed plastic container with water and placed in a climate chamber with 20 °C/65% RH. Specimens were separated from each other by square-shaped stainless steel meshes. The specimens were weighed again after 24-h submersion. The liquid water uptake of the specimens (W24submersion) was determined, and the resulting moisture content (MC) was calculated (equation (2)).
W24submersion = liquid water uptake during 24-h submersion [%] m0 = oven-dry mass before submersion [g] msubmerged = mass after 24 h of submersion [g]
Water vapour uptake in water-saturated atmosphere
Specimens of 100 (ax.) × 10 × 5 mm were oven-dried at 103 °C until constant mass. The oven-dry mass was measured to the nearest 10−3 g. The bottom of a miniature climate chamber (sealed plastic container with stainless steel perforated plates) was filled with 5 L water. Specimens were exposed with approx. 5 mm distance to each other on the stainless-steel plates above water. The containers were stored in a climate chamber with 20 °C/65% RH and specimens weighed again after 24 h. The water uptake of the specimens (W24100%RH) was determined and the resulting MC was calculated (equation (3)).
W24100%RH = water vapour uptake during 24-h exposure above water [%] m0 = oven-dry mass before exposure [g] m100%RH = mass after 24 h exposure above water [g]
Desorption
Specimens of 100 (ax.) × 10 × 5 mm were stored in sealed containers above water at 20 °C (almost 100% RH) until constant mass. The mass at approx. cell wall saturation (CWS) was measured to the nearest 10−3 g. Specimens were exposed directly on freshly activated silica gel in sealed boxes (0% RH) and weighed again after 24 h. The water vapour release (desorption) of the specimens during 24 h was determined and expressed as a relative value of the mass at CWS (equation (4)).
W240%RH = water vapour release during 24-h exposure at 0% RH [%] mCWS = mass at CWS [g] m0%RH = mass after 24 h exposure to 0% RH [g]
Floating and submersion test 12
Floating test – Absorption and desorption cycle
Specimens of 50 (ax.) × 50 × 25 mm were dried at 103 °C until constant mass. The oven-dry mass (m0) was measured to the nearest 10−2 g. Prior testing, specimens were conditioned at 20 °C, 65% RH. After conditioning, four sides (including end-grain surfaces) were sealed with a polyurethane sealant (Figure 1), the weight of the sealant recorded and the initial specimen mass (mi) measured. The moisture performance was tested during a water uptake (absorption) and release (desorption) cycle according to CEN/TS 16818:2018 with ten specimens of each material. Plastic containers were filled with water and stored at normal climate (20 °C/65% RH). For the water uptake cycle, test specimens were placed approx. 10 mm under water level to ensure that one specimen surface (50 × 50 mm) was completely submerged for the entire absorption interval. Test specimens were removed in intervals after 1, 4, 8, 24, 48, 72 and 144 h, liquid water on the surface dabbed and the weight recorded to the nearest 10−2 g.
After 144 h absorption, all test specimens were put on a stainless-steel grid on their sealed side and stored at 20 °C/65% RH. The minimum distance between specimens was 10 mm to guarantee adequate air circulation during the desorption cycle (drying). Test specimens were weighed to the nearest 10−2 g after 1, 4, 8, 24, 48, 72, 96 and 168 h.
Submersion test – Absorption and desorption cycle
Specimens of 150 (ax.) × 50 × 25 mm were dried at 103 °C until constant mass. The oven-dry weight (m0) was measured to the nearest 10−2 g. Prior testing, specimens were conditioned at 20 °C, 65% RH, sealed as described above (Figure 1) and the initial specimen mass (mi) detected. The moisture performance was tested during liquid water uptake and desorption cycles according to CEN/TS 16818:2018 with 10 specimens of each material. Plastic containers were filled with water and stored at normal climate (20 °C / 65% RH). For the water uptake cycle, test specimens were placed in the water so that they were fully submerged over the entire absorption cycle. Test specimens were removed in intervals after 1, 4, 8, 24, 48, 72 and 144 h, liquid water on the surface dabbed and the weight recorded to the nearest 10−2 g. After 144 h absorption, a desorption cycle (drying) was performed as described for the floating test procedure.
Indicators and calculations from floating and submersion tests
For each interval during the absorption and desorption period, the specimen's weight (m) was recorded and the moisture content (MC, equation (5)) calculated based on the oven-dry mass of the tested specimen without sealant (mo).
MC = moisture content of the specimen [%] m0 = oven-dry mass without sealant [g] m = mass after absorption/desorption without sealant [g]
Note: Deviating from CEN/TS 16818:2018, the following moisture indicators taken from CEN/TS 16818:2018 were calculated on the basis of percentage MC values instead of absolute values, as listed by the following equations.
The amount of absorbed moisture after 144 h (a144) was calculated following equation (6). a144 = moisture content after moisture absorption for 144 h [%] MCi = initial moisture content of the specimen [%] MC144 = moisture content of the specimen after 144 h of water uptake [%]
The amount of desorbed moisture after 168 h (d168), consequently the residual MC after desorption, was calculated following equation (7). d168 = moisture content after desorption for 168 h [%] MC144 = moisture content of the specimen after 144 h of water uptake [%] MC312 = moisture content of the specimen after 168 h of desorption [%]

The residual moisture content (rm168), which represents the increase in moisture content after 144 h of absorption followed by 168 h of desorption, compared to the initial moisture content, was calculated according to equation (8). rm168 = residual moisture content of the specimen after 312 h testing [%] a144 = moisture content after moisture absorption for 144 h [%] d168 = moisture content after desorption for 168 h [%]

The residue (res312) was calculated (equation (9)), representing the moisture content left in the test specimen after 168 h desorption (rm168) as a percentage of the absorbed moisture after 144 h (a144). res312 = residue in the specimen after 312 h testing expressed as a percentage [%] rm168 = residual moisture content of the specimen after 312 h testing [%] a144 = moisture content after moisture absorption for 144 h [%]
Wetting ability factors kwa
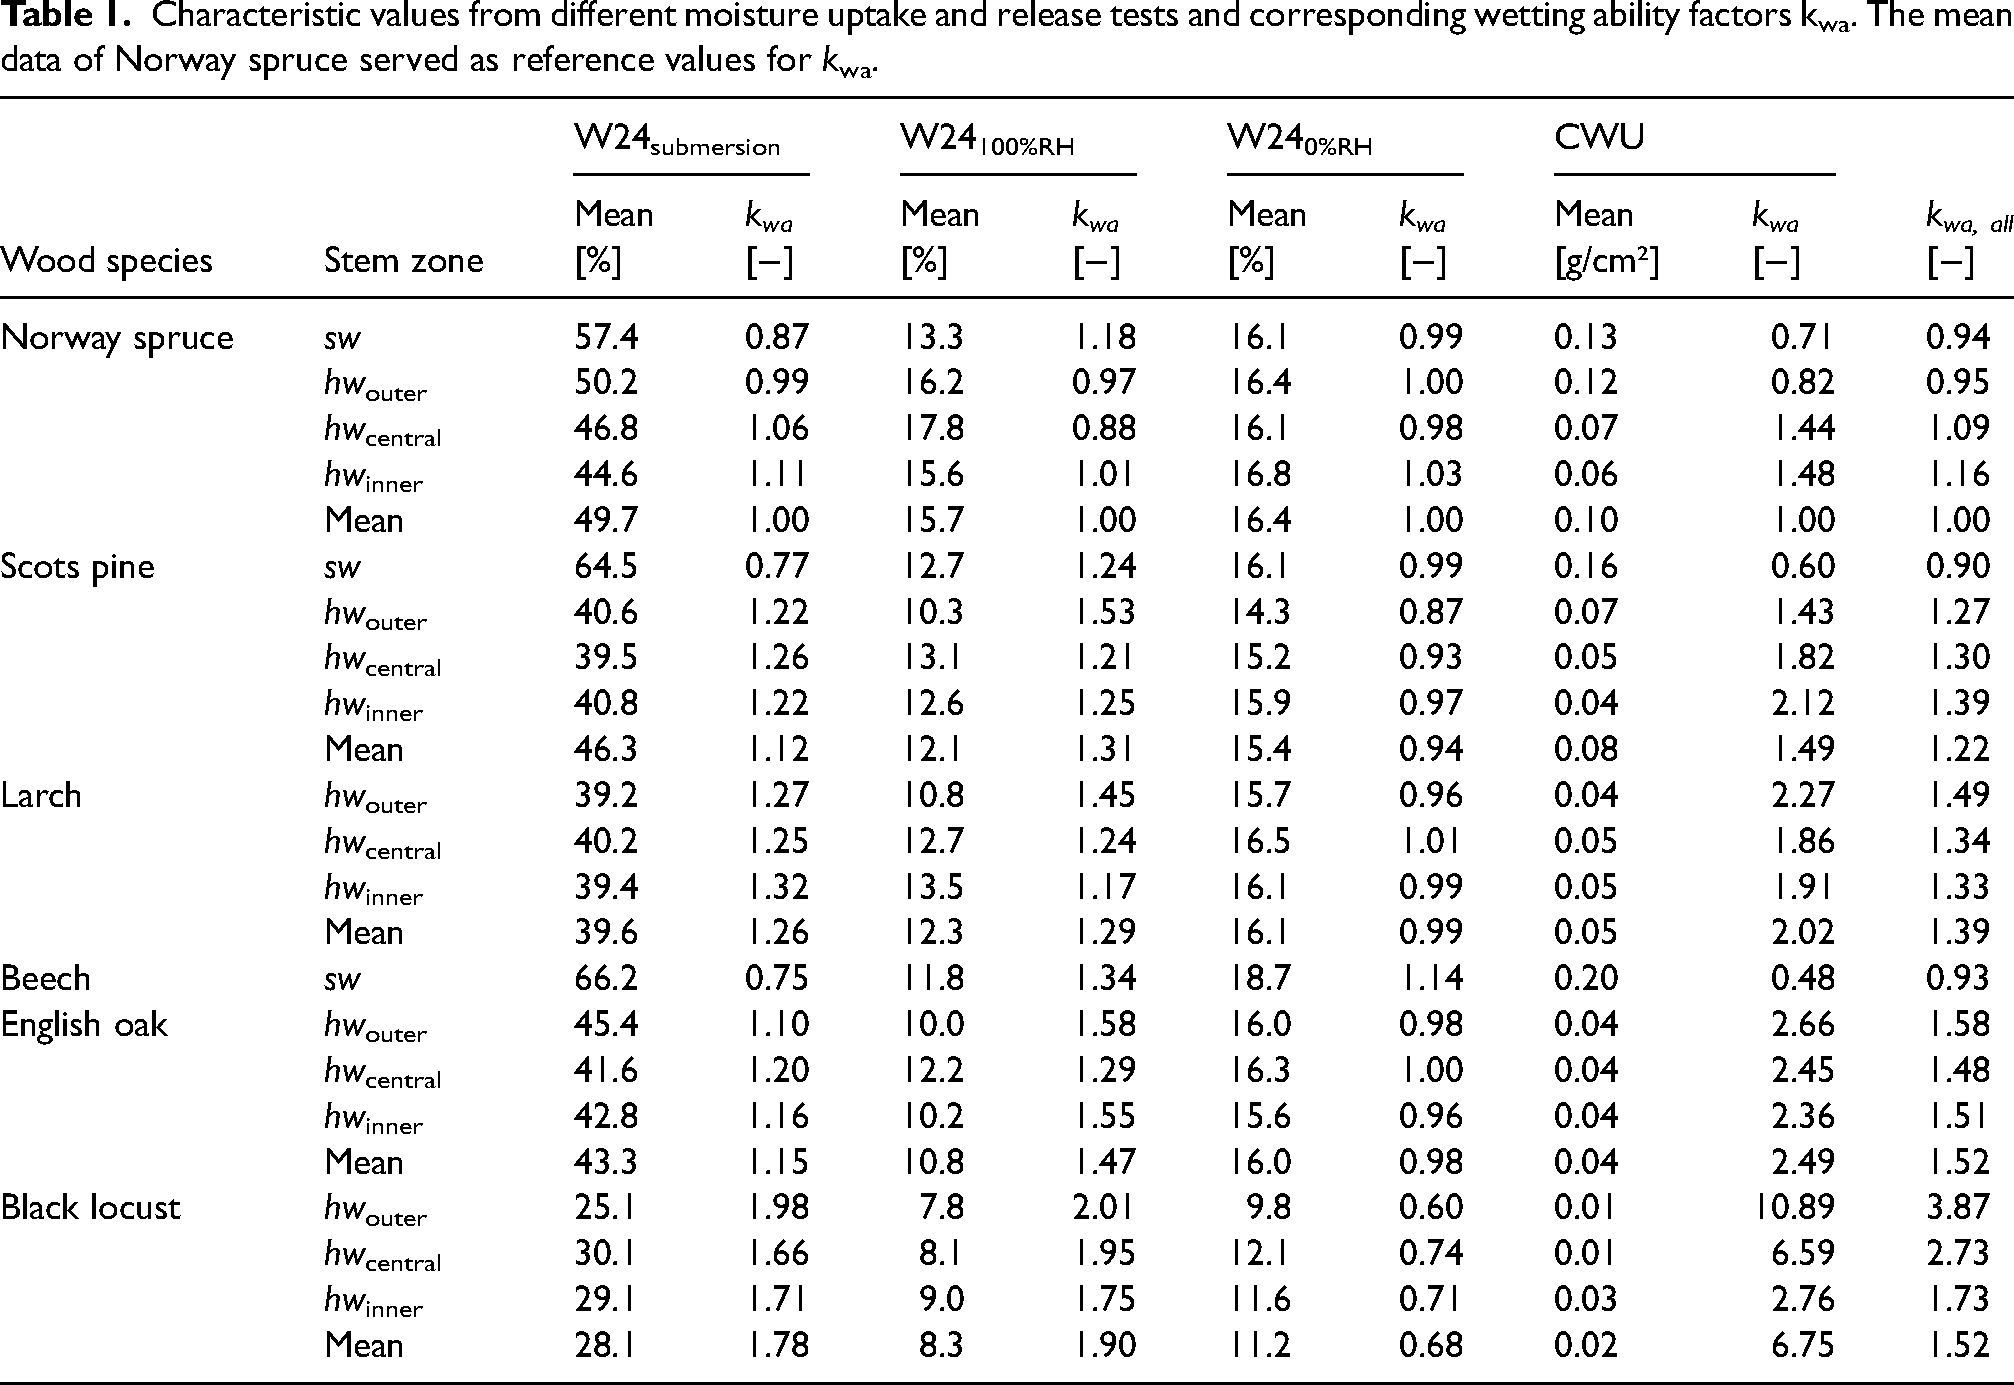
The service life of wooden components can be predicted based on dose–response relationships. As proposed by Isaksson et al.,
16
both the resistance of wood and the exposure of a wooden component can be expressed as a dose and opposed to fungal decay as a response. The resistance dose DRd is a function of the inherent resistance to decay fungi and the resistance against wetting, both expressed as factors, i.e., kinh and kwa. The wetting ability factor kwa can be determined on the basis of results from different moisture uptake and release tests using Norway spruce as a reference material. In this study, we calculated kinh for all W24 tests and the capillary water uptake measurements applied. In addition, a factor was calculated considering all tests according to equation (10):

Results and discussion
Water uptake and release
Moisture uptake in both liquid and gaseous phase as well as moisture release differed between sapwood and heartwood of both, Norway spruce and Scots pine, but partly also between heartwood zones of different wood species (Table 1, Figures 3 to 6). The most prominent difference between hwouter and the other heartwood zones was observed for the CWU of Norway spruce (Figure 6).
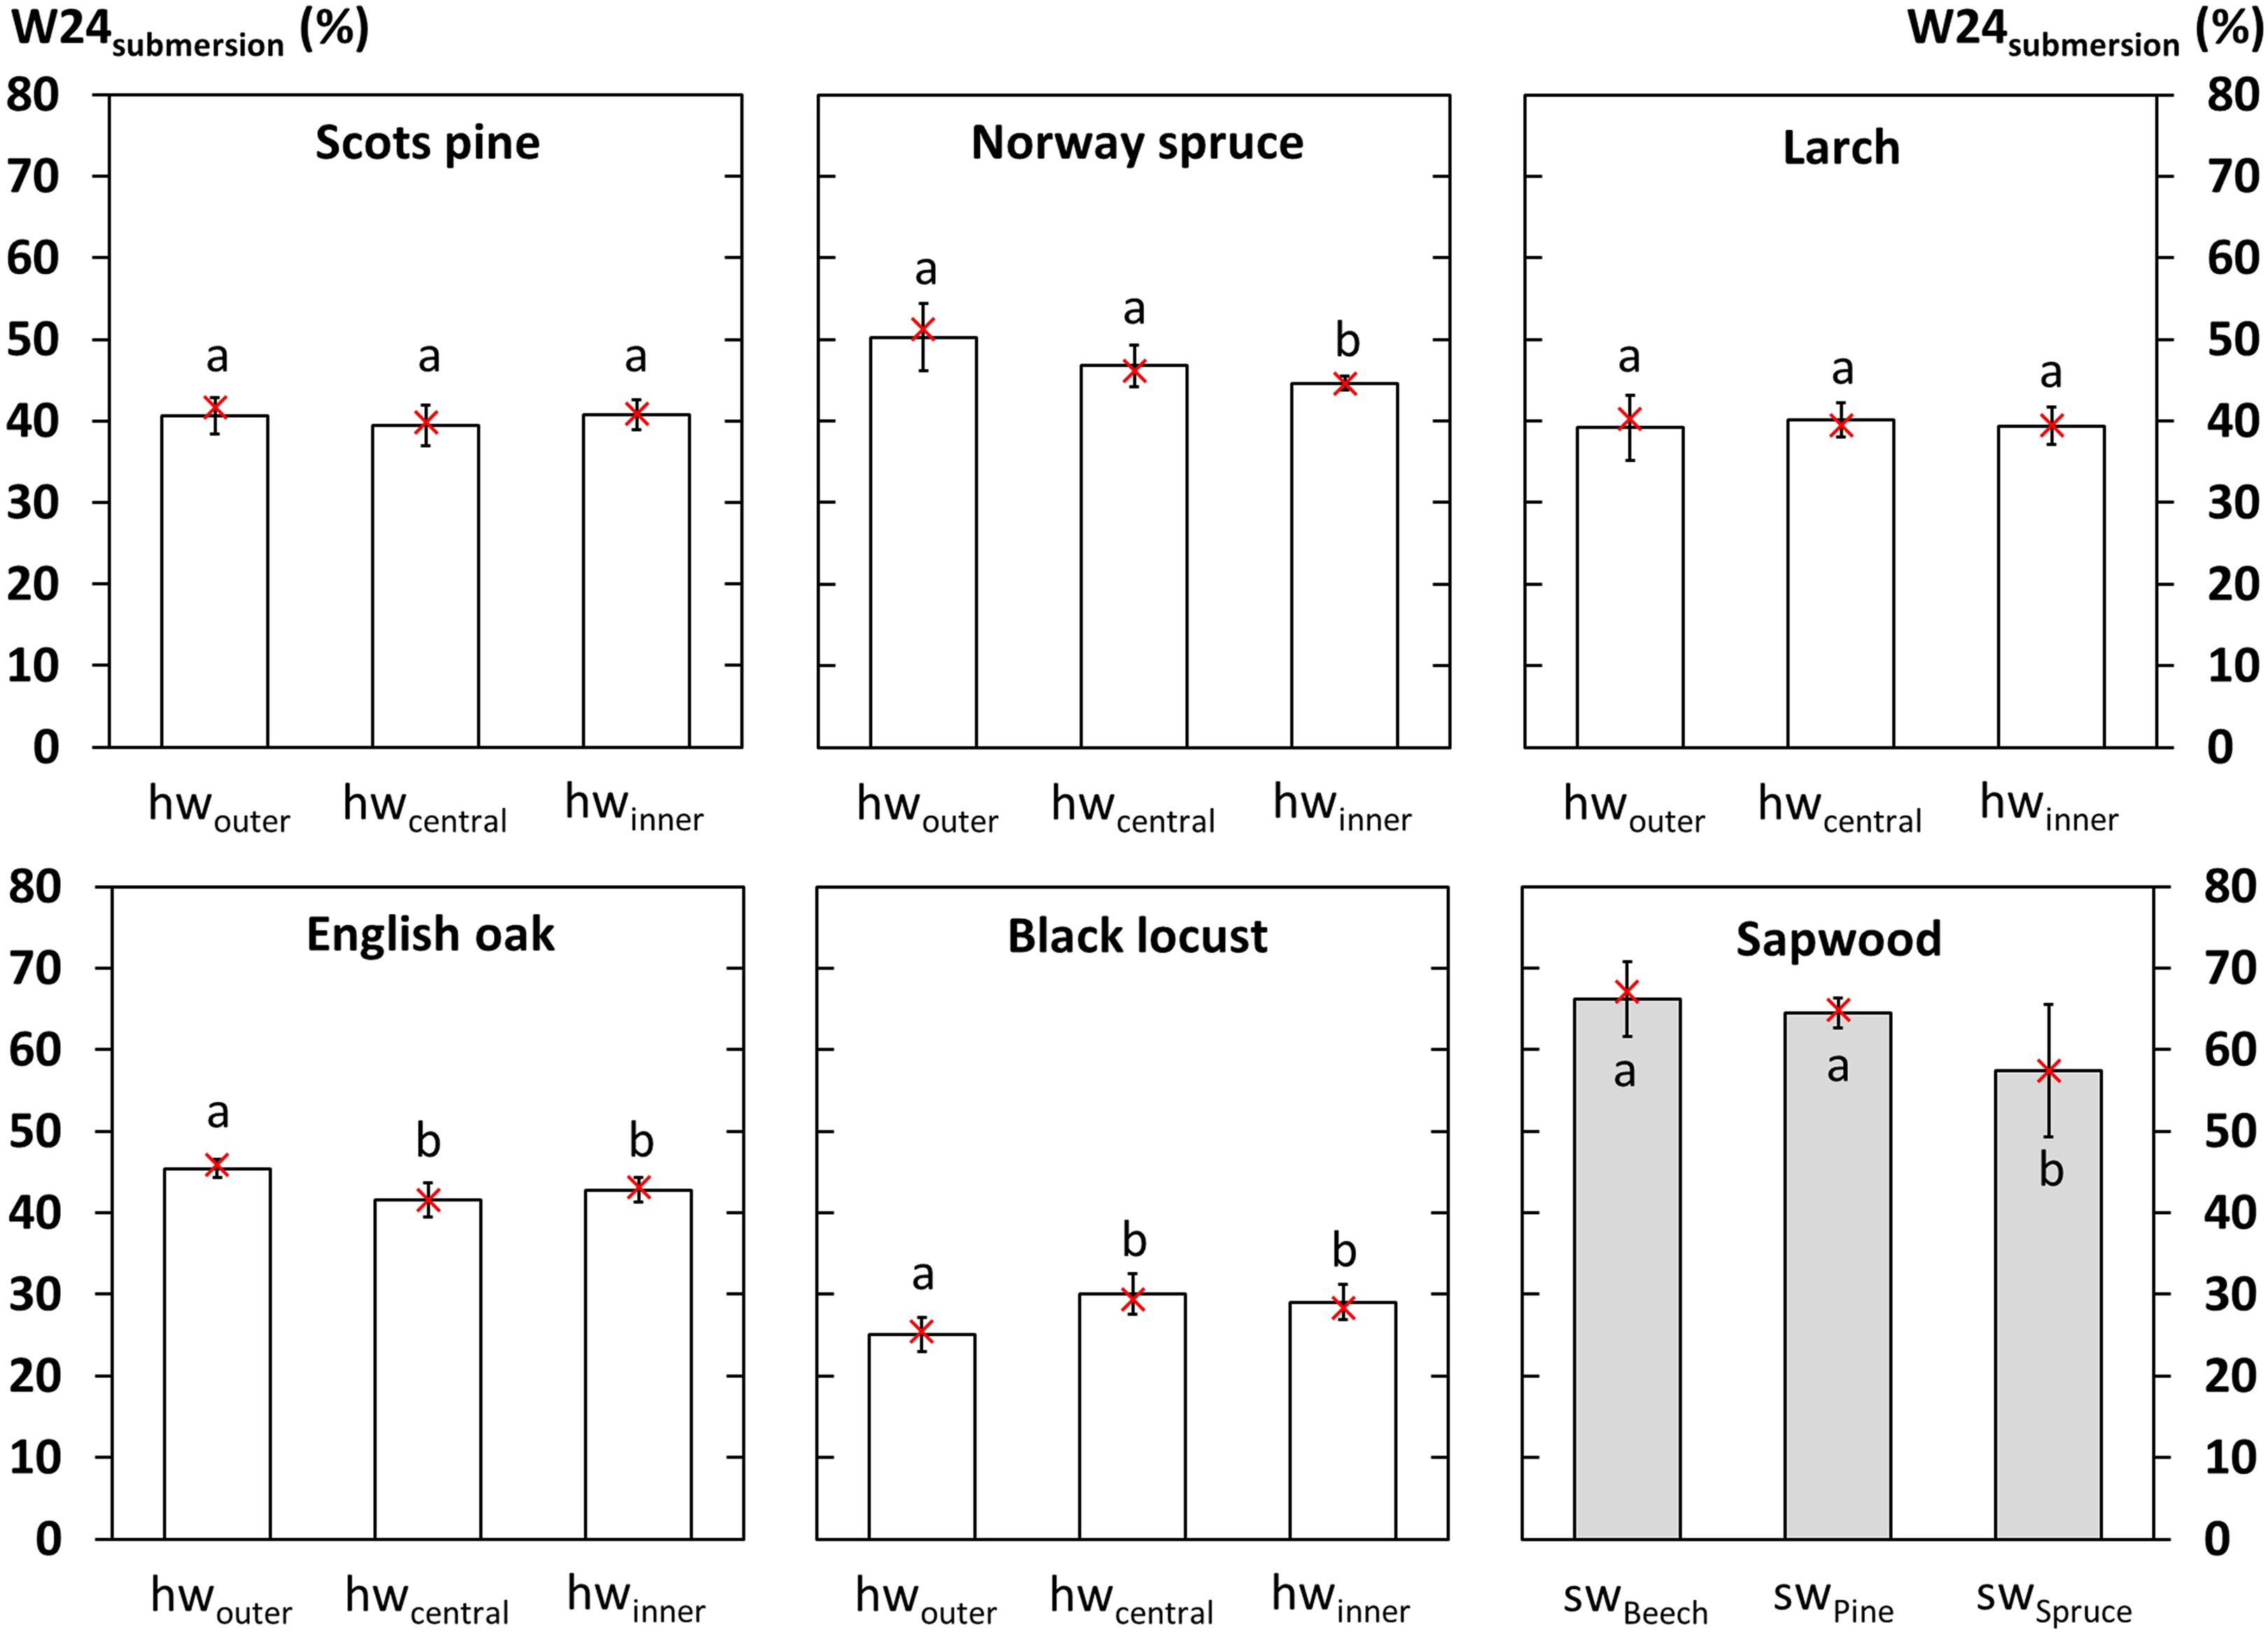
Water uptake during 24 h of submersion. Columns indicate mean values, error bars the standard deviations, and red crosses the median values. Different letters indicate differences at a significance level of P ≤ .05 in a Student's t-test.
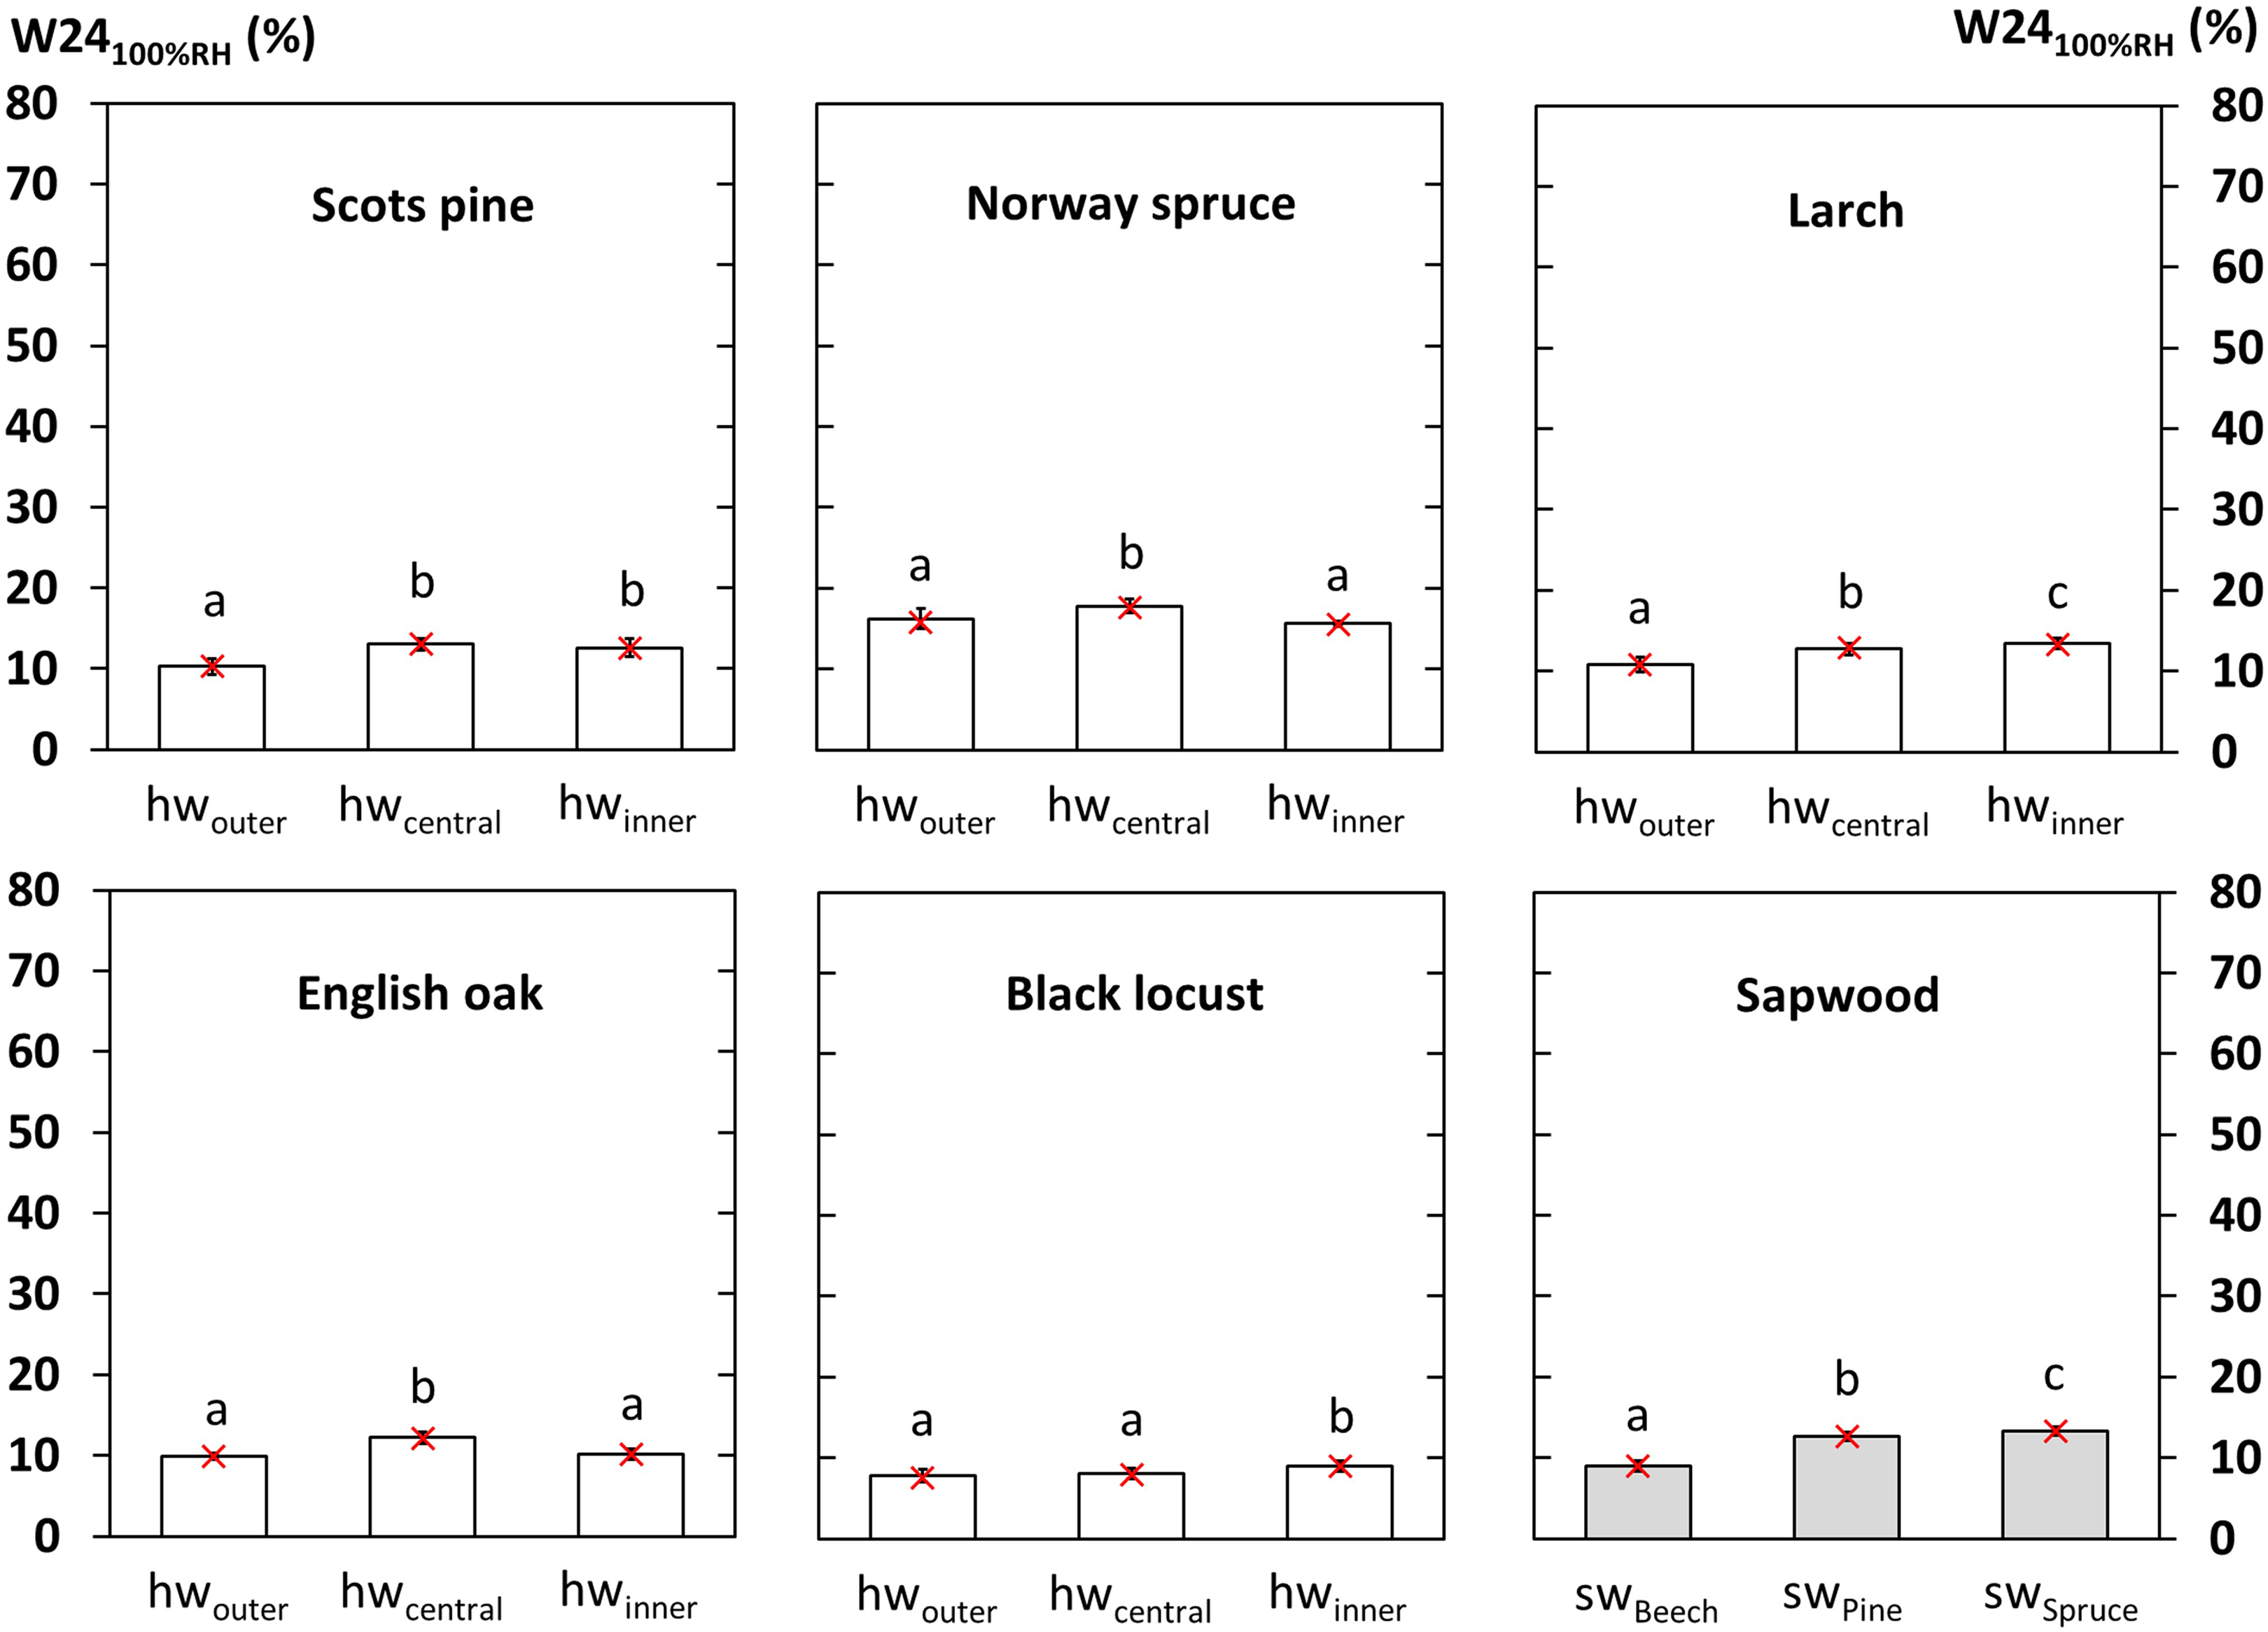
Water vapour uptake during 24 h of exposure above deionised water. Columns indicate mean values, error bars the standard deviations, and red crosses the median values. Different letters indicate differences at a significance level of P ≤ .05 in a Student's t-test.
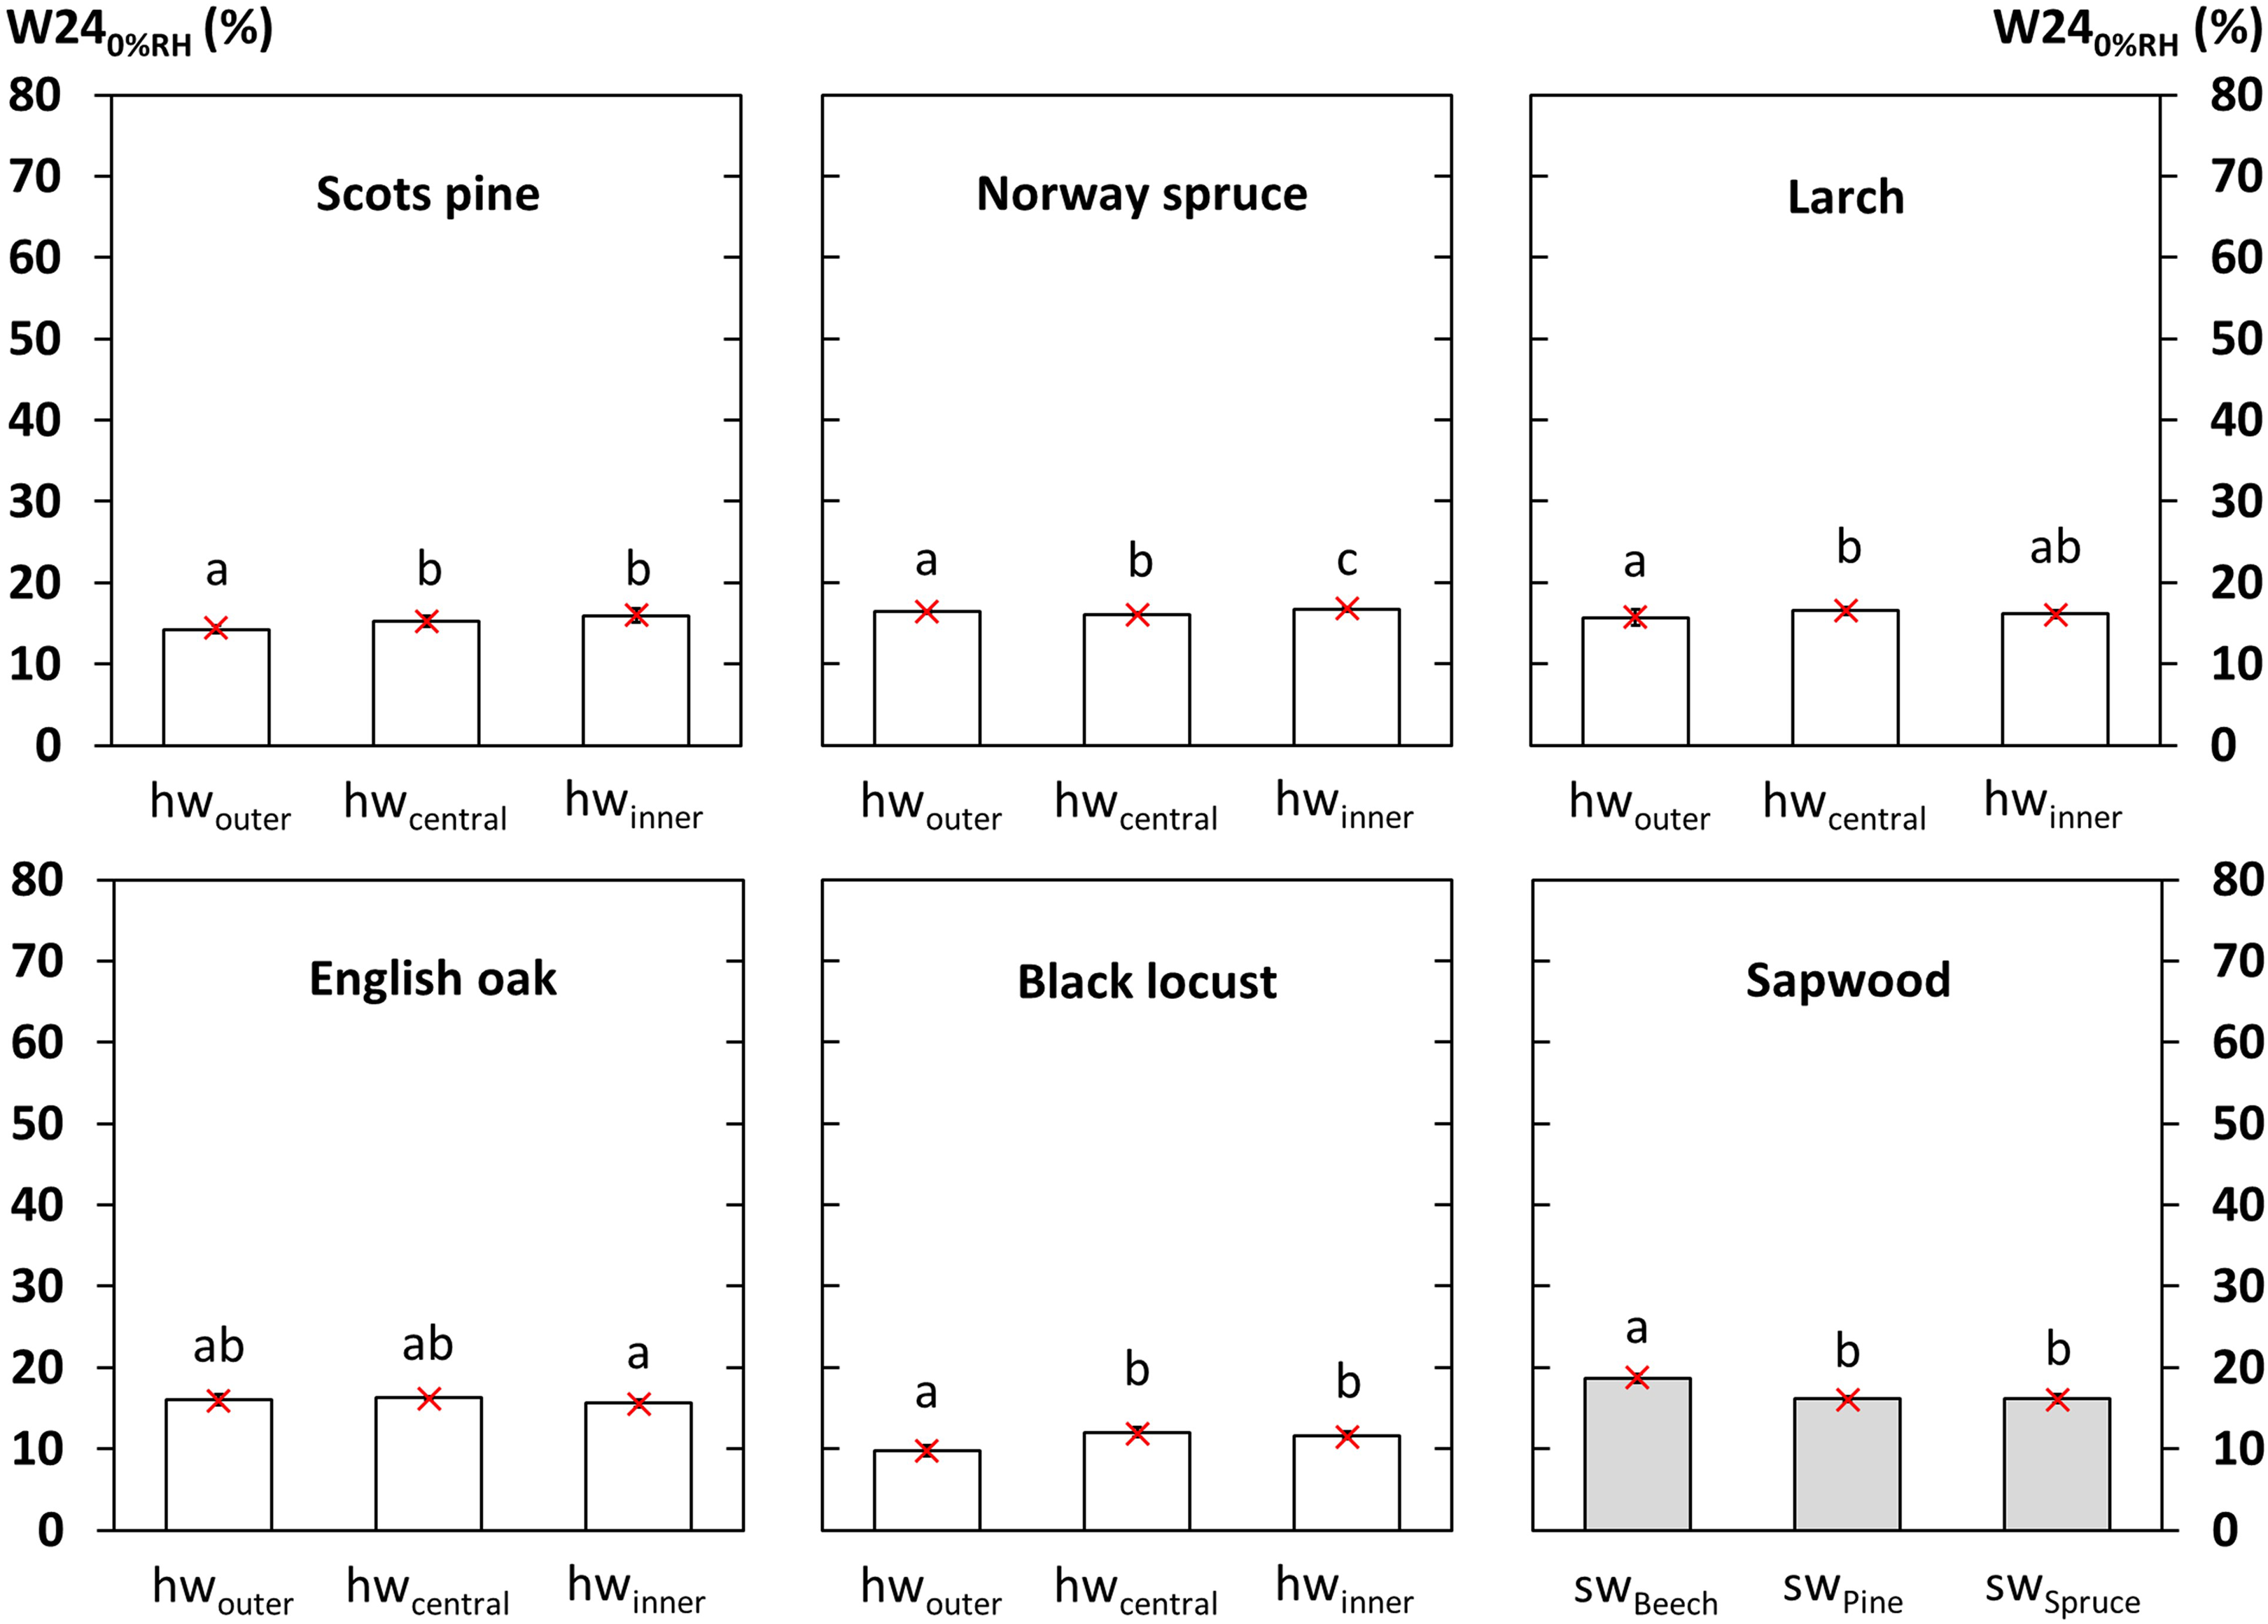
Water vapour release during 24 h of exposure at 0%RH. Columns indicate mean values, error bars the standard deviations, and red crosses the median values. Different letters indicate differences at a significance level of P ≤ .05 in a Student's t-test.
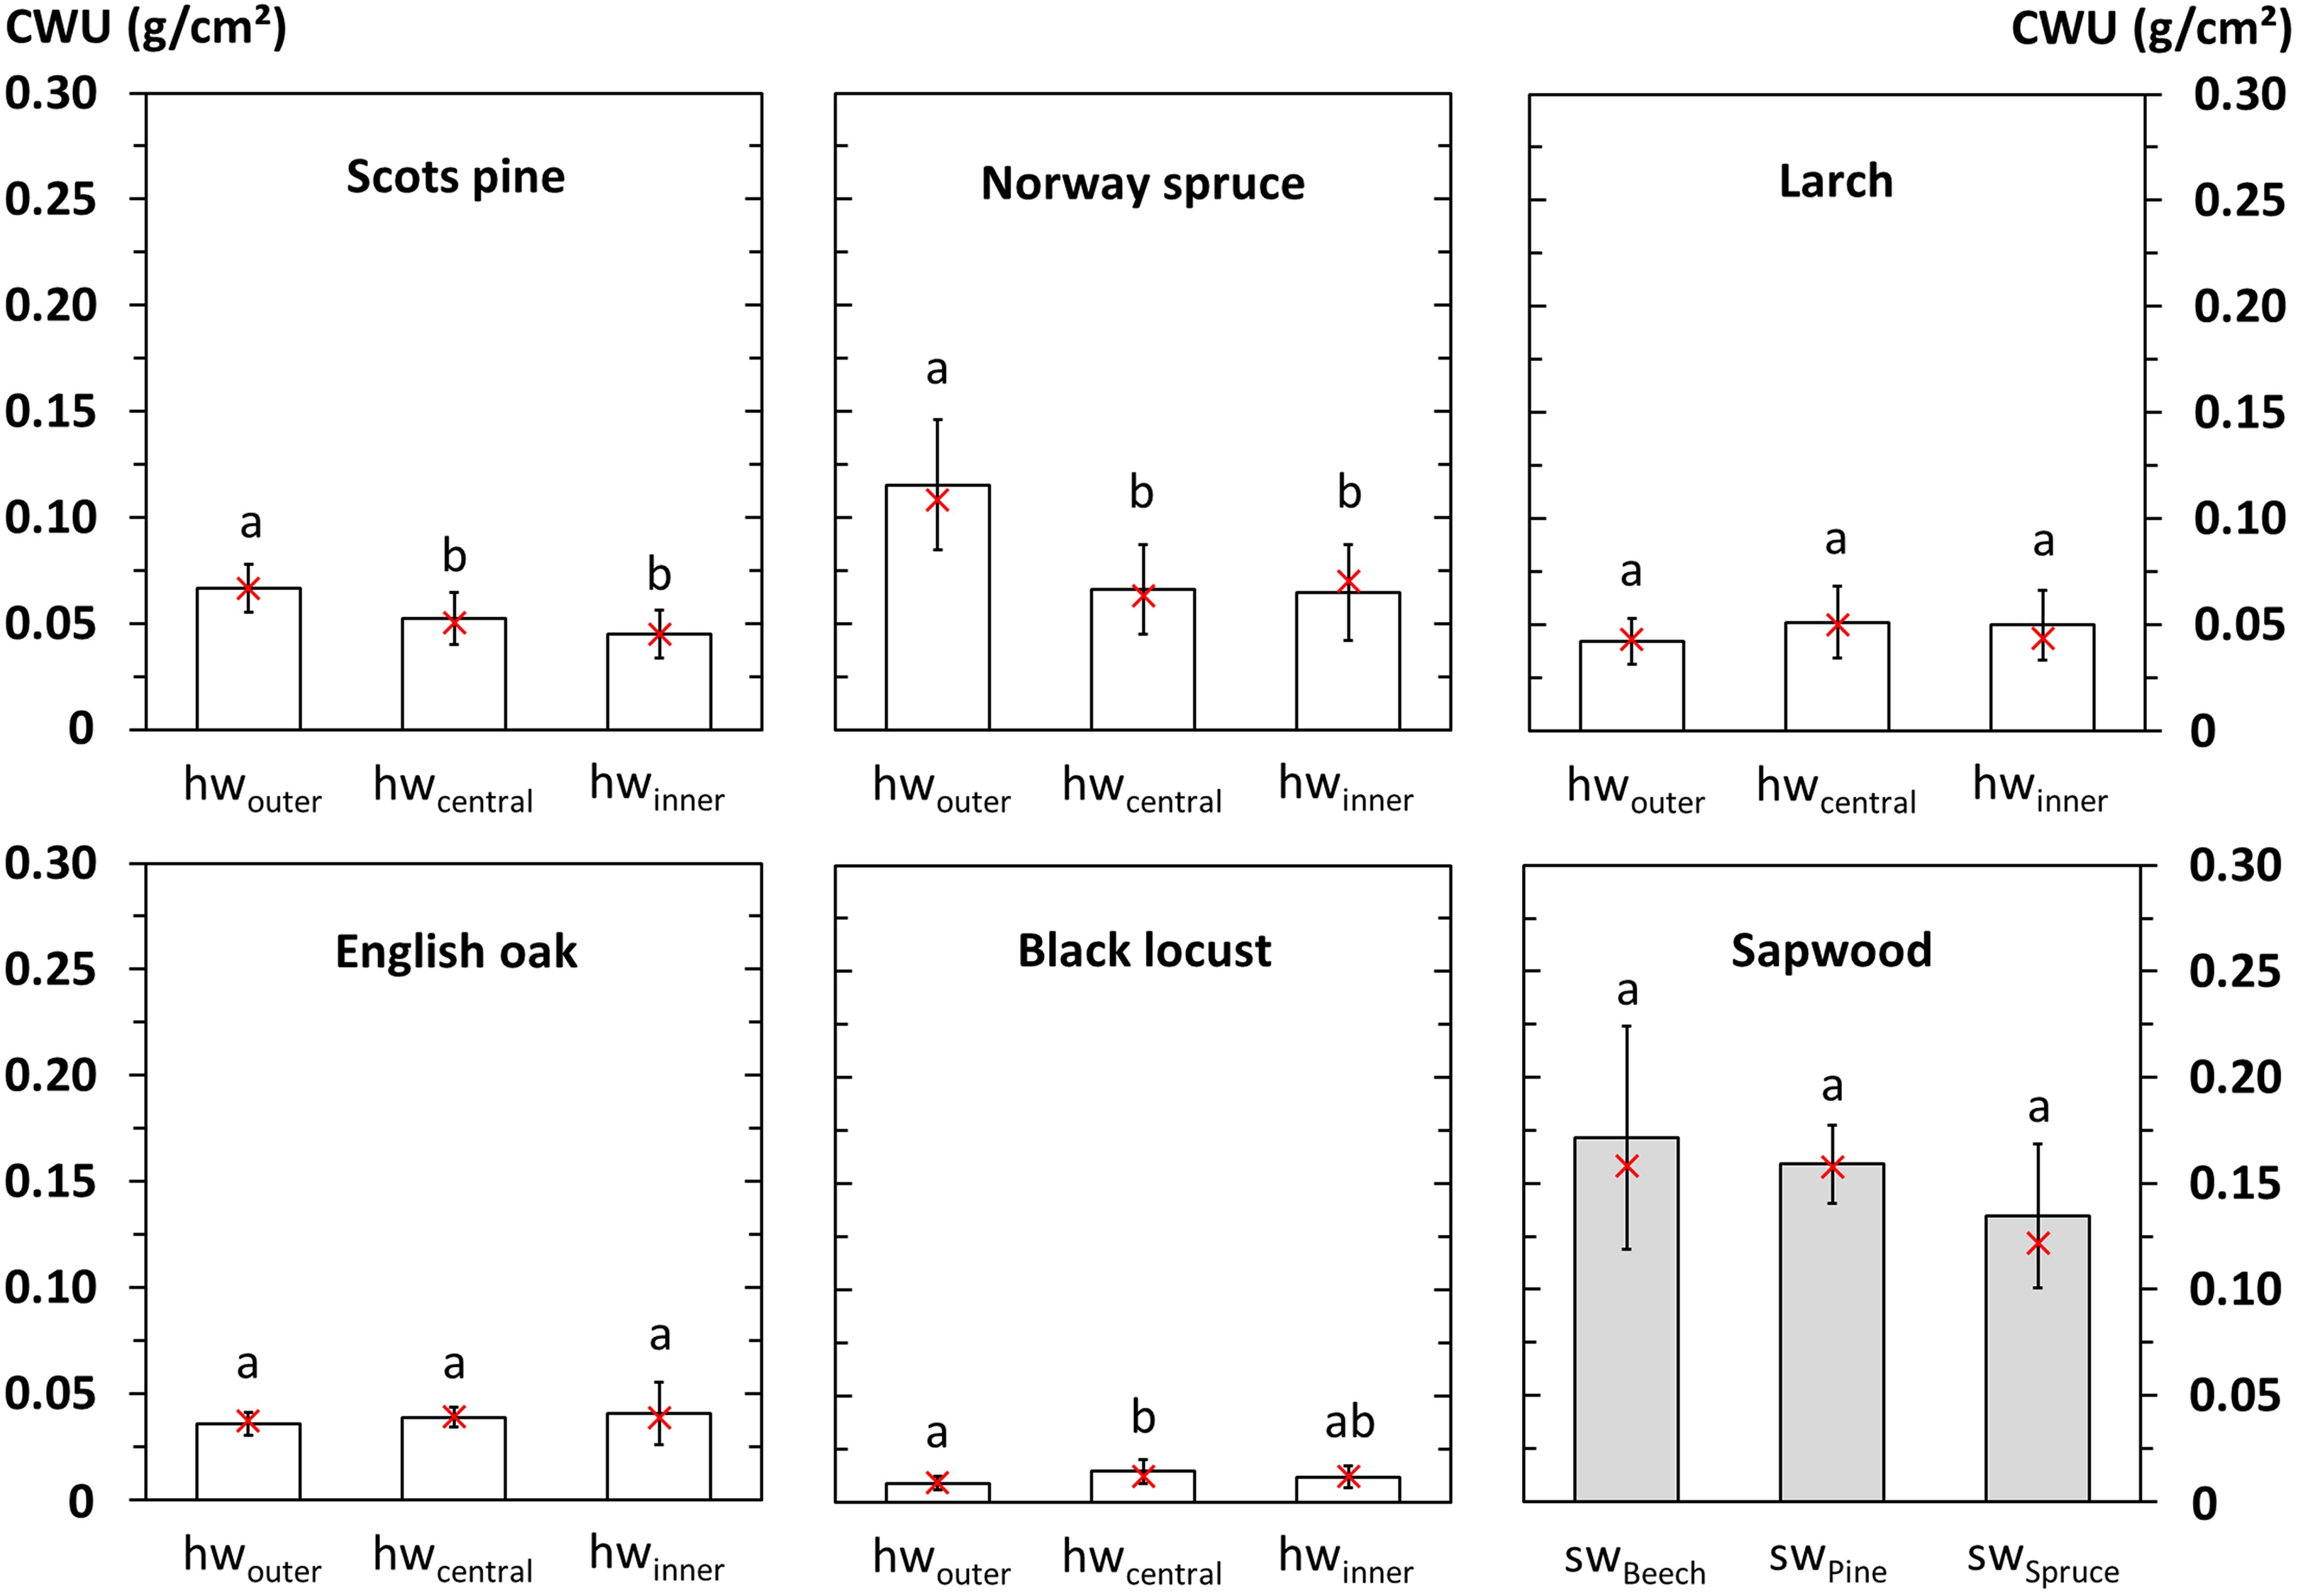
Capillary water uptake (CWU) during 200 s via the specimens' end-grain. Columns indicate mean values, error bars the standard deviations, and red crosses the median values. Different letters indicate differences at a significance level of P ≤ .05 in a Student's t-test.
Characteristic values from different moisture uptake and release tests and corresponding wetting ability factors kwa. The mean data of Norway spruce served as reference values for kwa.
For instance, the hwouter of English oak showed higher W24submersion compared to hwcentral and hwinner (Figure 3). In contrast, the hwouter of black locust was slightly lower compared to other heartwood zones. A gradient of CWU was found from hwinner to hwouter of Norway spruce and Scots pine (Figure 6); also W24submersion of Norway spruce decreased inwards (Figure 3). The lower moisture uptake in the outer heartwood zones might be due to higher contents of hydrophobic extractives such as resin acids as for instance reported for Scots pine by Bergström et al. 17 and Ekeberg et al. 18 It can be assumed that gradients of hydrophobic and/or inhibitory extractives also lead to differences in durability along the stem radius. 5
Differences in W24100%RH and W240%RH between stem zones were remarkably smaller compared to those of W24submersion; even between sapwood and heartwood of Scots pine and Norway spruce only marginal differences were observed (Figures 4 and 5).
The different moisture behaviour within a wood species means that the factors needed to consider the wetting ability (kwa) do also change. However, the differences between the stem zones within a wood species were not always aligned, so the differences were partially mitigated, but more often, the hwouter showed higher resistance against wetting, i.e., higher values for kwa were obtained.
Moisture dynamics in submersion and floating tests
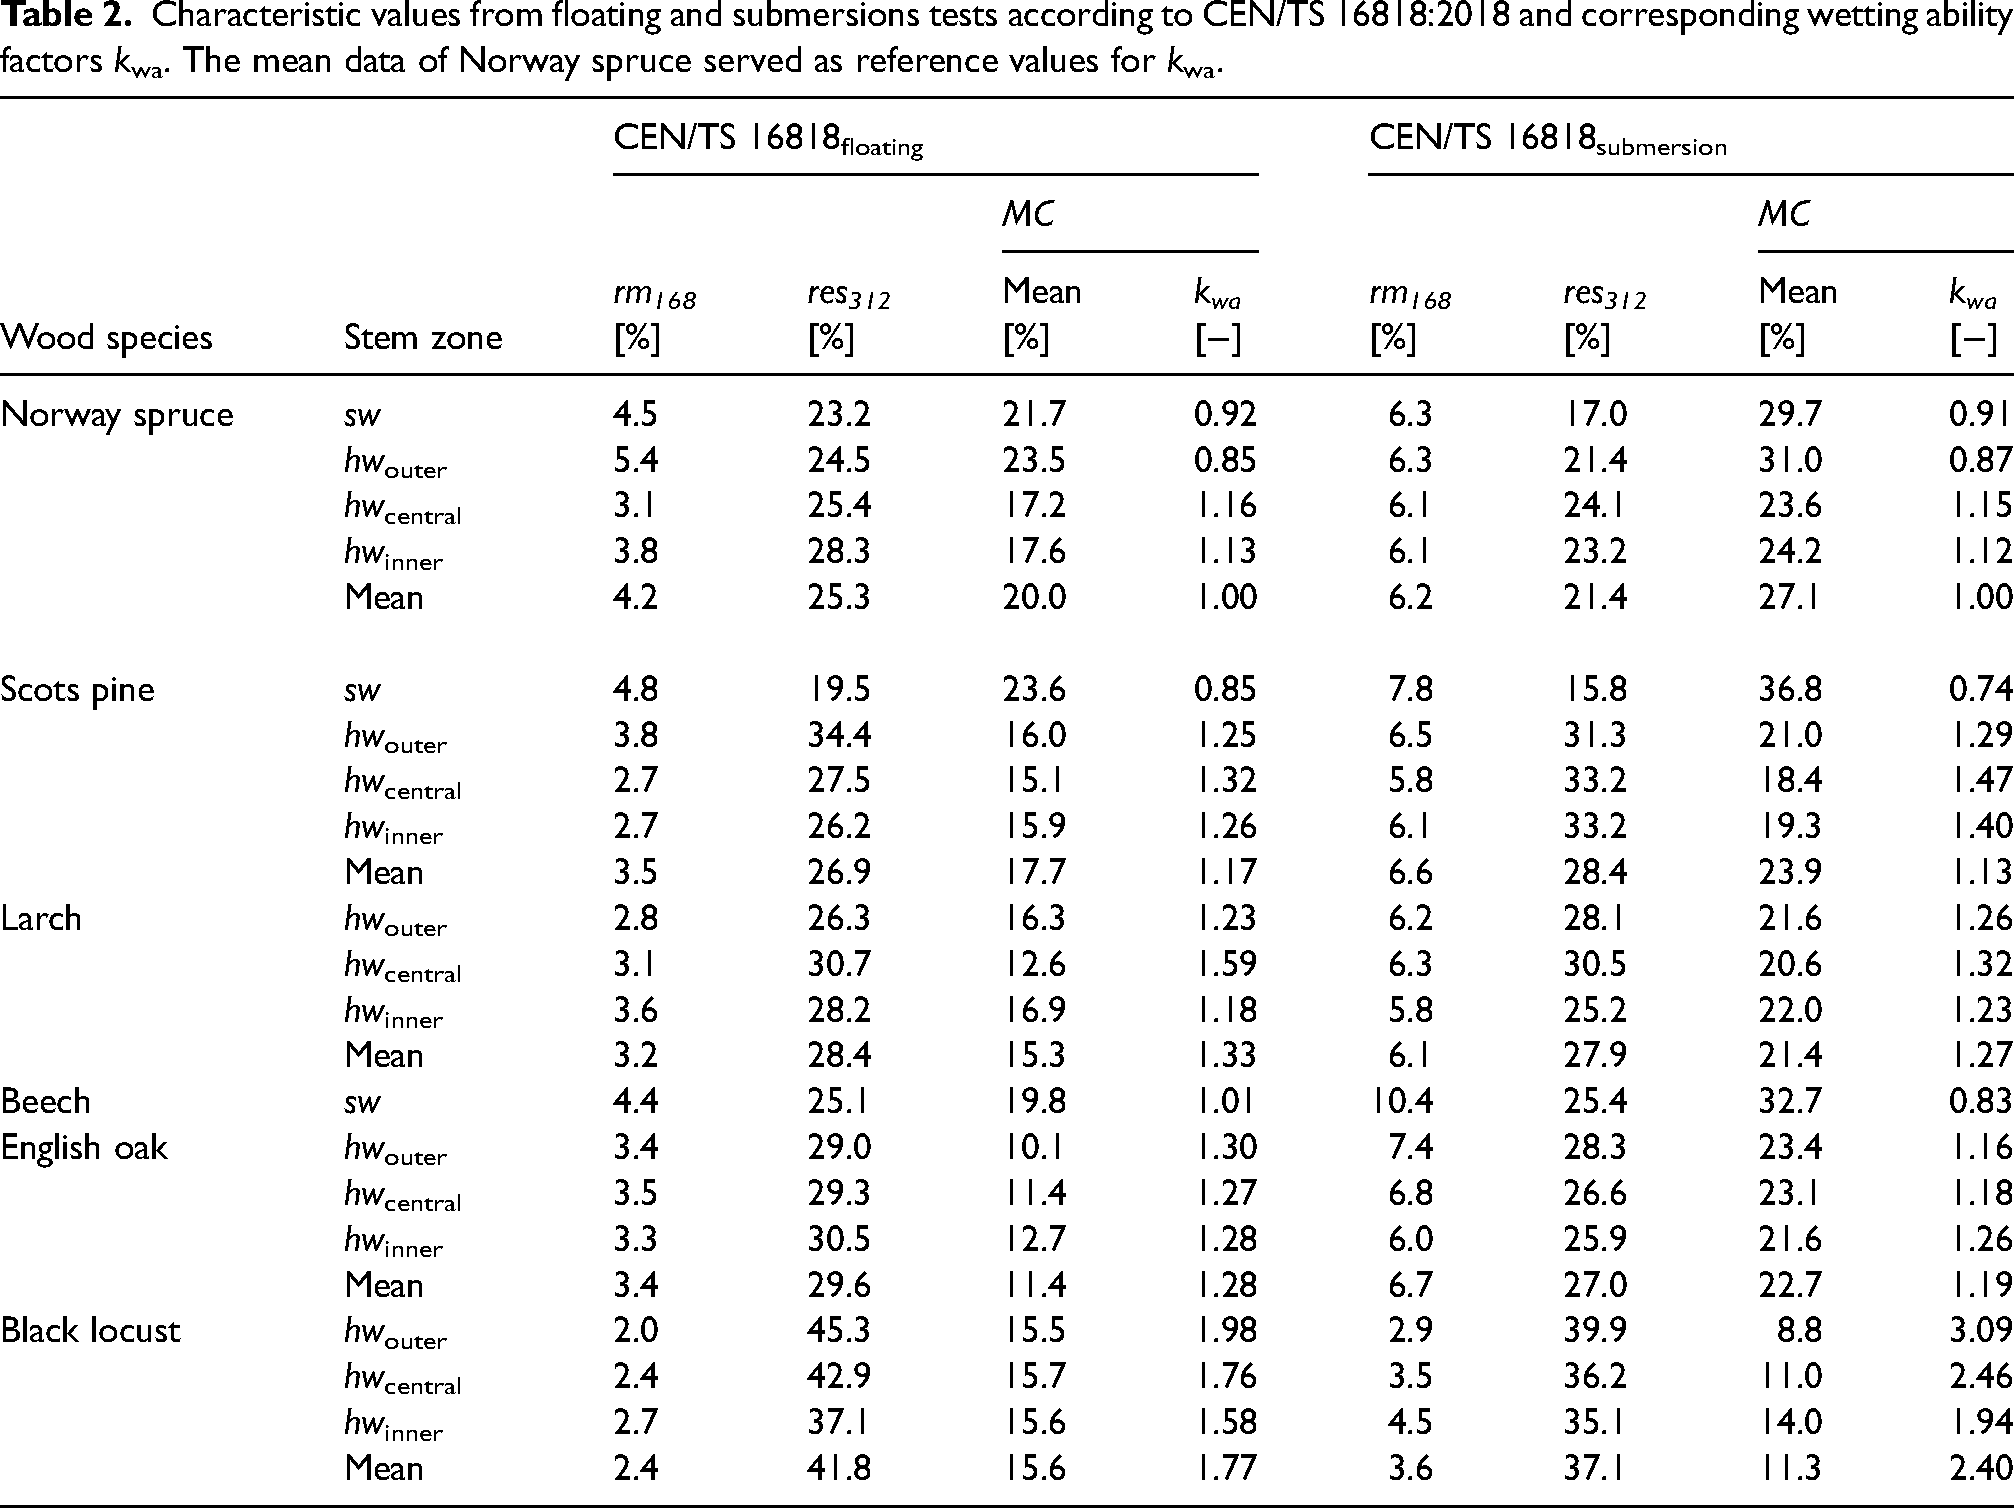
As expected and similar to the W24 and CWU measurements, the different indicators from floating and submersion tests according to CEN/TS 16818:2018 varied between wood species, sapwood and heartwood, and partly also between heartwood zones (Table 2). Sapwood of Scots pine as well as sw and hwouter of Norway spruce showed higher average MC during both tests compared to the respective adjacent heartwood zones. In contrast, the residue (res312) of sapwood from both species was lower or similar respectively, which is supposed to indicate better or similar moisture performance. This apparent contradiction also became clear in another study by Brischke et al., 19 where neither rm168 nor res312 were correlated with the average MC of wood specimens that had been exposed outdoors for several months at climatically different locations. In its current version, moisture dynamic tests according to CEN/TS 16818:2028 do not account for the capillary water uptake in the longitudinal direction, 10 because specimens for submersion tests shall have sealed end-grain surfaces. This means that the results of submersion and floating tests hardly differ in relative terms, since in both cases water uptake via end-grain is prevented. On the other hand, this type of longitudinal water absorption is crucial for wetting of wooden components during outdoor exposure. The importance of longitudinal water uptake is also pointed out by Osawa et al., 20 who conducted comparative moisture measurements in the laboratory and field with different European and Japanese wood species.
Characteristic values from floating and submersions tests according to CEN/TS 16818:2018 and corresponding wetting ability factors kwa. The mean data of Norway spruce served as reference values for kwa.
The differences in moisture uptake and release between sapwood and heartwood were expected. Their variation between the heartwood zones of the wood species under test may to some extent explain their intra-species variation, which has been reported for Norway spruce, Scots pine and Beech by Alfredsen et al. 21 One subset of their study had previously been investigated by Zimmer et al. 22 who found that besides genetic variation the treatability of Scots pine wood was affected by the immediate climate, the sociological position of the tree in the stand, growth increments and on-stand competition. In analogy to the current discussion about declaring the variability of the biological durability of wood, 15 the variability of the moisture dynamics of wood should also be given appropriate consideration. This must be taken into account both when specifying durability classes and when modelling service life. 21 The latter is particularly important when it comes to reference wood species such as Norway spruce.23,24,25,26
Conclusions
From this study on the moisture dynamics of different European-grown soft- and hardwood species, the following was concluded:
The moisture dynamics differed significantly not only between the wood species examined but also between the stem zones. For instance, Scots pine sapwood had a significantly lower kwa value than the three corresponding heartwood zones. Juvenile wood of black locust also had a lower kwa than the mature wood further out. Differences in moisture dynamics and specifically the gradients between stem zones were more pronounced for liquid water uptake, i.e., in short-term water (W24submersion) and capillary water uptake tests (CWU) as well as floating and submersion tests according to CEN/TS 16818:2018. Moisture uptake and release in the form of vapour were less affected by natural variations. Hence, different test methods shall be considered for characterising the moisture dynamics of wood in order to adequately address the respective relevant issue. Similar to the existing classification of durability against wood-destroying fungi, e.g., according to EN 350:2016, variability should be indicated when the permeability of wood to water is classified – for instance by giving a range of classes.
Footnotes
Data availability statement
The data from the presented research are available from the authors on request.
Declaration of conflicting interests
The authors declared no potential conflicts of interest with respect to the research, authorship, and/or publication of this article.
Ethical considerations
There are no human participants in this article and informed consent is not required.
Funding
This research was funded by the research project DURATEST, supported by the German Ministry of Food and Agriculture (BMEL) via the Agency of Renewable Resources (FNR), grant number 2219NR372.