
Abstract
Background:
Medication harm is a significant healthcare challenge in hospitalised adult patients. Machine learning (ML) approaches offer the potential to improve prediction accuracy for medication harm by capturing complex relationships among clinical risk factors that traditional statistical models may not detect.
Objective:
To develop and evaluate ML models for predicting medication harm in hospitalised adult patients.
Design:
ML study involving secondary use of a prospectively collected hospital cohort dataset.
Methods:
This study used data from 279 adult patients admitted to general medical and geriatric wards of a tertiary hospital, among whom 40 experienced 51 medication harm events. Eight ML models were trained and evaluated for identifying patients at risk of medication harm. Medication harm cases were identified through detailed chart reviews, trigger tools, voluntary incident reporting, and International Classification of Diseases version 10 discharge coding. Data were pre-processed with missing values imputed using median imputation. Ten predictive features were selected using recursive feature elimination and clinical expert opinion. Models were trained using stratified 10-fold cross-validation with an 80/20 train-test split. Class imbalance was addressed using an oversampling approach.
Results:
A random forest model demonstrated the highest performance, achieving an area under the receiver operating characteristic curve of 0.76, precision of 0.50, recall of 0.62, F1 score of 0.54, accuracy of 0.86, specificity of 0.90, and an area under the precision-recall curve of 0.47. Predictive features of importance included length of stay, depression, dementia, insulin use, number of medications (⩾15), age (⩾65), opioid use, and antibiotic use.
Conclusion:
This study highlights the potential of ML models to predict medication harm, enabling early identification of high-risk patients for preventive interventions. Interdisciplinary collaboration is essential in developing robust, clinically relevant models that can be used to improve patient safety.
Plain language summary
Introduction
Medication harm is a significant healthcare challenge that manifests in potentially avoidable morbidity and mortality.1–3 Preventing harm from inappropriate medication use achieves better patient outcomes and saves limited healthcare resources.4,5 About one in five inpatients experience medication harm, with a third of these cases deemed preventable. 6 Examples include adverse effects from antidiabetic drugs, anticoagulants, and antihypertensives, which can be mitigated through comprehensive medication review and patient monitoring. 7 However, heavy workloads and time pressures in busy hospitals often limit the effectiveness of these strategies.8–10
Automated risk prediction methods may allow clinicians to systematically identify patients at high risk of medication harm and implement targeted preventive strategies.11,12 Several prior studies have explored risk prediction models for medication harm using traditional regression models or machine learning (ML) methods. For example, the Adverse Drug Reactions and Events in an Ageing PopulaTion Risk Prediction (ADAPTiP) regression tool, using retrospective data, demonstrated the feasibility of prediction models for medication harm applied to the older adult (⩾65 years) population. 13 Another study applied ML methods to a large retrospective tertiary hospital patient dataset across all ages in which medication harm affected only 5.2% of patients, resulting in model imbalance. 14 The five models performed well at identifying patients not at risk (high negative predictive value, ~97.5%) but had low precision (positive predictive value (PPV), ~10%) for medication harm, highlighting challenges in accurately predicting risk of rare outcomes. 14
Although ML-based prediction models have demonstrated superior performance over conventional statistical methods, such as logistic regression in various in silico clinical applications,15–18 models of either type may not perform well in real-world settings and exert clinical impact. 19 Nevertheless, ML models can capture complex, non-linear relationships and interactions among patient characteristics, medication use patterns, laboratory test results, and history of adverse drug reactions,20,21 and may better predict medication harm and support targeted interventions.
The Adverse Inpatient Medication Event and Frailty (AIME-Frail) was a logistic regression model developed using retrospectively extracted data from electronic health records (EHRs) of hospitalised adult patients with completed episodes of care, in which medication harm was ascertained using International Classification of Diseases (ICD) codes. 22 While this model demonstrated good predictive accuracy (i.e., area under the receiver operating characteristic curve [AUROC]) of 0.79, it was limited by low precision (i.e., PPV) of 0.14 due to the relative infrequency of ICD-coded medication harm within the derivation dataset. We hypothesised that applying ML to a prospectively collected dataset from 279 patients, with more comprehensive measures of harm, could yield better results. Hence, this study aimed to develop and evaluate different ML models to predict medication harm in hospitalised adults, while attempting to address challenges of class imbalance experienced in prior studies.
Methods
Study design
Model development and evaluation were conducted between 13 October 2024 and 25 June 2025. The study followed Steyerberg et al.’s seven-step framework to guide predictive model development: (1) defining the research question and performing an initial data inspection, (2) coding and preparing predictors, (3) specifying the model structure, (4) estimating model parameters, (5) evaluating model performance, (6) conducting internal validation, and (7) presenting the model and its results. 23 Additionally, the reporting of this study conforms to the TRIPOD-AI guidelines. 24
Data collection and preparation
This study used a prospective dataset from a controlled trial evaluating the clinical impact of the AIME-Frail model, which has been reported separately. 25 In that study, participants were included if they were newly admitted to one of four geriatric wards or two general medical teams at Princess Alexandra Hospital, were receiving active inpatient care during the study period, and had provided informed consent either personally or through a substitute decision-maker. Patients were excluded if they had been admitted to the same study wards or teams prior to study commencement, received end-of-life care, were discharged before consent could be obtained, or declined participation.
The extracted data comprised patient demographics, clinical history, lifestyle factors, and hospitalisation data, collected prospectively from EHRs on admission to general medicine or geriatric rehabilitation wards between 2 May 2022 and 3 July 2023. Features of importance identified in the original AIME-Frail model included high-risk medications, categorised according to the APINCH acronym, 26 length of hospitalisation and frailty, the latter assessed using the hospital frailty risk score 27 was calculated retrospectively. In this prospective study, the Clinical Frailty Scale (CFS) 28 , ranging from 1 = very fit to 9 = terminally ill, was used as the method of choice as per local hospital policy. The only variable with missing data was serum creatinine (missing for 2.2% of the cohort). Median imputation was applied, assuming the missing values were missing at random, given the low rate of missingness and the right-skewed distribution.
The primary outcome measure of medication harm was defined as any negative patient outcome or injury related to medication use. 29 To ensure comprehensive identification of all possible harm cases, multiple data sources were used, comprising regular chart review by researchers throughout the admission, a modified trigger tool that identified diagnoses such as falls as indicators of potential harm events and associated suspected drug(s), 30 voluntary reporting of harm by clinical staff, and discharge coding (ICD-10) specific to medication harm. 31 This approach reduced the risk of bias or missed cases that might arise from relying on a single data source. We only included cases of harm rated by the researchers as certain, likely, or possible to be caused by medications and not attributable to other factors, according to the World Health Organization-Uppsala Monitoring Centre (WHO-UMC) causality categories. 32 Additionally, an expert panel which included a geriatrician and two pharmacists (one from the general medical team and one from the geriatric team) independently verified the accuracy of the causality categorisation process for each case of medication-attributable harm based on a majority vote.
Sample size considerations
The study was constrained by the availability of data from 279 patients, of whom 40 experienced the outcome of interest (event rate = 14.3%). A minimum of 189 patients was calculated as necessary to estimate the outcome prevalence with a ±5% margin of error and 95% confidence. 33 Although the events-per-variable (EPV = 4) was lower than commonly recommended thresholds (EPV = 10–20), the total sample size exceeded the minimum required to estimate outcome prevalence. As a post hoc diagnostic check of model fit on the pooled development and test dataset, likelihood-based pseudo-R² measures were derived: Cox-Snell R² = 0.3592, maximum Cox-Snell R² = 0.5605, and Nagelkerke R² = 0.6409. These values suggest reasonable apparent model fit. However, they do not mitigate the limitations imposed by the small number of events and low EPV.
Exploratory data analysis
Following data processing, a total of 42 features were chosen for model input; their frequency distributions are depicted in Supplemental Appendix A. Three features, in addition to being analysed as continuous variables, were also analysed as binarised categorical variables: age, medication count, and frailty scores, categorised according to clinically relevant threshold values. For age, participants were grouped into <65 years (30.5%) and ⩾65 years (69.5%) according to the accepted definition of older patients. 34 Medication use was divided into <15 medications (70.3%) and ⩾15 medications (29.7%), the latter defining excessive polypharmacy. 35 Frailty scores were grouped into <5 points (34.1%) and ⩾5 points (65.9%) on the CFS, where scores <5 represent fit or pre-frailty status. 28 All other categorical features comprised patients who did or did not have the medical condition in question or did or did not receive the stated medication.
Supplemental Appendix B depicts a feature-to-feature correlation heatmap used to assess multicollinearity in the feature correlation matrix. Despite weak, non-significant correlations and potential collinearity, “AC” and “VTEPPX” were retained as potential model features due to their deemed clinical importance. Specifically, “AC” captures the broader use of anticoagulants, including both oral and intravenous forms, while “VTEPPX” specifically relates to anticoagulants used at prophylactic doses. Since medication harm could manifest differently from prophylactic versus broader anticoagulant use, both features provide complementary information. The statistical associations between features and medication harm are detailed in Supplemental Appendix C. As these were exploratory analyses focused on providing insight into the relationships between features and medication harm, they were not used to guide feature selection.
Feature analysis and selection
Correlation analysis was conducted to identify feature relationships with medication harm, using Pearson correlation (r) for continuous features and Cramér’s V for categorical features, with chi-square tests used to determine statistical significance as denoted by p values < 0.05. Recursive feature elimination (RFE) was performed to generate a shortlist of features based on model contribution. The shortlisted features were then reviewed through an iterative consensus process involving two data scientists (AA, HM) with experience in digital health data, and two clinical pharmacists (NF, JL) with expertise in medication safety. Final feature selection was guided by this multidisciplinary agreement, prioritising clinical relevance and feature availability within routinely collected digital hospital data, instead of relying solely on statistical correlations.
Feature discretisation
Feature discretisation was conducted iteratively to ensure the chosen features were correctly interpreted by the model during training and to optimise performance. RFE was used as an advisory step to rank candidate predictors and initially identified age, number of medications, CFS, length of stay, and creatinine. Although frailty measured as CFS was identified by RFE as a predictor, we excluded it to enhance generalisability across diverse hospital settings given that CFS is not routinely captured in EHRs and typically requires individual clinical assessment. Features identified as clinically important in the original AIME-Frail model, 22 including length of stay, antibiotics, insulin and opioids, were retained based on clinical relevance rather than statistical associations alone. The final set of 10 features used in the ML models comprised those four features along with dementia, depression, antiplatelets, number of medications ⩾15, age ⩾65 and creatinine. These were selected based on both the RFE shortlist and multidisciplinary expert agreement regarding clinical relevance and practicality.
Model development
Eight models were developed using scikit-learn 36 : random forest, 37 Light Gradient Boosting Machine (LightGBM), 38 Extreme Gradient Boosting (XGBoost), 39 logistic regression, 40 Categorical Boosting (CatBoost), 41 gradient boosting classifier, 42 multi-layer perceptron (MLP), 43 and Support Vector Machine (SVM). 44 Based on prior studies,45–47 these models were chosen for their general ability to handle high-dimensional feature spaces and their flexibility in capturing both linear and non-linear relationships, which are important for modelling complex clinical outcomes such as medication harm.
Preprocessing steps to prepare data for model training included label encoding (converting categorical variables into numerical form), scaling (adjusting data so that features with larger values did not disproportionately influence the model), and one-hot encoding (creating separate columns for each category to enable easier processing). 48
The original dataset comprised 279 actual patient cases, including 51 medication harm events arising from 40 patients who experienced one or more events. All modelling was conducted at the patient level, with any patient experiencing ⩾1 harm event classified as a harm case. The dataset was split into training and testing sets using an 80/20 ratio, resulting in 223 training patient cases with 32 medication harm events and 56 testing patient cases with 8 medication harm events. To address class imbalance due to the low prevalence of medication harm, adaptive synthetic sampling (ADASYN) was applied, 49 which generated an additional 164 patient cases with harm, increasing the total number of harm events in the training set to 196.
Eight ML models were trained on the training dataset (80% of total cohort), which, after adding the ADASYN oversampling data, comprised a total of 387 patient cases: 191 actual patients without medication harm (unchanged) and 196 with harm (32 original cases; 164 ADASYN cases). The features of the ADASYN-generated minority samples approximate the feature distributions seen in the actual harm cases, supporting model training while leaving the original dataset unchanged. 49
Model training was conducted using stratified 10-fold cross-validation to ensure similar class distribution across folds. Hyperparameter tuning was nested within the cross-validation procedure using GridSearchCV,50,51 with the optimal hyperparameters selected based on the highest mean AUROC across folds.
Model evaluation
The performance of each model was evaluated on the 20% hold-out test dataset. The model performance metrics comprised AUROC, area under the precision-recall curve (AUPRC), precision (PPV), recall (also termed sensitivity), F1 score (harmonised mean of precision and recall), accuracy (proportion of correct predictions among all predictions), and specificity. A random seed of 42 was set for reproducibility. The ADASYN oversampling method used to address class imbalance was applied exclusively to the training dataset and withheld from the test dataset. 52
Optimal classification thresholds for predicting medication harm were determined using the Youden index, which balanced true positive and false positive rates.53,54 95% confidence intervals (CI) around the metric estimates were derived using bootstrapping on the testing dataset (n = 56) with 1,000 samples. A confusion matrix comparing actual versus predicted cases of harm and non-harm was also constructed. Decision curve analysis was employed to evaluate the net clinical benefit of the model across a range of threshold probabilities.
Model explainability
In making model outputs more explainable to clinicians, SHapley Additive exPlanations (SHAP) summary plots were constructed to identify important features contributing to risk predictions. 55
Statistical analysis
In addition to the correlation and feature selection procedures described above, univariate analyses were also conducted to quantify the individual associations between predictors and the outcome, including correlation coefficients, R² values and tests of statistical significance. Further statistical analyses were conducted to assess model adequacy, performance, and clinical utility. Model adequacy was evaluated through post hoc logistic regression to determine dataset sufficiency for multivariable modelling, and by examining model stability across multiple resampled training and test datasets via bootstrapping at sample fractions of 0.5, 0.75, and 1.0. Model performance was assessed internally using stratified 10-fold cross-validation during model development, while the final model performance and clinical utility were evaluated on the 20% hold-out test dataset using standard performance metrics and decision curve analysis.
The ML framework was implemented in Python 3.10.0 using Jupyter Notebook.56,57 Statistical analyses were performed using the libraries pandas, 58 numpy, 59 scipy.stats 60 and statsmodels. 61 Visualisations were produced with matplotlib.pyplot, 62 and seaborn. 63 ML model development and preprocessing were implemented using scikit-learn, 64 with oversampling handled using imblearn, 65 and model interpretability assessed using shap. 66
Results
Participant characteristics
Table 1 outlines the baseline characteristics of the study population, comprising 279 patients. Participants had a median age of 74 years (interquartile range (IQR): 61–83). The median number of medications used was 11 (IQR: 8–15), and the median length of hospital stay was 20 days (IQR: 9–44). Median serum creatinine level was 79 µmol/L (IQR: 65–112) and median CFS was 5 (IQR: 4–6), indicating moderate frailty.
Participant characteristics.

AC, Anticoagulants; COPD, Chronic Obstructive Pulmonary Disease; DOAC, Direct-acting Oral Anticoagulant; IQR, Interquartile range; LoS, Length of Stay; meds, medicines; Min-Max, Minimum-maximum; OACTX, Treatment dose of oral anticoagulants; VTEPPX, Prophylaxis dose of anticoagulant; VTETX, Treatment dose of anticoagulant.
Males comprised 54% of the cohort, with 2.5% identified as Aboriginal and/or Torres Strait Islander. The most frequent medical conditions were hypertension (60.6%), cardiovascular disease (40.9%), type 2 diabetes (22.2%), stroke (19.0%), and depression (18.6%).
For chronic medications, 58.8% of participants used antihypertensives, 48.7% used lipid-lowering medications, 39.4% used opioids, 34.1% used antibiotics, and 32.6% used antidepressants. Other commonly used medications included insulin (23.3%), antiplatelet drugs (35.8%) and laxatives (41.2%).
Anticoagulant use during hospitalisation was common, with 73.5% of patients receiving an anticoagulant that was administered orally or intravenously. Most anticoagulation was provided at prophylactic-dose levels for venous thromboembolism prevention (VTEPPX), received by 68.5% of patients, while treatment-dose anticoagulation for venous thromboembolism (VTETX) was used in 5.0% and treatment-dose oral anticoagulants (OACTX) were used in 6.1% of patients.
Medication harm
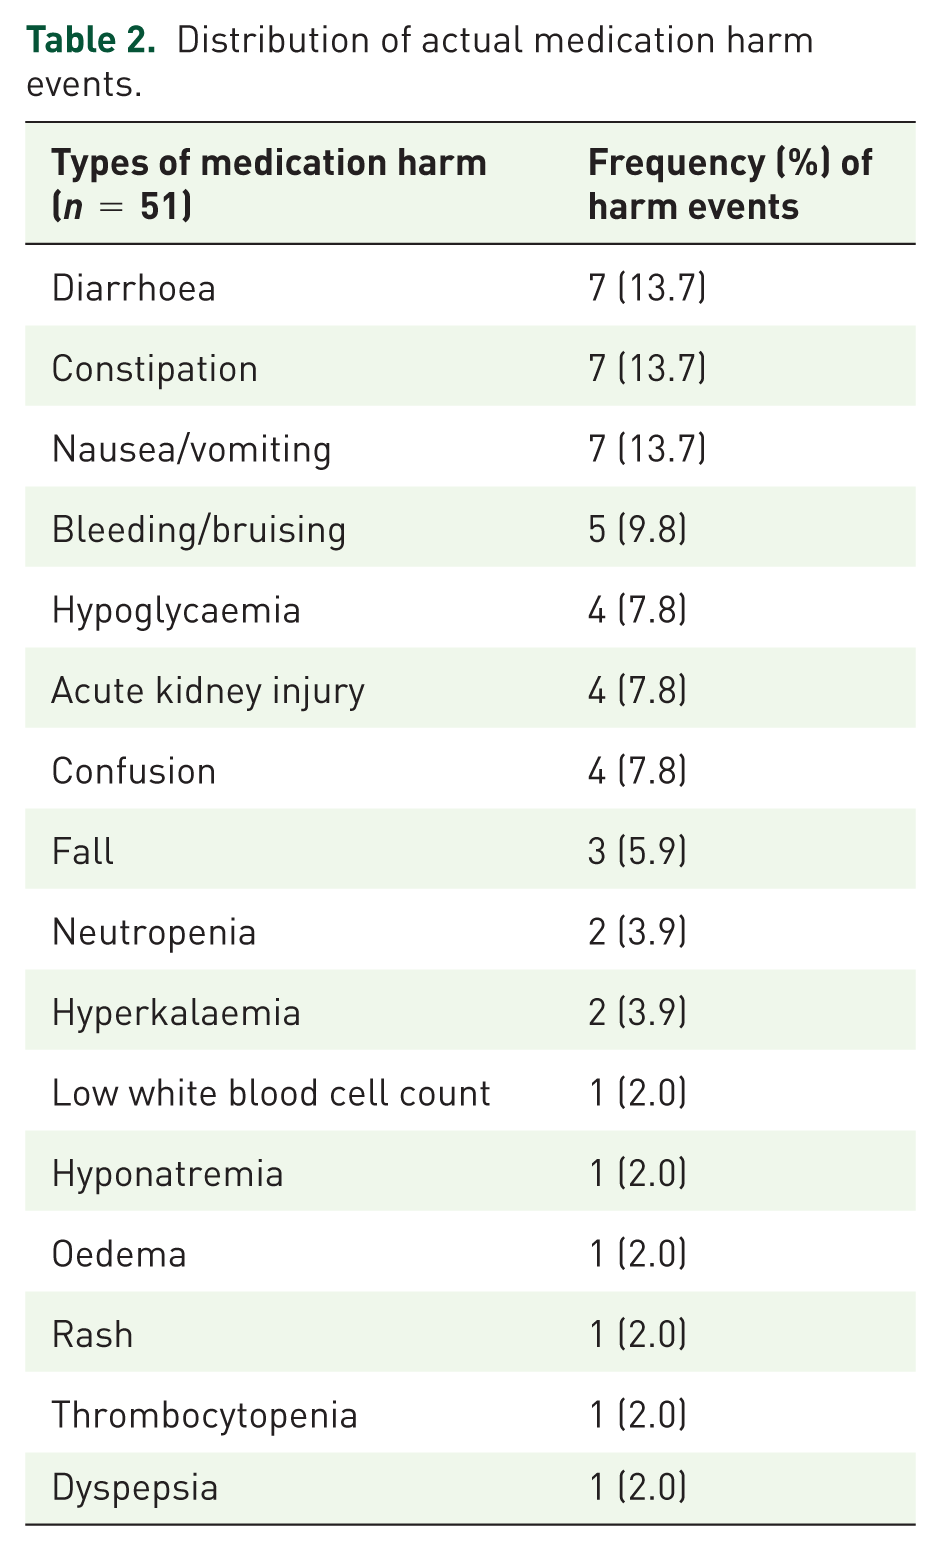
Table 2 lists the 51 observed instances of medication harm identified in 40 of the 279 patients, excluding the 164 additional cases generated through ADASYN. The most common medication harms were diarrhoea, constipation, and nausea/vomiting, each accounting for 7 events (13.7%). Bleeding or bruising occurred in 5 events (9.8%), while hypoglycaemia, acute kidney injury, and confusion each occurred in 4 events (7.8%). Falls occurred in 3 events (5.9%); neutropenia and hyperkalaemia each occurred in 2 events (3.9%). Additionally, low white blood cell count, hyponatraemia, oedema, rash, thrombocytopenia, and dyspepsia each occurred in 1 event (2.0%).
Distribution of actual medication harm events.
Model evaluation
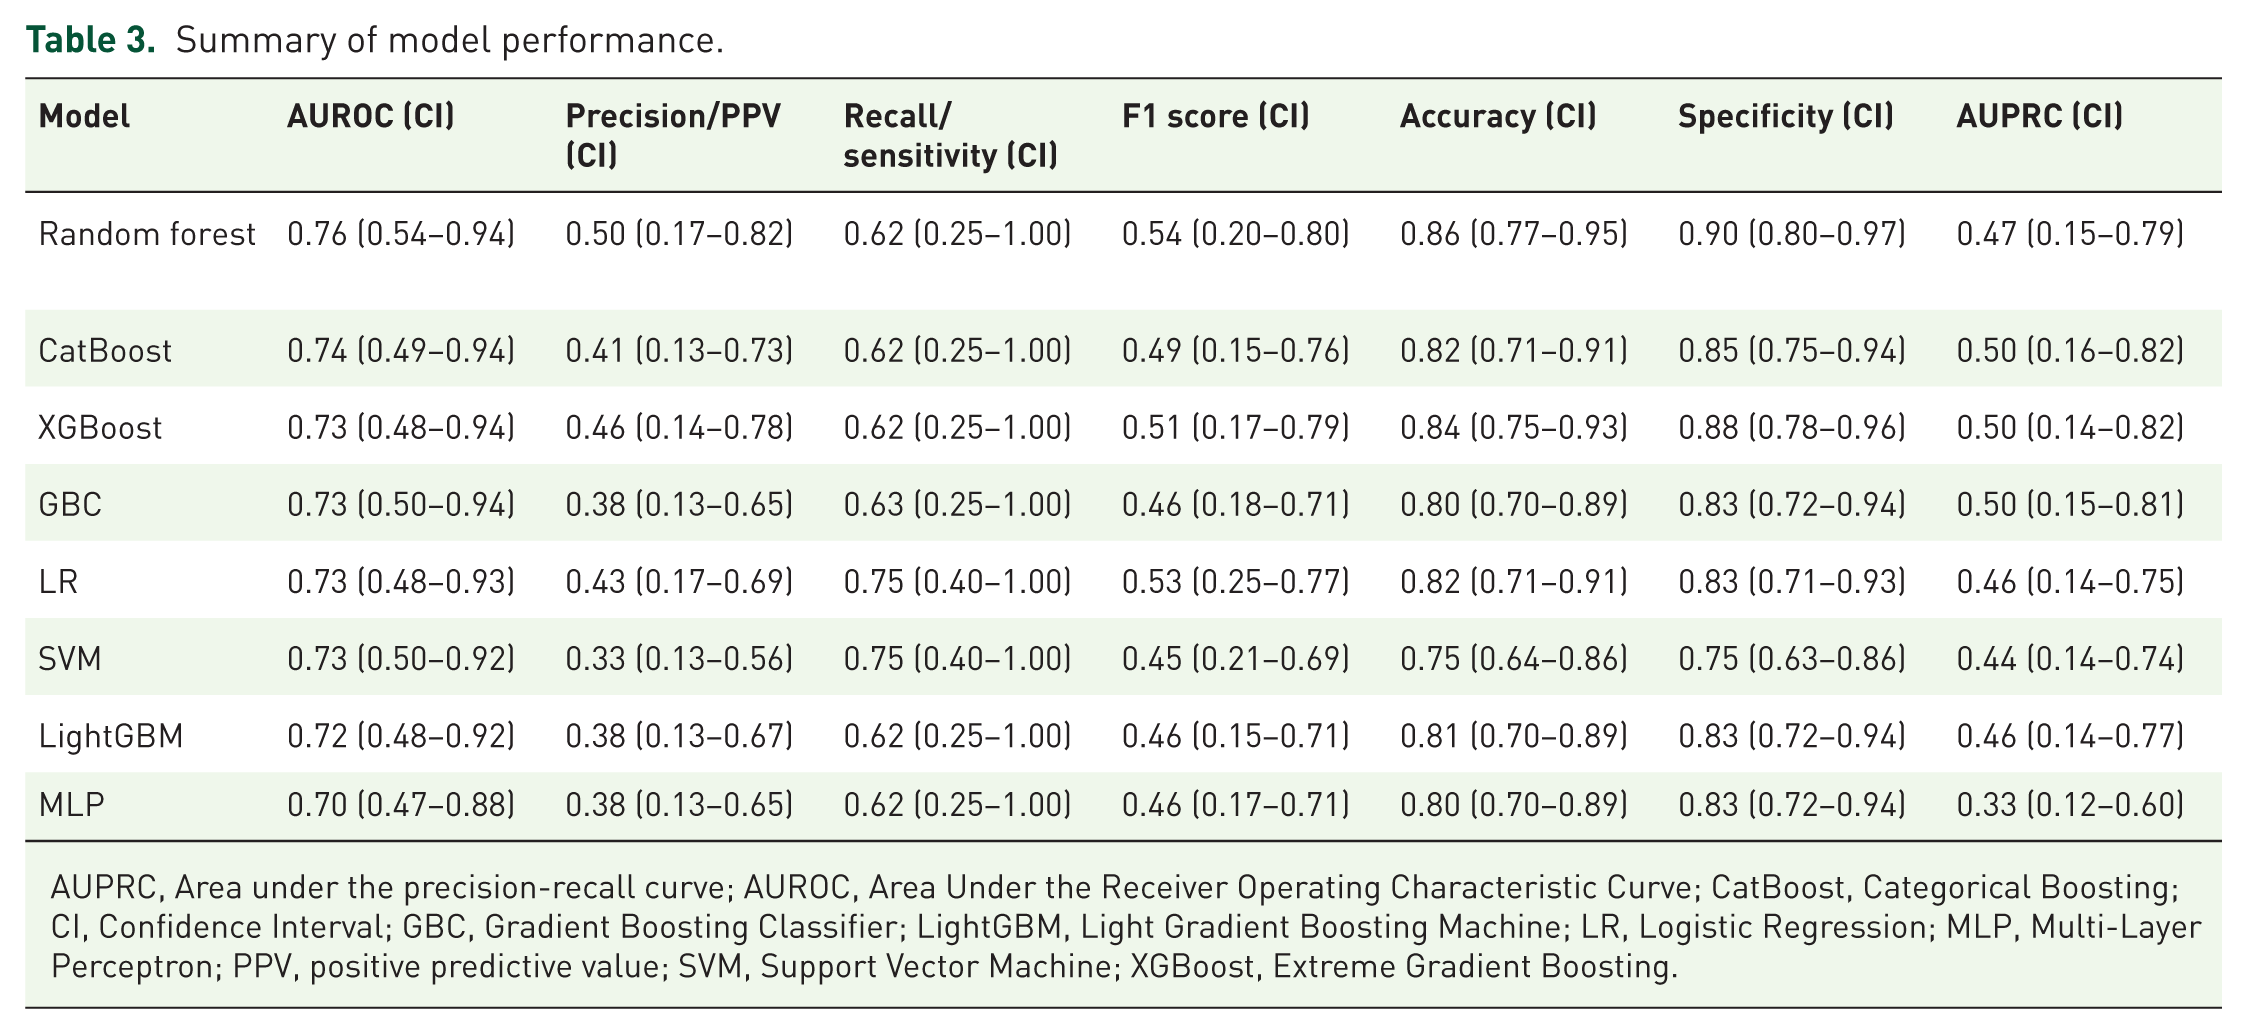
Based on AUROC, the eight models were ranked from best to worst, as follows: random forest, CatBoost, XGBoost, gradient boosting classifier, logistic regression, SVM, LightGBM, and MLP (Table 3). The optimised random forest model demonstrated the strongest overall performance across metrics, achieving an AUROC of 0.76 (95% CI: 0.54–0.94), AUPRC of 0.47 (95% CI: 0.15–0.79), precision (PPV) of 0.50 (95% CI: 0.17–0.82), recall (true positive rate) of 0.62 (95% CI: 0.25–1.00), F1 score of 0.54 (95% CI: 0.20–0.80), accuracy of 0.86 (95% CI: 0.77–0.95), and specificity (true negative rate) of 0.90 (95% CI: 0.80–0.97). This corresponded to a false positive rate of 0.10 and a false negative rate of 0.38. Figure 1 depicts the ROC curve and confusion matrix. Hyperparameter optimisation did not improve performance, with the default parameters being selected as optimal, and the final model using these settings, including 100 trees, the Gini criterion, and sqrt for maximum number of features.
Summary of model performance.
AUPRC, Area under the precision-recall curve; AUROC, Area Under the Receiver Operating Characteristic Curve; CatBoost, Categorical Boosting; CI, Confidence Interval; GBC, Gradient Boosting Classifier; LightGBM, Light Gradient Boosting Machine; LR, Logistic Regression; MLP, Multi-Layer Perceptron; PPV, positive predictive value; SVM, Support Vector Machine; XGBoost, Extreme Gradient Boosting.

Confusion matrix, AUROC curve and AUPRC of the best model (random forest). Validation dataset= (n = 56). True positive rate = 0.625, False positive rate = 0.104, True negative rate = 0.896, False negative rate = 0.375.
The CatBoost model demonstrated comparable performance, with an AUROC of 0.74 (95% CI: 0.49–0.94), precision of 0.41 (95% CI: 0.13–0.73), recall of 0.62 (95% CI: 0.25–1.00), F1 score of 0.49 (95% CI: 0.15–0.76), accuracy of 0.82 (95% CI: 0.71–0.91), specificity of 0.85 (95% CI: 0.75–0.94), and an AUPRC of 0.50 (95% CI: 0.16–0.82). While CatBoost had a lower AUROC, accuracy, specificity, precision, and F1 score compared with the random forest model, it demonstrated equivalent recall and slightly outperformed random forest in AUPRC. All other models achieved AUROC values above 0.70, indicating reasonable discriminatory performance.
Bootstrap resampling was performed on both the training and test datasets at different resample fractions (50%, 75%, and 100%) to assess the stability of model performance (Supplemental Appendix D). This analysis demonstrated that the model was robust in the training data, with narrow confidence intervals indicating stable performance estimates. In the test dataset, the confidence intervals widened, as expected, particularly at smaller resample fractions. Even when using the full test dataset (resample fraction = 100%), the intervals remained wider than those observed in training, reflecting both the limited size of the test dataset and uncertainty in model performance on unseen data. The slightly higher performance observed in the training dataset compared with the test dataset likely contributed to these differences and is consistent with expectations in small-sample settings. Overall, these findings highlight the expected variability in performance estimates on unseen data while supporting the reliability of the model.
Potential clinical utility
Decision curve analysis (Figure 2) demonstrated that the model provided a higher net benefit than both the “treat-all” and “treat-none” strategies across threshold probabilities of harm of approximately 0.10–0.40. This suggests potential benefit from targeted clinical intervention when the estimated risk of medication harm lies between 10% and 40%, compared with decision-making without model support. These findings underscore the potential clinical utility of the model in routine practice.
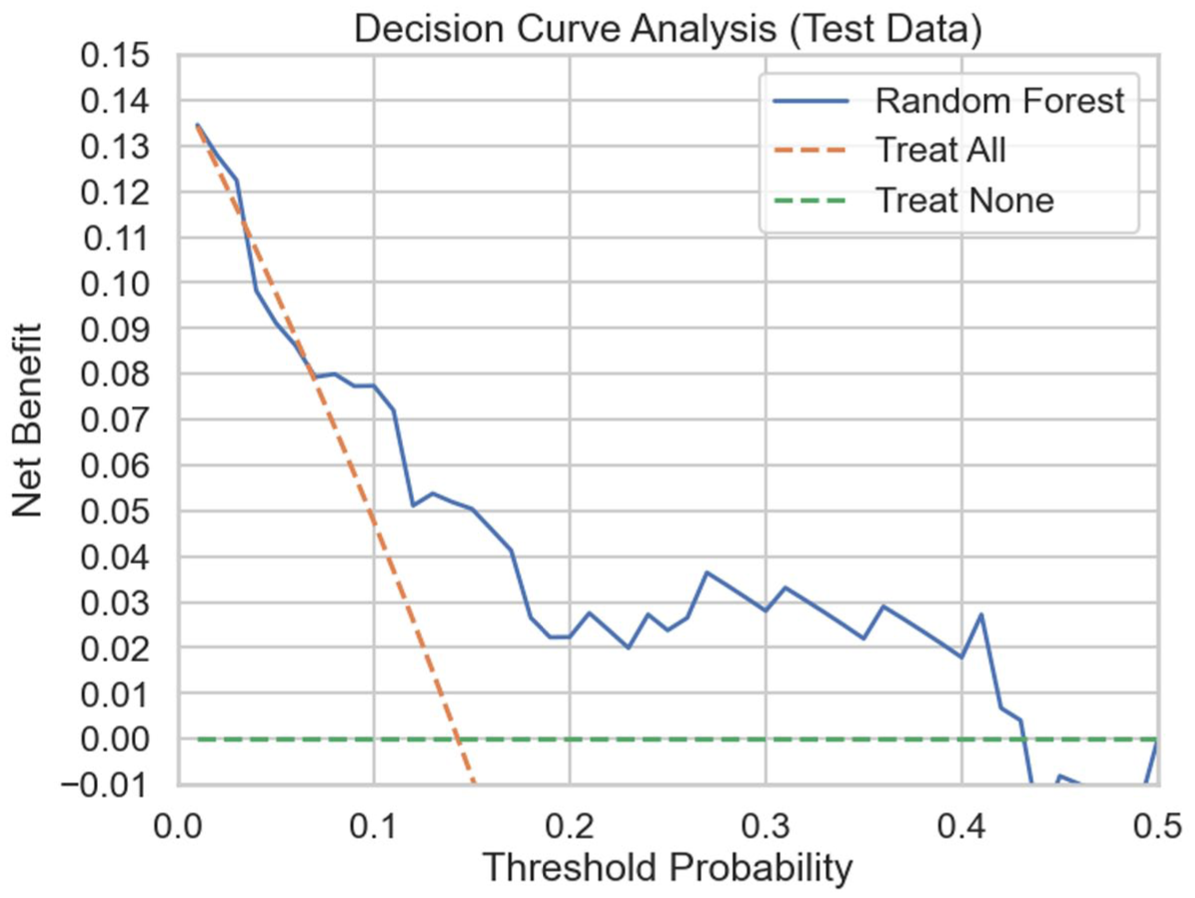
Decision curve analysis of best-performing model (random forest).
Model explainability
The SHAP summary plot depicted in Figure 3 illustrates both the relative importance and direction of each feature’s contribution to the model-predicted risk of medication harm, with higher positive SHAP values indicating a greater predicted probability of harm. Table 4 presents the mean absolute SHAP values, which quantify each variable’s overall influence on the model output. Depression showed the highest mean absolute SHAP value (0.144), followed by length of hospital stay (0.091), dementia (0.062), insulin use (0.058), and antibiotic use (0.050). Number of medications (⩾15; 0.044), older age (⩾65 years; 0.042), and opioid use (0.037) were also associated with an increased likelihood of medication harm. In contrast, antiplatelet use was associated with a lower probability of harm, although with a comparatively smaller contribution (0.015). The effect of serum creatinine (0.042) was highly variable, likely reflecting interactions with other patient characteristics.

SHapely Additive exPlanations features summary plot – Red dots represent higher values or presence of the feature (e.g., longer LOS, use of insulin or antibiotics, presence of dementia), while blue dots indicate lower values or absence of the feature (e.g., shorter LOS, no use of insulin or antibiotics, lower serum creatinine level, absence of dementia). Features positioned to the right of the SHAP value of 0.0 are associated with an increased risk of harm, whereas features to the left suggest a decreased risk of harm. A wider spread or higher density of dots indicates more significant variability or a more substantial impact, respectively, of the values of that feature on the model’s predictions. LOS: Length of Stay, Age Category: ⩾65 years, Meds Category: ⩾15.
SHapely Additive exPlanations (SHAP) values table.

Age Category: 65 years and older, Meds Category: 15 or more number of medications.
Additionally, the random forest feature importance plot with 95% confidence intervals (Supplemental Appendix E) shows each predictor’s contribution to model performance. Length of hospital stay demonstrated the highest mean importance (0.230 [95% CI: 0.197–0.266]), followed by serum creatinine (0.202 [0.172–0.233]) and depression (0.166 [0.118–0.220]). Dementia (0.093 [0.057–0.133]), insulin use (0.061 [0.038–0.100]), and number of medications (0.060 [0.040–0.093]) were also important contributors, while age category (⩾65 years; 0.052 [0.034–0.073]), opioid use (0.049 [0.033–0.073]), antibiotic use (0.048 [0.031–0.074]), and antiplatelet use (0.039 [0.030–0.049]) showed relatively smaller but consistent contributions to model performance. Overall, these results support the SHAP findings with depression, length of hospital stay, dementia, insulin use, antibiotic use, number of medications (⩾15), older age (⩾65 years), and opioid use emerging as the most influential predictors of medication harm.
Discussion
This study developed and evaluated eight ML models to predict medication harm in hospitalised older adult patients using a prospective dataset collected from 279 patients, supplemented by 164 oversampled cases of harm to address class imbalance. It has several strengths. First, compared with prior studies relying solely on relatively insensitive ICD coding of medication harm,67,68 our study adopted a more comprehensive approach to ascertainment by prospectively collecting data from multiple data sources in addition to ICD-10 coding. Second, we used clinical experts to both identify clinically relevant features and verify harm events as being causally related to medication, the latter a frequent omission among risk prediction studies, 69 underscoring the value of interdisciplinary collaboration between model developers and clinicians. Third, we trained eight separate ML models using 10 features and applied oversampling methods to address class imbalance in observed cases of harm. Fourth, we reported several performance metrics, including AUPRC, which are more informative than relying on AUROC alone. Finally, we identified a high-performing random forest model that outperformed the logistic regression model built in this study across multiple metrics (AUROC, AUPRC, PPV, F1 score, accuracy, and specificity), confirming its greater ability to encode complex, non-linear relationships and interactions among a greater number of features.20,21 As reported, the random forest model achieved an AUROC of 0.76, PPV of 0.50, sensitivity of 0.62, and specificity of 0.90, compared with 0.79, 0.14, 0.69, and 0.98, respectively, for the original regression-based AIME-Frail model. 22
While the AUROC of the random forest model (0.76) indicates strong overall discrimination, the AUPRC (0.47) demonstrates good precision-recall performance compared with a baseline random performance equal to the low prevalence of medication harm (40 of 279 cases; 14.3%). This indicates the model performs approximately 3.3 times better than chance in identifying true positive cases and is comparable with values frequently observed in other studies featuring class imbalance.70,71 The improved PPV of the random forest model comes at the expense of a somewhat lower sensitivity and specificity compared with the AIME-Frail model. 22 The higher PPV for the random forest may also reflect a higher prevalence of harm in this study, which used more sensitive measures of harm than AIME-Frail that relied on ICD discharge coding alone. 22
Comparison with prior research
Previous studies, including both ML-based models72-78 and one traditional statistical model, 76 have identified various clinical features in predicting medication harm in hospitalised patients that correspond to those seen in our ML model.
Seger et al. 73 reported that among at-risk patients, receiving five or more medications was associated with a mean (standard deviation [SD]) of 6.7 (4.1) medication warnings. Wei et al. 74 demonstrated that a pre-existing elevated creatinine level is a predictor of medication-related acute kidney injury, defined as an increase in serum creatinine of 0.3 mg/dL or 50% from the baseline value or urine output of <0.5 mL/kg/h. Dave et al. 75 identified the amount and timing of insulin doses delivered by insulin pumps and carbohydrate intake as features predictive of hypoglycaemic risk.
Hu et al. 72 built an ML model in which longer length of hospitalisation, older age, and antibiotic use were seen as important features predicting medication harm, as we also noted. However, no other ML study, apart from ours, has specifically identified dementia, opioid use, and depression as predictors, although these have been noted in various non-ML clinical studies. Just et al. 77 calculated odds ratios (ORs) to assess the association of opioids with medication harm, reporting an OR of 1.79 (95% CI: 1.26–2.54). Onder et al. 78 similarly identified depression as a predictor of medication harm among hospitalised older adults, with an OR of 1.58 (95% CI: 1.14–2.20).
In contrast, Sakiris et al. 76 found that adverse drug events were less frequent in patients with dementia versus those without dementia (8.3% vs. 14.6%; p < 0.001). This association was derived from a multivariable logistic regression model and reflects the adjusted effect of dementia within the context of the included predictors, not a direct causal effect. Another unexpected finding in our study was the association between antiplatelet use and lower risk of medication harm, which differs from the well-documented risk of bleeding, particularly in patients receiving multiple antiplatelet agents. 79
Clinical implications
From a clinical perspective, the greater PPV of the random forest model means clinicians only have to review two patients to identify the one patient truly at risk of experiencing medication harm, enabling a targeted approach to medication review and other interventions without overwhelming clinicians with false alerts. At the same time, the random forest model fails to predict about a third of harm events, which may or may not be serious events impacting patient well-being. Further studies are warranted to examine the relationship between model-predicted risk and the severity of harm events. Increasing sensitivity when harm prevalence is low comes with an increase in false positives, which can exacerbate clinician workloads. Such trade-offs are inevitable in using prediction models, and it is up to the local stakeholders to decide the choice of trade-off depending on site-specific imperatives regarding patient safety, staffing ratios and workloads, and resource availability.
Despite these possible shortcomings in performance, prediction models have shown potential to improve patient medication management. As examples, Segal et al. 80 reported that their ML model was highly accurate in detecting medication errors likely to cause adverse drug events. Stenokova et al. 81 developed highly accurate models that distinguish penicillin allergy from intolerance and high-risk from low-risk allergy. Finally, Imai et al. 82 developed a neural network model that accurately predicts vancomycin-induced nephrotoxicity.
Limitations
A major limitation was the small dataset used for model training, which was obtained from patients admitted to one hospital. This risks model overfitting and limits its generalisability, especially when it is yet to be externally validated. Additionally, we observed wide confidence intervals for certain performance metrics, such as recall, reflecting both the small dataset size and the use of oversampling methods to address class imbalance, which may have increased variance and instability in performance estimates.
Excluding the CFS from model development due to its lack of routine documentation in EHRs, despite its potential as an important predictor of harm, highlights the challenge of improving EHR documentation to support more accurate risk prediction models that use all potentially useful clinical features. The present study underscores the importance of considering both data availability and clinical relevance when selecting features in ensuring models can be integrated into real-world clinical settings.
Future directions
Future studies predicting medication harm using ML should prioritise collecting contemporary and representative large datasets from EHRs and employing sensitive measures of medication harm to enhance model accuracy and generalisability. As there is no single best model technique, future research should compare various models to ensure the most suitable model is identified and selected for a given prediction task in a specific setting targeting a defined patient population. 83 In doing so, collaboration between data scientists and clinicians is essential in developing and evaluating clinically applicable models that can be integrated into local workflows and assessed for their impact on care and patient outcomes through prospective “silent mode” evaluations and pragmatic clinical trials. 84
Conclusion
This study highlights the potential of supervised ML models for predicting medication harm among hospitalised adult patients. As a proof of concept, it demonstrates that a random forest model with high PPV can be developed using a relatively small dataset of prospectively ascertained and clinician-verified harm events, with close collaboration between data scientists and clinicians to ensure appropriate selection of predictive features. Although such methods are resource-intense, having larger clinically curated datasets from specific patient populations will yield more accurate and generalisable models likely to perform reliably when externally validated, paving the way for clinical trials and eventual adoption into clinical practice.
Supplemental Material
sj-docx-1-taw-10.1177_20420986251409325 – Supplemental material for Machine learning risk prediction models for medication harm in hospitalised adult patients
Supplemental material, sj-docx-1-taw-10.1177_20420986251409325 for Machine learning risk prediction models for medication harm in hospitalised adult patients by Jonathan Yong Jie Lam, Michael Barras, Ian A. Scott, Hassan Masood, Ahmad Abdel-Hafez and Nazanin Falconer in Therapeutic Advances in Drug Safety
Footnotes
Acknowledgements
The authors would like to thank the Princess Alexandra Research Foundation for their generous support of research in the field of patient safety.
Declarations
ORCID iDs
Supplemental material
Supplemental material for this article is available online.
References
Supplementary Material
Please find the following supplemental material available below.
For Open Access articles published under a Creative Commons License, all supplemental material carries the same license as the article it is associated with.
For non-Open Access articles published, all supplemental material carries a non-exclusive license, and permission requests for re-use of supplemental material or any part of supplemental material shall be sent directly to the copyright owner as specified in the copyright notice associated with the article.