
Abstract
Background:
A reliable approach to predict the response to Ustekinumab (UST) in patients with Crohn’s disease (CD) is lacking.
Objectives:
This study aims to develop and validate machine learning (ML) models to predict the response to UST and further achieve personalized therapy.
Design:
Retrospective multi-center study.
Methods:
This study included 162 CD patients treated with UST between May 2022 and May 2024. Four ML algorithms (extreme gradient boosting, random forest, logistic regression, and support vector machine) were integrated to identify the optimal model, and Shapley Additive exPlanations (SHAP) interpretation was used for visual explainability. Two models were established to forecast the response to UST, with the outcomes of the response situation at week 26 and secondary loss of response (sLOR) status at week 52, respectively. Eighty-two CD patients from the other five centers were applied for the week-26 model’s external validation.
Results:
XGBoost performed excellently among the four ML algorithms. The week-26 model exhibited good performances of 0.88 area under the receiver operating characteristic curve (AUC), 0.92 area under the precision-recall curve, and 0.86 F1 score. The sLOR model demonstrated acceptable predictive performance with 0.74 AUC.
Conclusion:
We developed and validated models to predict UST response for CD patients and interpreted related factors by the SHAP method. We hope that the models can assist physicians in identifying patients who are suitable for UST at baseline and further explore who are at high risk for sLOR.
Plain language summary
Introduction
Crohn’s disease (CD) is a chronic inflammatory gastrointestinal disorder with a poorly understood pathogenesis. 1 Recent advances in elucidating its immune mechanisms have expanded the range of therapeutic options, including biological agents like Ustekinumab (UST), which targets interleukin (IL)-12 and IL-23 cytokines. 2 While UST has shown promise in the treatment of CD, some patients may gradually lose response over time, a condition known as secondary loss of response (sLOR). 3 One study reported that the risk of sLOR in CD patients was 21% per person per year. 4 Biological therapies are not only costly but also associated with potential risks such as infections and allergic reactions. The emergence of loss of response (LOR) exacerbates the economic burden on patients, complicates disease management, and potentially poses life-threatening consequences. 5 To lessen the medical burden, it is crucial to identify patients with a greater chance of responding to UST before administration and patients at high risk for sLOR. Hence, it is necessary to develop a reliable method for predicting the response of CD patients to UST.
The exponential increase in biomedical data (from genomics, transcriptomics, protein genomics, imaging, therapeutics, and electronic health information) has created an urgent need for advanced analytical methods capable of interpreting the massive, complex, and interrelated data. 6 Machine learning (ML) has recently gained significant attention in inflammatory bowel disease (IBD). Its realization relies on identifying and analyzing the vast medical data which are difficult for humans to capture, thereby providing potential new insights for disease management.7,8 Several ML models have been used to innovate and explore CD management, including prognosis and medication response prediction.9,10 However, due to the “black box” nature of ML algorithms, it is difficult to understand how these models make predictions specifically. Undoubtedly, the lack of interpretability has limited further development and utilization of more powerful ML algorithms in the medical field. 11 To address this limitation, we employed Shapley Additive exPlanations (SHAP) for intuitive understanding, a widely used unified framework that interprets ML models by assigning feature importance to predictions.11,12
Generally, we aim to combine ML algorithms and the SHAP interpretation tool to establish prediction models based on CD patients: (1) help identify patients with CD who are more likely to achieve remission with UST at baseline and (2) further explore the possible factors of sLOR for patients. It is hoped that our study could assist clinicians in making medical decisions, contributing to the development of personalized therapy.
Materials and methods
Study design and population
This study retrospectively collected the data of patients with CD who visited the Third Xiangya Hospital of Central South University from May 2020 to May 2024. Inclusion criteria included the following: (1) a confirmed CD diagnosis and age ⩾18 years and (2) active CD as assessed by biochemical, endoscopic, or imaging data, or patients requiring corticosteroid medication. Exclusion criteria were as follows: (1) Patients who have not been treated with UST; (2) patients lacking baseline clinical and laboratory data; and (3) patients with a treatment duration of less than 26 weeks or a follow-up period of less than 52 weeks from the first administration of UST. The detailed information on patients’ inclusion and exclusion is shown in Figure 1. The patients got a single intravenous injection of a dose range (260–520 mg, or about 6 mg/kg) based on their body weight the first time. After 8 weeks, they got 90 mg subcutaneously, and after that, they got 90 mg subcutaneously every 12 weeks for maintenance treatment. A total of 162 patients were included. Moreover, we recruited 82 patients from five other centers (The First Affiliated Hospital of University of South China; The First Hospital Affiliated with Hunan Normal University, Hunan Provincial People’s Hospital; Xiangxi Tujia and Miao Autonomous Prefecture People’s Hospital; Zhuzhou Central Hospital; Shaoyang Central Hospital) for external validation, and the same criteria outlined above were applied. Other centers retrospectively collected 583 CD patients from May 2020 to May 2024 according to the above inclusion criteria. In all, 327 patients were excluded due to never being exposed to UST, 152 patients were excluded due to data deficiencies, 22 patients were excluded due to insufficient medication or follow-up time, and 82 patients were finally included for model validation.

Flowchart of patients’ inclusion and exclusion.
Collected variables
We collected a lot of predictor variables, including patient-related variables (age, gender, body mass index (BMI), smoking), disease-related variables (disease duration, behavior, location, previous surgery, etc.), previous medication before UST (immunosuppressants, steroids, biologics), and laboratory parameters (serum albumin, hemoglobin, platelets, etc.). All variables used in the analysis are shown in Table 1.
Characterization and comparison of the training and validation cohorts.

Age, age of disease onset; BMI, body mass index; CDAI, Crohn’s disease activity index; CRP, C-reactive protein; ESR, erythrocyte sedimentation rate; SES-CD, simple endoscopic score for CD; time interval, years between diagnosis and start of UST; TNF, tumor necrosis factor; UST, Ustekinumab.
Definition of outcomes
Outcome was defined as the response situation at week 26. Satisfying one of the following two conditions in the absence of systemic steroids was considered indicating response to UST: (1) Crohn’s disease activity index (CDAI) ⩽150 or 50% reduction from baseline at least and (2) simple endoscopic score for CD (SES-CD) ⩽2 or 50% reduction from baseline at least. Moreover, patients who failed to meet the above criteria at week 26 or experienced the following conditions during the 26 weeks were all defined as non-responders: (1) received CD-related surgery, (2) required additional systemic corticosteroids, (3) increased UST doses, and (4) changed the medication regimen caused by diseases.
In addition, 104 patients who responded to UST at week 26 continued maintenance therapy until week 52. Patients who meet one of the following conditions between the 26th and 52nd weeks are considered as sLOR: (1) CDAI score ⩾220 and an increase from their baseline CDAI score of ⩾100 points, (2) adjust the drug regimen due to illness activity (increase the frequency of drug use and replace biological agents), and (3) had a surgery related to CD.
Data preprocessing and feature selection
Given that only two patients had minimal missing data (one each from the remission and non-remission groups), missing values were imputed using remission status-stratified mean values.13,14 Then, we used the stepwise forward and backward strategy on the basis of information gain (IG) to pick the features. IG measures the reduction in entropy achieved by partitioning the dataset based on a given feature. 13
ML model development and evaluation
In this study, four ML approaches were combined to determine the best-performing model: extreme gradient boosting (XGBoost), random forest (RF), logistic regression (LR), and support vector machine (SVM). Hyperparameter tuning was conducted via grid search with fivefold cross-validation during model development. Performance of the four ML models was compared using receiver operating characteristic curve (ROC), precision-recall (P-R) curves, calibration curves, and F1 scores to identify the optimal model. In addition, we further conducted validation with the selected optimal ML algorithm on the 82 patients from five other centers.
SHAP analysis for visual interpretation of the results
SHAP was a well-established method for the visual explainability of ML models. We used SHAP analysis to interpret the model results by calculating the contribution of each feature to the prediction results.
sLOR ML model
For 104 patients with sLOR to UST, we re-collected their clinical data at week 26. Moreover, the same procedures mentioned above were applied for model development and verification to explore the factors related to the sLOR at week 52: (1) feature selection, (2) model generation, and (3) SHAP analysis for visual interpretation of the results.
Statistical analysis
Data analysis was conducted using IBM SPSS statistical software package version 26.0 (IBM, Armonk, NY, USA) and Python 3.6 (Python Software Foundation, USA).
The study was conducted in accordance with TRIPOD + AI guidelines 15 and conformed to the Strengthening the Reporting of Observational Studies in Epidemiology (STROBE) statement. 16
Results
Demographic and disease characteristics
In total, 162 patients were enrolled to construct the week-26 model, and 82 patients were recruited for external verification. Baseline characteristics were well-balanced between the two cohorts, with no statistically significant differences observed in most features (p > 0.05), except for intestinal fistula prevalence (8.0% vs 18.3%, p = 0.017), steroid use (20.4% vs 34.1%, p = 0.019), and overall disease behavior distribution (p = 0.000). Both cohorts showed similar demographic profiles: predominantly male (71% vs 79.3%, p = 0.165), with comparable mean age (26.7 ± 10.7 vs 28.6 ± 11.0 years, p = 0.191) and BMI (20.4 ± 3.8 vs 20.9 ± 3.6 kg/m², p = 0.338). Disease characteristics, including duration (4.2 ± 4.6 vs 4.7 ± 4.0 years, p = 0.382), CDAI (252.3 ± 64.9 vs 250.8 ± 81.3, p = 0.888), and SES-CD (12.8 ± 5.4 vs 77 ± 5.8, p = 0.659), demonstrated no significant inter-cohort differences. Notably, the external validation cohort showed a higher proportion of penetrating disease behavior compared to the training cohort. Laboratory parameters, including serum albumin (37.4 ± 5.5 vs 38.3 ± 5.2 g/L, p = 0.185), C-reactive protein (CRP) (31.4 ± 34.1 vs 28.0 ± 32.4 mg/L, p = 0.447), and erythrocyte sedimentation rate (ESR; 48.1 ± 31.1 vs 41.1 ± 30.1 mm/h, p = 0.093), were comparable between groups, as were complete blood count parameters (all p > 0.05). All the clinical and biochemical features of the training and external validation cohorts are detailed in Table 1.
Week-26 model
Feature selection
We obtained the optimal portfolio for the ML algorithm on the basis of IG. The total change curve of the F1 score for all variables is displayed in Figure 2(a). The F1 score performance curve of these selected features is shown in Figure 2(b).
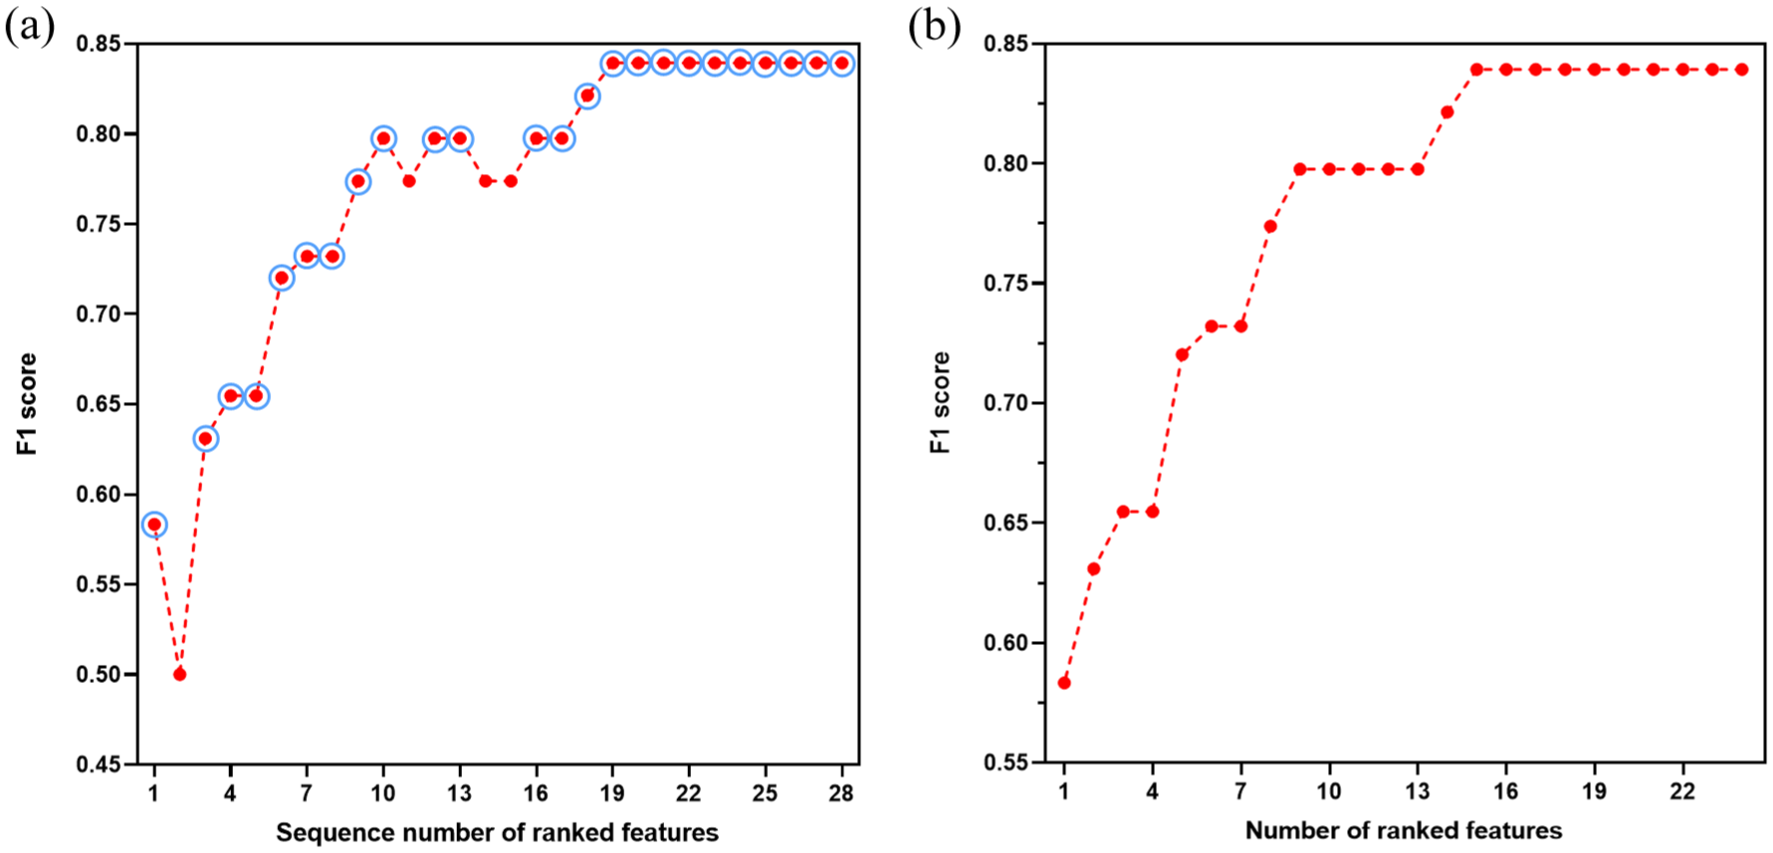
Feature selection by XGBoost of the week-26 model. (a) The total variation curve of F1 scores for all variables. The finally selected features were marked with circles. (b) The variation curve of F1 scores for the above-selected features.
Prediction performance
The performance of four ML models was compared using ROC, P-R curves, calibration curves, and F1 scores. The results are shown in Figure 3. Obviously, XGBoost demonstrated the best performance.

Performance comparison of week-26 models: (a) ROC curves, (b) precision-recall curves, (c) calibration curves, and (d) comparison of F1-score across models.
SHAP analysis to model interpretation
SHAP was used to visually explain the selected features. As shown in Figure 4(a), 17 factors were ranked by the average absolute SHAP value. The greater the x-axis SHAP value, the more important this feature is to the final outcome. In Figure 4(b), red indicates a high value of the features while blue indicates a lower value. A positive (negative) SHAP value represents the positive (negative) influence of this feature on the model output. Results showed that patients with higher serum albumin, lower CRP, lower ESR, younger patients, and lower neutrophils were more likely to achieve remission after receiving UST.

Interpretation of week-26 model and sLOR model. (a) Feature importance of the week-26 model, ranked by the average absolute SHAP value. (b) Attribution of features in SHAP for the week-26 model. Each characteristic line is formed with colored dots, and the abscissa is the SHAP value. Higher eigenvalues are shown by red dots, whereas lower eigenvalues are indicated by blue dots. (c) Feature importance of the sLOR model. Seven variables were finally selected, including time interval, SES-CD, neutrophils, hemoglobin, biologics, PLT/L, and N/L. (d) Contribution of each feature to the sLOR model.
External verification
According to the above results, we chose XGBoost as the best algorithm. The data of 82 patients were collected for external verification. The results were 0.81 AUC, 84.15% accuracy, 86.21% precision, 90.91% recall, and 88.50% F1 score. The mixed matrix result of external verification is shown in Figure 5.

The mixed matrix results of external verification.
Prediction model of sLOR
A total of 104 patients achieved remission at week 26 and were included in the sLOR model. Of these patients, 21 experienced sLOR at week 52. Among these 21 patients, 8 were switched to alternative biological agents or received intensive UST treatment due to inadequate therapeutic outcomes, 3 underwent surgical intervention, 1 discontinued medication due to adverse drug reactions, and 9 were classified as sLOR according to their CDAI scores at the 52-week assessment. We also used the above four ML models to construct the sLOR model, and XGBoost showed acceptable performance with 0.74 AUC (vs RF 0.66 AUC, LR 0.57 AUC, and SVM 0.36 AUC). However, the P-R curves, calibration curves, and F1 score of each model were not good (Supplemental Figure 1). Seven variables were finally selected for the sLOR model (Figure 4(c)). Moreover, SHAP was also used to illustrate how these variables worked in the model. As shown in Figure 4(d), longer time intervals, higher SES-CD, higher neutrophils, lower hemoglobin, and never using biologics before UST are related to sLOR.
Discussion
CD, a complex and multi-factorial intestinal inflammatory disease, poses a significant burden on patients. 17 Currently, UST has been used to treat CD. However, treatment response varies among individuals. Some patients may initially respond to UST but later develop sLOR. 18 Consequently, we aim to use ML to build prediction models for the efficacy and sLOR of UST for Chinese patients. In our research, we compared four ML algorithms, among which XGBoost had the best performance with 0.88 AUC in the week-26 model and 0.74 AUC in the sLOR model. Furthermore, external validation of the week-26 model yielded good results. Our study is expected to help clinicians effectively identify patients suitable for UST at baseline, as well as discern whether there is a high risk of sLOR after patients have disease remission, thereby facilitating personalized treatment for patients and reducing the disease burden.
Several studies have reported the factors that affect the efficacy of UST in CD.2,19,20 Waljee et al. established two prediction models with RF based on the characteristics at baseline and week 8 after UST treatment. However, the accuracy of the model developed with baseline data was not ideal (AUC 0.59), so it was not adopted eventually. 19 In our study, the week-26 model using baseline data exhibited improved performance (AUC 0.88). Liefferinckx et al. used three ML algorithms, which were LR, RF, and Gradient Boosting Decision Tree, to evaluate the influence of the pharmacokinetics of UST on clinical and endoscopic remission during induction, and to find relevant predictive markers. Finally, RF showed the best performance, with 0.92 AUC. 20 Unlike this, our study used XGBoost as the optimal algorithm. Also, we used SHAP to improve the interpretability of prediction models.
In the week-26 model, serum albumin was the most important characteristic. Albumin synthesis is affected by inflammatory reaction. 21 It has also been reported that albumin concentration is related to the clearance rate of monoclonal antibodies. 22 Chaparro et al. used ML to identify the baseline predictors of remission and drug persistence in CD patients treated with UST. Their results indicated that albumin is a predictor of remission. 2 Our study also exhibited that lower serum albumin levels at baseline were associated with remission. CRP and ESR are crucial indicators for assessing inflammatory status. Our results indicated that patients with lower baseline levels of CRP or ESR showed a significantly higher probability of achieving remission following UST treatment, which is similar to previous studies.23,24 A study indicated that among the subgroup of patients treated with UST, a higher baseline age was independently associated with a higher rate of combined biochemical and clinical remission. 25 By contrast, our study found a trend suggesting that patients with a lower baseline age may be more likely to achieve remission. Intriguingly, numerous studies have also reported no significant correlation between age and response to UST treatment. 26 Patients with IBD across different age groups may exhibit differences in terms of comorbidities 25 (such as diabetes, solid tumors, etc.) or other aspects (such as dietary habits). Therefore, additional studies are needed to further explore the impact of age on the efficacy of UST. Platelets were involved in the IBD inflammatory cascade, 27 which may affect the effectiveness of UST.
External verification is often used to test the universality of the ML model. 28 Baseline characteristics were well-balanced between the training and validation cohorts. Most characteristics showed no significant differences between cohorts (p > 0.05), with only three exceptions: intestinal fistula, steroid use, and behavior (p < 0.05). Importantly, intestinal fistula and steroid were not selected for the week-26 model, while behavior demonstrated the lowest feature importance score among all variables in the final model. In addition, the external verification showed good results (AUC 0.81), providing a possible application of the models in clinical practice, and it is expected to be popularized in subsequent research.
In the sLOR model, seven features were finally selected, including time interval, SES-CD, neutrophils, hemoglobin, biologics, platelets/lymphocytes (PLT/L), and neutrophils/lymphocytes (N/L). Previous views have suggested that sLOR is related to factors such as serum drug trough concentrations, Anti-Drug Antibodies, and high inflammation levels. 29 However, research shows that compared with anti-TNF-α, UST is less immunogenic. The positive rate of ADAs after regular use of UST for 1 year is only 2.3%. 30 In addition, the existing evidence-based medical evidence fails to prove that UST’s drug trough concentration monitoring can well guide medication and avoid the occurrence of drug non-response. 31 Therefore, our study focuses on disease-related factors in patients as predictors. The result revealed that the time interval from diagnosis to the initiation of UST therapy was closely associated with sLOR of UST, consistent with previous research. 2 In addition, patients with higher baseline SES-CD were more likely to experience sLOR, consistent with previous research findings. 32 Specifically, individuals with elevated SES-CD often exhibited more severe intestinal mucosal inflammation, which may serve as a pivotal factor underlying sLOR. Neutrophils are pivotal in IBD pathogenesis. 33 Moreover, baseline neutrophils served as a critical predictor of disease remission and therapeutic response to UST for CD patients in our study. Similar findings were reported in ulcerative colitis patients, with increased neutrophil infiltration in non-responders. 34 Correlation between low hemoglobin levels at baseline and sLOR in CD patients was revealed in our study. Low Hb levels often indicate poor nutritional status, inadequate hematopoiesis, or the presence of ulcer bleeding in patients, and may also reflect a higher disease activity. Our research showed that the use of previous biologics is related to sLOR of UST. In the week-26 model, we found that patients who had not previously used other biologics were more likely to achieve remission, consistent with previous research findings. 35 However, interestingly, in the sLOR model, we observed the opposite result: patients who had not previously used other biologics were more prone to experience sLOR, a phenomenon that has not been reported in previous studies. We further conducted binary LR analysis, which confirmed that prior biologic use was a protective factor against sLOR (OR = 0.336, 95% CI: 0.113–1.002, p = 0.050). It is worth noting that our sLOR model was based on a subgroup of patients who achieved remission at week 26. This suggests that for patients who have previously used biologics and did not experience primary LOR to UST, their subsequent likelihood of experiencing LOR may be lower than that of UST-naive patients. The underlying mechanisms for this protective effect warrant further investigation. Furthermore, our findings revealed that PLT/L and N/L were associated with sLOR. Li et al. showed that the patients’ greater levels of PLT/L indicate a higher amount of inflammation, and PLT can be used as an indicator of CD disease severity. 36 Another research suggested that the value of N/L could serve as a useful tool for predicting a loss of responsiveness to infliximab. 37 Collectively, the results indicated that PLT/L and N/L hold promise as biomarkers for IBD. The sLOR model achieved an AUC of 0.74, which may be due to the dynamic disease progression observed in secondary non-responders during the 52-week follow-up period. Nevertheless, this represents a meaningful exploratory effort. Future studies will incorporate longitudinal data (e.g., features at weeks 8 and 26) to develop more accurate prediction models for sLOR.
However, there are some limitations to our study. First, our study design is retrospective in nature, which may introduce potential selection and information biases, so prospective validation remains necessary for clinical confirmation. Second, the sample size is relatively small. Third, the current study lacks external validation of the sLOR model, primarily due to the extended follow-up duration required for assessing sLOR and the inherent challenges in multi-center data collection. Hence, we plan to collect more samples in a prospective multi-center cohort study to further optimize the performance of the predictive model. Then transform the optimized model into an interactive web scoring tool, and confirm its impact on IBD doctor decision-making through impact assessment. If positive results are observed, randomized controlled trials will be conducted to validate and ultimately transform them into mature predictive models that can be clinically promoted.
Conclusion
In conclusion, we constructed models with XGBoost to predict the response of UST. These prediction models may be useful to identify features related to remission and sLOR for patients with CD. It is hoped that our study could provide a reference to guide clinicians in practice, contributing to the development of personalized therapy.
Supplemental Material
sj-docx-1-tag-10.1177_17562848251382749 – Supplemental material for Machine learning-based prediction of response to Ustekinumab with Crohn’s disease
Supplemental material, sj-docx-1-tag-10.1177_17562848251382749 for Machine learning-based prediction of response to Ustekinumab with Crohn’s disease by Ziyi Xiong, Pan Gong, Tianjing Meng, Zili Xiong, Mingmei Ye, Yuanyuan Huang, Xiayu Mao, Panpan Zhao, Yu Zhang, Weiwei Zhou, Xuefeng Li and Li Tian in Therapeutic Advances in Gastroenterology
Footnotes
References
Supplementary Material
Please find the following supplemental material available below.
For Open Access articles published under a Creative Commons License, all supplemental material carries the same license as the article it is associated with.
For non-Open Access articles published, all supplemental material carries a non-exclusive license, and permission requests for re-use of supplemental material or any part of supplemental material shall be sent directly to the copyright owner as specified in the copyright notice associated with the article.