
Abstract
Background:
Logistic regression-based signal detection algorithms have benefits over disproportionality analysis due to their ability to handle potential confounders and masking factors. Feature exploration and developing alternative machine learning algorithms can further strengthen signal detection.
Objectives:
Our objective was to compare the signal detection performance of logistic regression, gradient-boosted trees, random forest and support vector machine models utilizing Food and Drug Administration adverse event reporting system data.
Design:
Cross-sectional study.
Methods:
The quarterly data extract files from 1 October 2017 through 31 December 2020 were downloaded. Due to an imbalanced outcome, two training sets were used: one stratified on the outcome variable and another using Synthetic Minority Oversampling Technique (SMOTE). A crude model and a model with tuned hyperparameters were developed for each algorithm. Model performance was compared against a reference set using accuracy, precision, F1 score, recall, the receiver operating characteristic area under the curve (ROCAUC), and the precision-recall curve area under the curve (PRCAUC).
Results:
Models trained on the balanced training set had higher accuracy, F1 score and recall compared to models trained on the SMOTE training set. When using the balanced training set, logistic regression, gradient-boosted trees, random forest and support vector machine models obtained similar performance evaluation metrics. The gradient-boosted trees hyperparameter tuned model had the highest ROCAUC (0.646) and the random forest crude model had the highest PRCAUC (0.839) when using the balanced training set.
Conclusion:
All models trained on the balanced training set performed similarly. Logistic regression models had higher accuracy, precision and recall. Logistic regression, random forest and gradient-boosted trees hyperparameter tuned models had a PRCAUC ⩾ 0.8. All models had an ROCAUC ⩾ 0.5. Including both disproportionality analysis results and additional case report information in models resulted in higher performance evaluation metrics than disproportionality analysis alone.
Plain language summary
Background:
The Food and Drug Administration (FDA) adverse event reporting system (FAERS) is a database that contains adverse event reports, medication error reports, and product quality complaints. The FDA uses statistical methods to identify potentially harmful drug-adverse event combinations, also known as signals, within FAERS. This study compared several different methods to identify harmful drug-related events from adverse event reports in FAERS. The performance of each method was compared to see which method worked best.
Methods:
Logistic regression-based signal detection methods have demonstrated superior performance due to their ability to handle variables that can distort the effect of other variables or hide potential associations. The development of other machine learning models is of interest. Machine learning models can define complex relationships between risk factors and outcomes. Our objective was to compare the signal detection performance of multiple models.
Results:
Our study show that two models (logistic regression and random forest) were better at identifying true signals than other models.
Conclusions:
The four methods have differing abilities on how well they identify adverse drug events in voluntarily reported surveillance data. Including both results of searches for unexpected associations between drugs and adverse events and additional case report information in models resulted in identifying more true signals than unexpected association results alone. The models can be replicated or modified for use by drug safety programs.
Introduction
Disproportionality algorithms quantify the unexpectedness of specific drug-event combination pairs (DECs) in a spontaneous adverse drug event (ADE) report database. Unexpectedness suggests the number of reports for a specific DEC is higher than expected and can provide a signal that warrants clinical review and further investigation. 1 However, the algorithms give the same weight to information from all reports in a database, which may result in signals being masked or false positives being flagged as signals. 2 Multiple groups have found that logistic regression (LR)-based signal detection algorithms are superior to disproportionality analysis due to their ability to account for potential confounders and masking factors.2–6
Despite the demonstrated advantages of LR, it does have limitations. First, interaction terms need to be programmed into the LR model to assess for interacting independent variables. Second, LR does not work well with large databases and outlier observations. Third, LR does not handle complex, nonlinear relationships; or correlated independent variables.7–9
Machine learning and deep learning algorithms are able to define complex relationships between risk factors and outcomes. 10 They have mostly been used to help predict ADEs during drug discovery and preclinical trials. Wang et al. used a deep neural network to detect potential ADEs in new drugs. Study results showed the overall performance of the model had a mean average precision of 0.523 and the area under the curve (AUC) was 0.844 for ADE prediction. 11 Ietswaart et al. developed random forest (RF) models to predict ADEs from in vitro pharmacological profiles using in vitro pharmacology assay data from Novartis and ADE data from Food and Drug Administration adverse event reporting system (FAERS). The models had high accuracy and precision ranging between 0.9 and 1, recall of 0.6 and an AUC of 0.8. 12
Two studies have used machine learning algorithms with FAERS data for pharmacovigilance purposes.13,14 Chen et al. developed LR, support vector machine (SVM), RF, and gradient-boosted tree (GBT) models to predict hospitalizations and deaths based on patient demographics and drugs. The accuracy was between 73% and 75% for predicting hospitalization and 68% and 76% for predicting deaths. The recall (90–99%) and F1 score (83–84%) were also higher for models predicting hospitalizations, and the precision was similar. Part of the difference in performance could be due to the relatively low number of deaths in the data. 13 Pham et al. compared the accuracy of multiple methods to detect DEC associations. The methods included frequentist and Bayesian disproportionality analysis, multivariate methods, and machine learning algorithms. Most AUC values were greater than 0.65, with Bayesian confidence propagation neural network having the highest AUC (0.693) and RF the lowest (0.521). 14
The objective of this study was to compare the performance of LR, GBT, RF, and SVM for signal detection utilizing data from FAERS. Twelve features were used for model development. Accuracy, precision, F1 score, recall, the receiver operating characteristic AUC (ROCAUC), and the precision-recall curve AUC (PRCAUC) were used to compare the performance of the models against the testing set portion of the reference set.
Methods
Data sources
A cross-sectional study was conducted. The publicly available FAERS quarterly data extract files from 1 October 2017, through 31 December 2020, were downloaded. The Demographic, Drug, Outcome, Reaction, Therapy and Indication files were used. The Demographic, Drug, Outcome and Reaction files were linked on the primary ID (PRIMARYID). The Drug, Therapy and Indication files were linked on both the primary ID (PRIMARYID) and drug sequence (DRUG_SEQ) variables. 15 Deduplication was performed by selecting the highest PRIMARYID for each report. Only the primary suspect drug from a report (ROLE_COD = PS) was included in the analysis. Secondary suspect, concomitant or interacting drugs were excluded in efforts to reduce noise in the data due to the uncertainty of the association between the drug and the ADE.12,16,17 All ADEs listed on a report were included, and ADE terms were standardized using the Medical Dictionary for Regulatory Activities (MedDRA) preferred terms listed in the Reaction file. Reports missing a primary suspect drug or an ADE were excluded. Generic names were used to identify drugs, and all ADE and drug names were converted to upper case text for standardization.
Variables
Table 1 includes the features included in this analysis. We developed a report completeness measure based on work by The Uppsala Monitoring Centre and the Pharmacovigilance Programme of India to quantify the amount of information available in an ADE report.18,19 The features used are displayed in Table 2. Time-to-onset is defined as the time from treatment initiation to the suspected ADE. The completeness of report score starts at 1 and for every missing variable the corresponding penalty factor (Table 2) is applied. The score is calculated using equation (1),

where
Description of features from FAERS included in models. 15
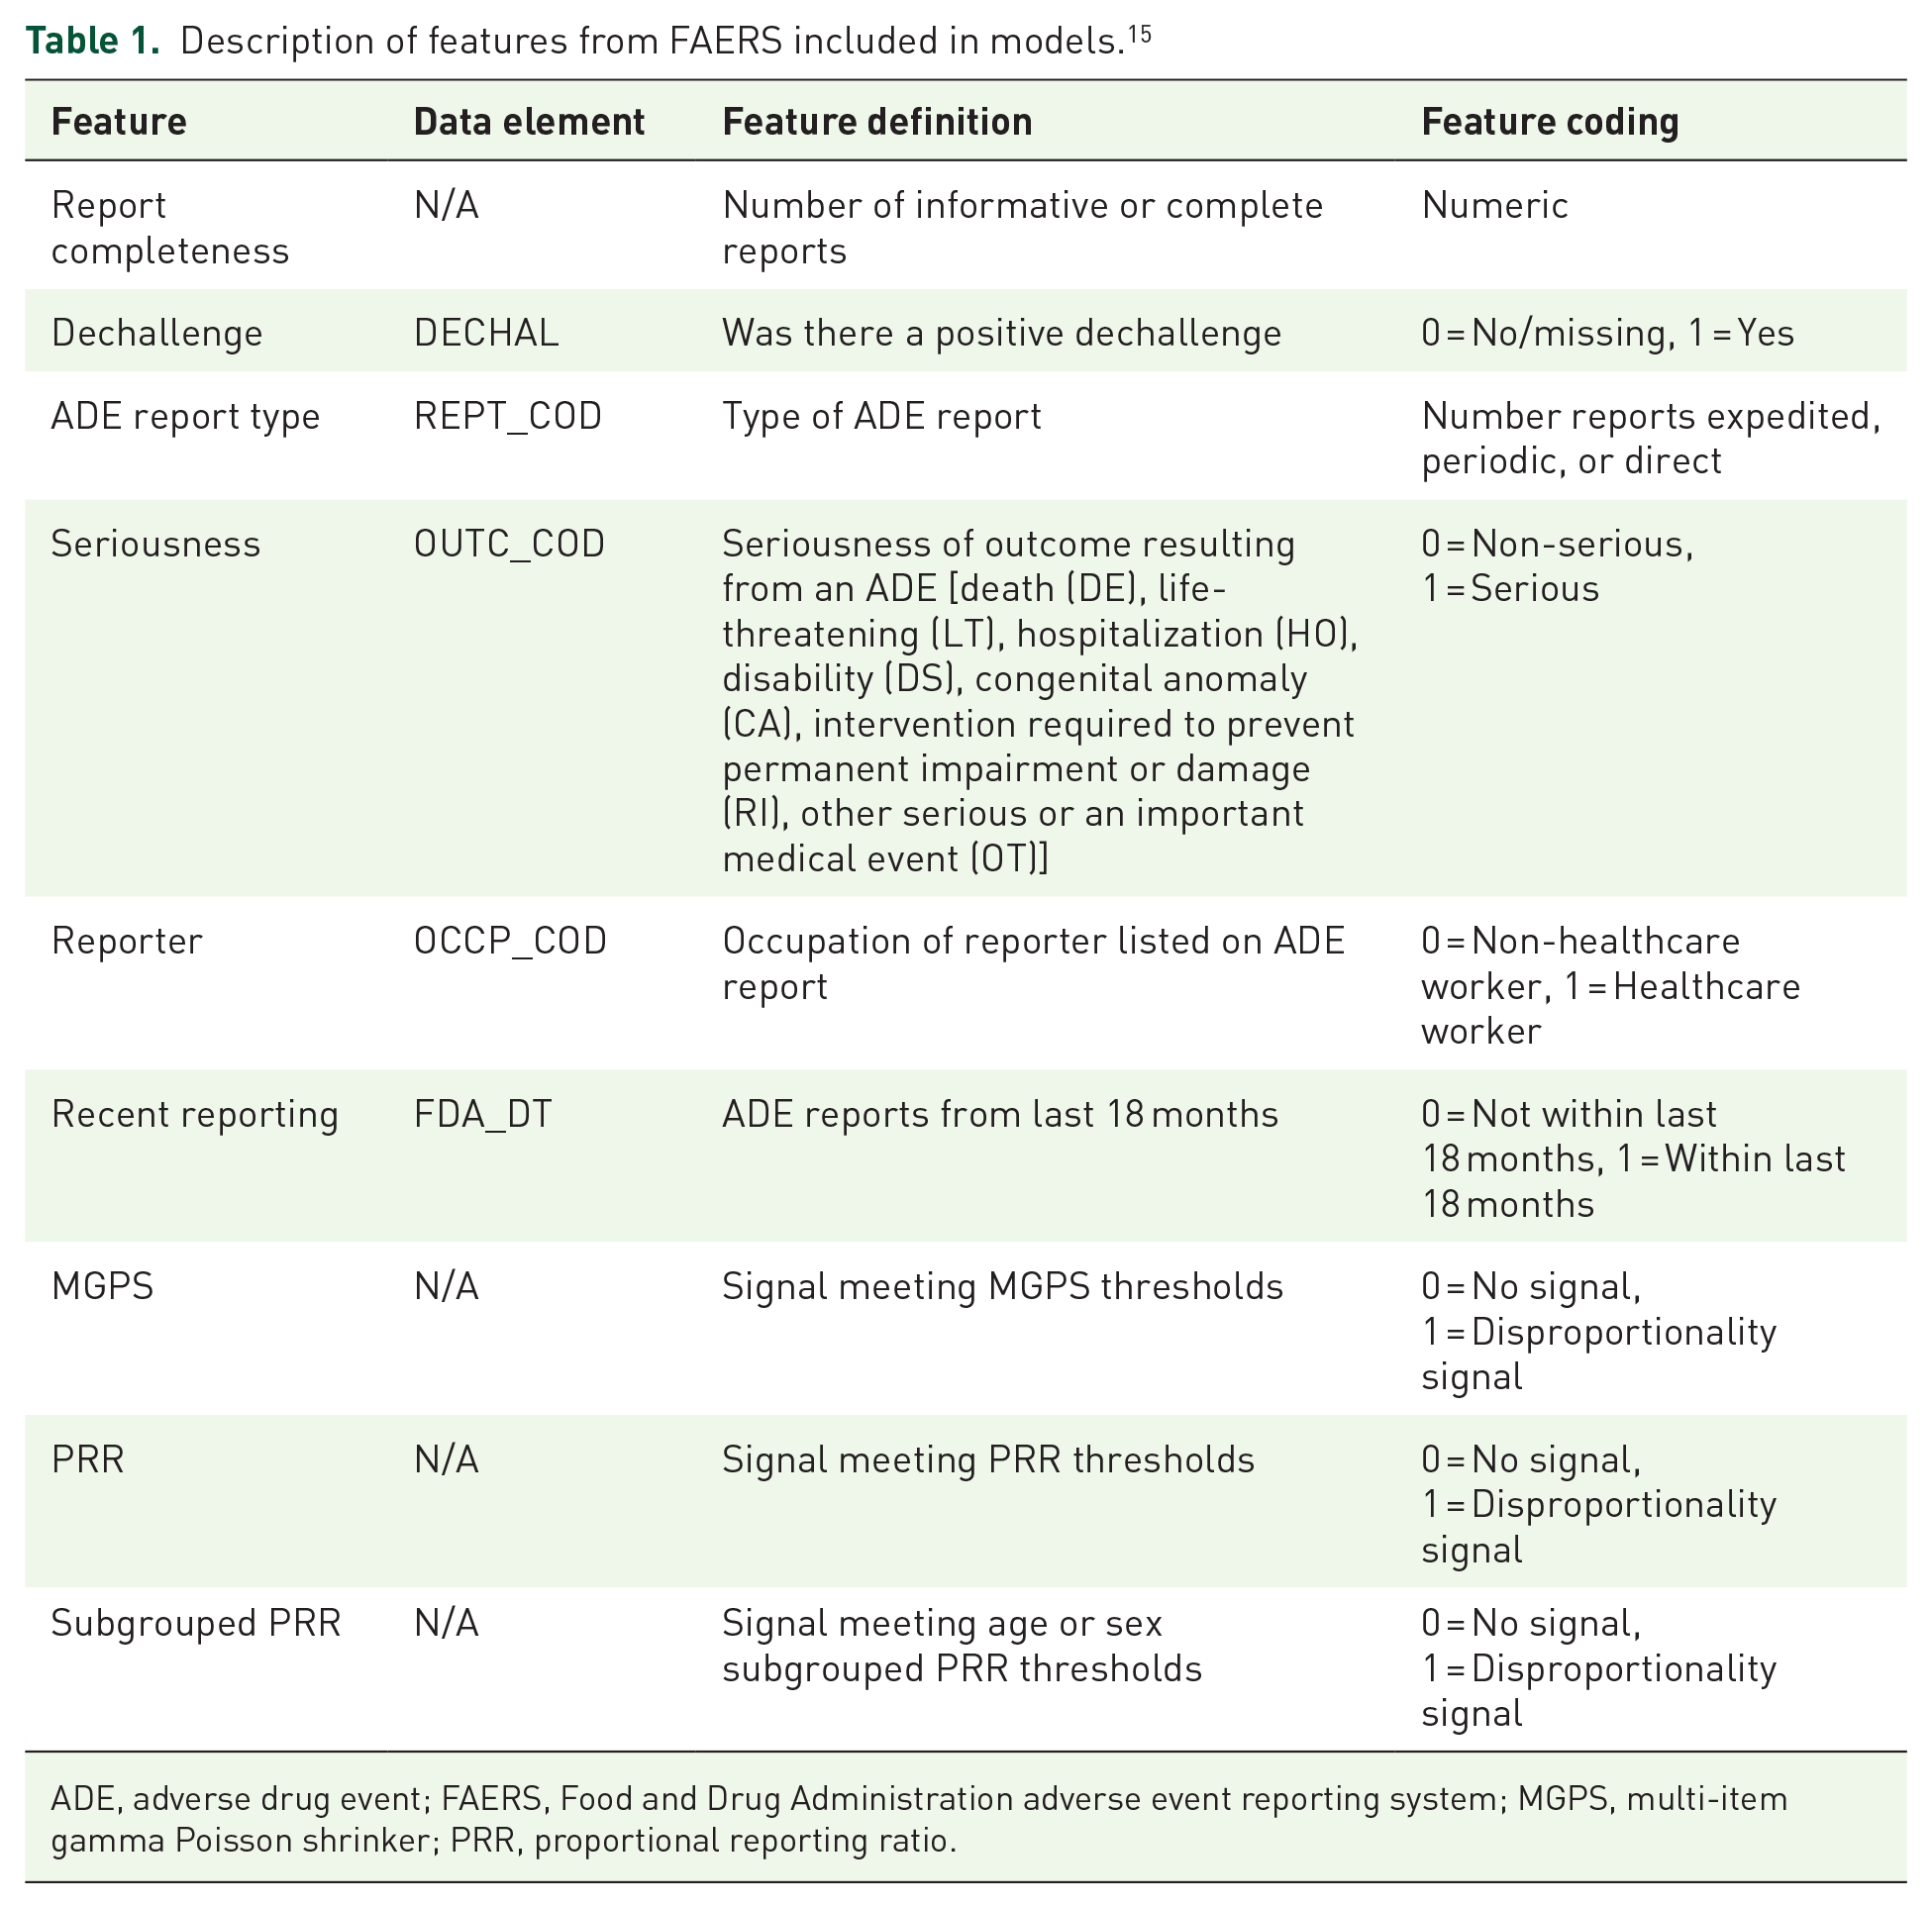
ADE, adverse drug event; FAERS, Food and Drug Administration adverse event reporting system; MGPS, multi-item gamma Poisson shrinker; PRR, proportional reporting ratio.
Description of features included in the report completeness score.

ADE, adverse drug event.
Reference data set
A reference set of positive and negative controls was developed to evaluate and compare multiple SDAs as part of a larger study examining pharmacovigilance for direct-acting antivirals used for the treatment of chronic hepatitis C virus infection. 20 The reference set focused on the following ADEs: dysglycaemia, hepatic decompensation and hepatic failure, and angioedema.21–23 A reference set was developed to evaluate the ability of models to detect these ADEs. It included nine MedDRA preferred terms: angioedema, ascites, encephalopathy, hepatic encephalopathy, hyperglycaemia, hypoglycaemia, jaundice, oesophageal varices haemorrhage and varices oesophageal. Positive controls are known associated DECs.2,24,25 Negative controls included drugs that do not include one of the nine preferred terms and no other MedDRA preferred term from the same MedDRA high-level term listed in their prescribing information.5,24 A control variable was attached to each DEC to classify it as either a positive control (1) or negative control (0). The reference set included 155 DECs from 60 drugs with 110 DECs for positive controls and 45 DECs for negative controls (Supplemental Material 1). 20
Statistical analysis
Disproportionality analysis
Disproportionality analysis was conducted utilizing PRR, PRR subgrouped by age or sex, and MGPS. For PRR analyses, a signal was defined by the accepted thresholds of PRR ⩾ 2, number of reports ⩾3 and a χ2 ⩾ 4. 26 A subgrouped PRR analysis was conducted for each age and sex, and a signal for a DEC was counted if it met the signal criteria within any strata. For the MGPS analysis, a signal was defined as a DEC with a lower 95% confidence interval limit ⩾2.27,28 Proportional reporting ratio and MGPS analyses represented frequentist and Bayesian disproportionality analyses, respectively, in this study. 29 All DECs entered into FAERS during the study period were included in the disproportionality analyses. Disproportionality analyses were performed using R (R Core Team, v4.0.2).
Models
The dataset was split into training (80%) and testing (20%) sets. The outcome is imbalanced, containing 72.2% positive controls and 27.8% negative controls. To maintain the distribution during model building, the training and testing sets were stratified on the control variable using the stratify parameter in the train_test_split() Python function to ensure both sets have the same distribution as the dataset. This training set will be referred to as the balanced training set.
Due to the outcome imbalance, the Synthetic Minority Oversampling Technique (SMOTE) was also assessed. In SMOTE, the k-nearest neighbours belonging to the minority class are determined for each minority observation. Then a synthetic minority observation at some intermediate point along the line joining x to one of its randomly chosen k-nearest neighbour, xk, is generated.9,30 In this study, the negative controls were the minority class. LR, GBT, RF and SVM models were trained using the balanced and SMOTE training sets.
Models were optimized by fine-tuning the algorithm hyperparameters, including the regularization parameters of LR and SVM; and the number of trees, features to consider, tree depth and samples for GBT and RF. A randomized search on hyperparameters was conducted using RandomizedSearchCV() utilizing a repeated (n = 3), stratified fivefold cross-validation. Lasso regression was used to identify significant features in the LR model. Feature importance was used to identify the most important features in the GBT and RF models and was computed as the (normalized) total reduction of the Gini impurity caused by that feature. The higher the value the more important the feature. 31 Feature coefficients that are not either equal to or near zero were used to identify the most important features in the SVM model. For each model, both a crude model without hyperparameter tuning or feature selection (crude) and a model with tuned hyperparameters and feature selection (HPT) were run. Machine learning models were built, trained and tested using Python (Python Software Foundation, v3.9.7) via the Spyder IDE (v5.1.5).
Performance evaluation
Accuracy, precision, recall, F1 score, ROCAUC and PRCAUC were used to evaluate and compare the performance of the classification models. These metrics provide important context regarding the ability of the models to correctly identify true positives and true negatives. Both ROCAUC and PRCAUC were calculated to get a more complete assessment and comparison of the models. The PRCAUC is better at evaluating a model’s ability to identify true positives and provides a better estimation of performance in unbalanced datasets.32,33 Recall, precision, ROCAUC and PRCAUC were the primary metrics used for comparing model performance against the testing set portion of the reference set. Performance evaluation was performed using Python (Python Software Foundation, v3.9.7) via the Spyder IDE (v5.1.5). The reporting of this study conforms to the Strengthening the Reporting of Observational Studies in Epidemiology (STROBE) statement (Supplemental Material 2). 34
Results
After the FAERS quarterly data extract files were cleaned and merged, the data set contained 17,702,846 reported DECs from 5,497,137 ADE reports. Next, in order to identify the positive and negative control DECs in FAERS, the FAERS data was merged with the reference set by DEC to attach a control label for classification. This resulted in 10,282 reported DECs from 10,079 ADE reports being labelled either a positive control (1) or a negative control (0). Four DECs (fluoxetine-jaundice, fluoxetine-oesophageal varices haemorrhage, gabapentin-varices oesophageal and metformin-oesophageal varices haemorrhage) contained in the reference set were not in the downloaded FAERS data. Finally, after aggregating the 10,282 DECs there were 109 positive control DECs and 42 negative control DECs.
Feature inclusion and importance
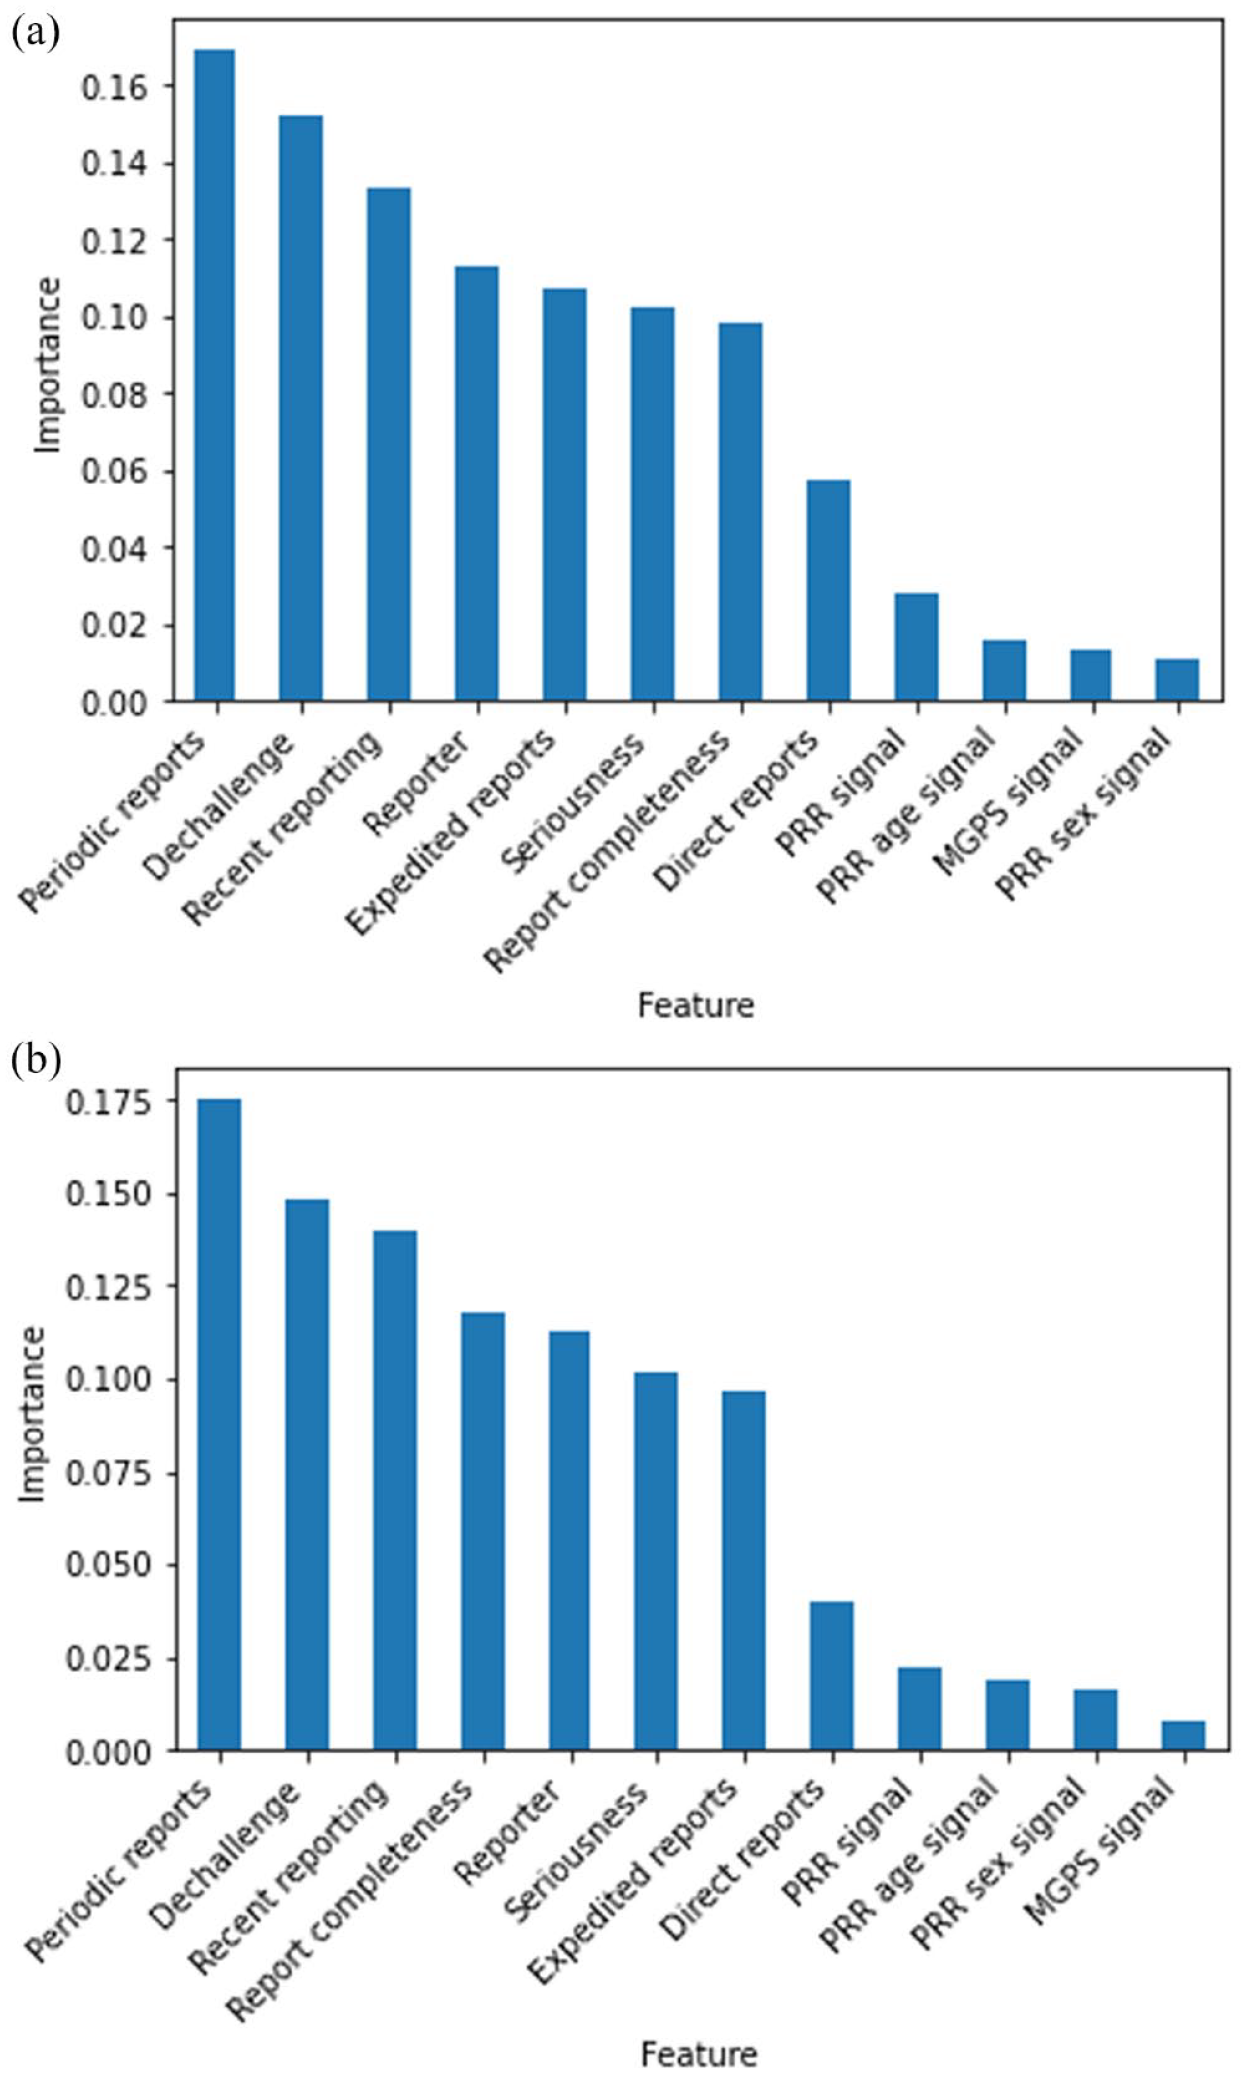
For the LR model trained on the balanced training set, 9 of 12 features were selected by lasso LR for inclusion: dechallenge, number of expedited, periodic and direct reports; report completeness, PRR signal, MGPS signal, PRR age subgrouped signal and PRR sex subgrouped signal. For the LR model trained on the SMOTE training set only two features were selected by lasso LR for inclusion: dechallenge and reporter. The most important features for the GBT and RF models trained on the balanced and SMOTE training sets are in Figure 1(a) and (b) and Figure 2(a) and (b), respectively. All GBT and RF models had the same top seven most important features: number of periodic reports, dechallenge, recent reporting, reporter, number of expedited reports, seriousness and report completeness. The most important features for the SVM models trained on the balanced and SMOTE training sets are in Figure 3(a) and (b), respectively. There were three features (number of direct reports, sex subgrouped PRR signal and age subgrouped PRR signal) that were not important for the SVM model trained on the balanced training set, and only MGPS signal was not an important feature when training on the SMOTE training set.

Feature importance for gradient-boosted tree model trained on the (a) balanced training set and (b) SMOTE training set.
Feature importance for random forest model trained on the (a) balanced training set and (b) SMOTE training set.

Feature importance for support vector machine model trained on the (a) balanced training set and (b) SMOTE training set.
Performance evaluation
The performance evaluation metrics for each of the models are in Table 3. Overall, the GBT crude model trained on the SMOTE training set had the highest ROCAUC (0.657), and the GBT HPT model trained on the balanced training set (0.646) was the second highest. The range of ROCAUC values for models trained with the balanced training set was 0.08 (0.566, 0.646) with the GBT crude model achieving 0.566 and the GBT HPT model achieving 0.646. The range of ROCAUC values for models trained with the SMOTE training set was 0.157 (0.5, 0.657) with the SVM crude model achieving 0.5 and the GBT crude model achieving 0.657.
Performance evaluation metrics for models against test data.

Bolded values are the highest value for each performance metric.
Crude, model without hyperparameter tuning or feature selection; HPT, model with hyperparameter tuning and feature selection; MGPS, multi-item gamma Poisson shrinker; PRR, proportional reporting ratio; SMOTE, Synthetic Minority Oversampling Technique.
This model did not predict any positive control outcomes for the test data.
When examining PRCAUC, the SVM crude model trained on the SMOTE training set had the highest PRCAUC (0.855), and the RF HPT model trained on the SMOTE training set (0.848) was the second highest. It should be noted that the SVM crude model trained on the SMOTE training set did not predict any positive control outcomes. The range of PRCAUC values for models trained with the balanced training set was 0.099 (0.740, 0.839) with the GBT crude model achieving 0.740 and the RF crude model achieving 0.839. The range of PRCAUC values for models trained with the SMOTE training set was 0.07 (0.785, 0.855) with the LR HPT model achieving 0.785 and the SVM crude model achieving 0.855.
The remaining performance evaluation metrics were higher for models trained on the balanced training set. Their accuracy, F1 score, and recall were higher compared to models trained on the SMOTE training set. The precision was higher for the LR and GBT models in the balanced training set, higher for RF in the SMOTE training set, and mixed between the two training sets for SVM (Table 3).
When focusing on models trained on the balanced training set, the LR, RF, and GBT HPT models had a PRCAUC ⩾ 0.8. All models had an ROCAUC ⩾ 0.5. This is represented in the PRC and ROC curves (Figures 4 and 5). The HPT models had higher ROCAUC values in the LR, GBT, and SVM models. The LR model had equivalent or higher performance evaluation metrics compared to the other three models. It had the highest accuracy, precision, and recall metrics.
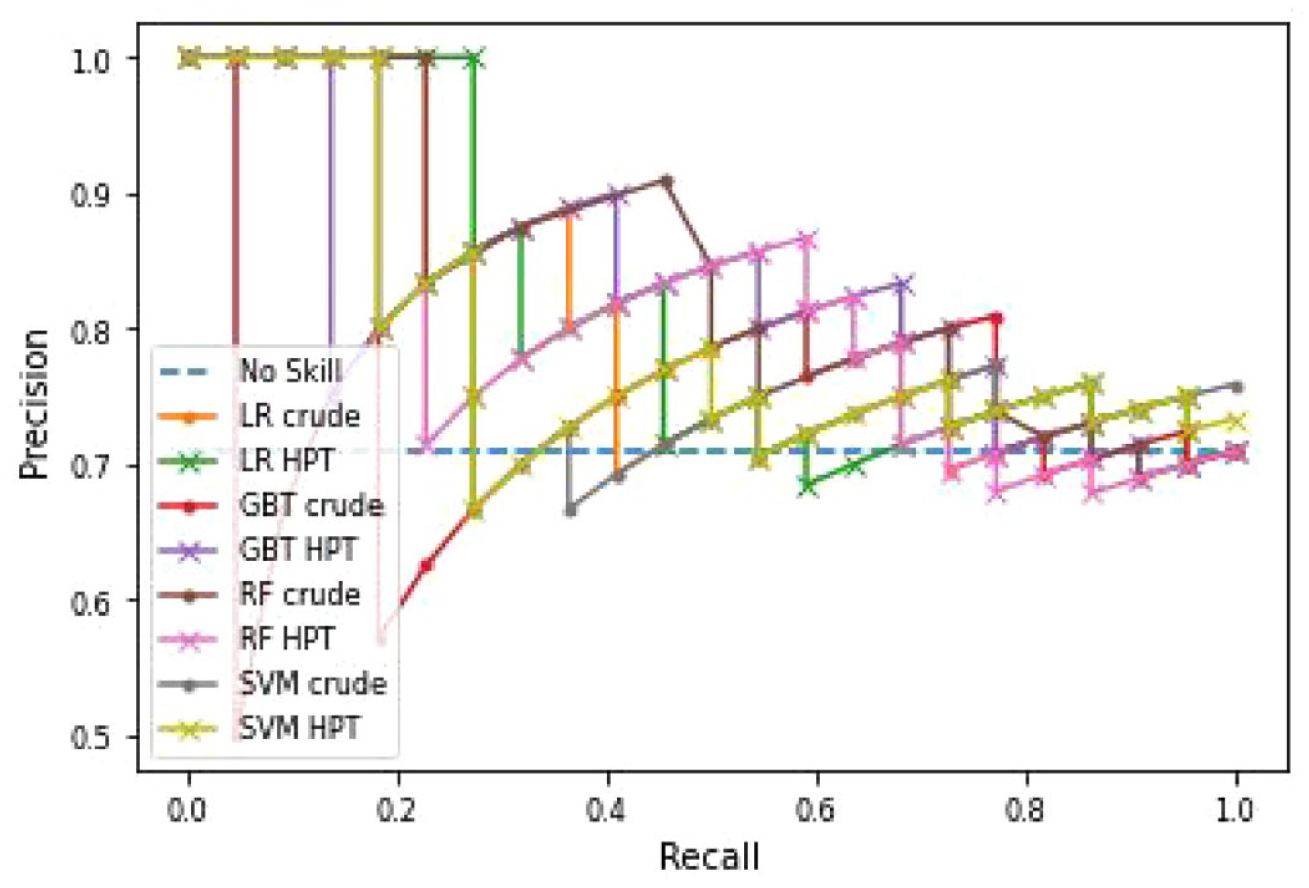
Precision-recall curve comparing the performance of the LR, GBTs, RF and SVM algorithms.

Receiver operating characteristic curve comparing the performance of the LR, GBTs, RF and SVM algorithms.
Discussion
Our study evaluated the performance of LR, GBT, RF and SVM against a reference set and included 12 features in the models (Table 1). All models performed similarly (Table 3). In general, models trained on the balanced training set had higher evaluation metric values than models trained on the SMOTE training set. Possible reasons for this include that SMOTE can only generate new synthetic minority class observations within the space of the existing minority class observations, it will not improve the representation of the minority class outside the boundary of the existing observations, and it could potentially create synthetic observations in locations where majority class observations are located.9,35,36 In this study, the reference set had 109 positive controls (72.2%) and 42 negative controls (27.8%), and this classifies as low imbalanced data. 35 Depending on the location of the new synthetic negative control observations, the models may have a more difficult time correctly distinguishing between the classes, leading to the decline in the metrics seen in the results.
Our models go beyond standard disproportionality analysis for signal detection by incorporating the amount and type of information in individual case reports in addition to disproportionality analysis. Table 3 includes the performance evaluation metrics for the disproportionality analyses. The models have higher recall and ROCAUC values; and comparable precision.
A precision-recall curve plot shows the relationship between precision and recall, of which precision is particularly important because it measures the fraction of correct predictions among the positive predictions. They provide a visual summary of the susceptibility of models to imbalanced datasets. 32 The high PRCAUC values indicate the models perform well at detecting true positives. In addition, the ROCAUC values are all greater than 0.5, which indicates the performance is better than chance. It has been shown that there is a connection between ROCAUC and PRCAUC since both include the recall measure and that if a model has a strong precision-recall curve, it will also have a strong ROC curve. 37
An error analysis using decision trees was conducted to identify how to improve classification (Supplemental Materials 3 and 4).38,39 In general, all models were affected by two features, recent reporting and ADE report type. The models poorly classified reports submitted greater than 18 months from the end of the study period and all ADE report types. The ADE report type feature quantified the number of expedited, periodic and direct reports for a DEC. An individual DEC could have reports in each category, which could complicate classification. Future research could examine using more recent reports only and removing the ADE report type feature.
This study builds off prior research of using LR and machine learning algorithms for signal detection.2–6 ADE report type was structured as the number of expedited, periodic or direct reports and subgrouped PRR analyses were conducted for age and sex. In total, 12 features were used in model development. Prior studies investigated the use of age, sex, report year and ADE time-to-onset as predictors.2–5 Our study included recent reporting as a feature, but age, sex and ADE time-to-onset were accounted for in the report completeness feature. Our LR model did not find recent reporting as a significant feature. However, it was an important feature in GBT, RF and SVM models. Caster et al. 5 suggested dechallenge should be investigated further as it was included in two of their cross-validation models. In this study, the dechallenge feature represented if there was a positive dechallenge. Dechallenge had the largest coefficient in the LR model, the second highest importance in the RF and SVM models, and fourth highest importance in the GBT model. Scholl et al. 6 found percentage of reports from healthcare professionals to be a strong predictor of the presence of a unique DEC association in the Summary of Product Characteristics in their LR model. Our reporter feature represented the number of reports from a healthcare worker. It was not a significant feature in our LR model, but it was one of the most important features in the GBT, RF and SVM models.
Limitations
Our analysis has limitations. One, ADE reports in FAERS are likely underreported and subject to reporting biases such as dilution bias, indication bias, co-prescription bias and competition bias.29,40,41 It is important to understand the variety of biases involved in ADE reporting in order to properly interpret the data. Two, the ADE reports in FAERS are subject to issues of data quality and consistency due to a lack of required, standardized fields; missing data, and potential duplicate reports. Three, ADE reports submitted to FDA do not undergo extensive validation or verification, and therefore, a causal relationship cannot be established between a product and the reactions listed in a report. Four, the lack of a gold standard for evaluating signal detection algorithm performance is an issue. We developed a reference set based on ADEs that describe dysglycaemia, hepatic decompensation and hepatic failure; and angioedema. It is imbalanced with more positive controls than negative controls, which can influence the calculations of recall, precision and PRCAUC (Table 3). Lastly, results from this study are not generalizable to other spontaneous report databases, different subgrouping variables or use of an alternative reference set. It is possible that changing one or multiple of these aspects may produce different results. However, our results do provide examples of models and features, in particular dechallenge, that can be considered in future research. Future research examining different machine learning models and data sets would be helpful to expand the generalizability of our findings.
Conclusion
This study compared the performance of LR, GBT, RF and SVM for signal detection utilizing data from FAERS. LR, RF and the GBT hyperparameter tuned models had a PRCAUC ⩾ 0.8, and all models had ROCAUC values >0.5. The LR models had higher accuracy, precision and recall. Incorporating additional information from case reports and the disproportionality analysis results into the models resulted in higher performance evaluation metrics than disproportionality analysis alone. The models can be replicated or modified for use by pharmacovigilance programs.
Supplemental Material
sj-docx-1-taw-10.1177_20420986231219472 – Supplemental material for Evaluation of four machine learning models for signal detection
Supplemental material, sj-docx-1-taw-10.1177_20420986231219472 for Evaluation of four machine learning models for signal detection by Daniel G. Dauner, Eleazar Leal, Terrence J. Adam, Rui Zhang and Joel F. Farley in Therapeutic Advances in Drug Safety
Supplemental Material
sj-docx-2-taw-10.1177_20420986231219472 – Supplemental material for Evaluation of four machine learning models for signal detection
Supplemental material, sj-docx-2-taw-10.1177_20420986231219472 for Evaluation of four machine learning models for signal detection by Daniel G. Dauner, Eleazar Leal, Terrence J. Adam, Rui Zhang and Joel F. Farley in Therapeutic Advances in Drug Safety
Supplemental Material
sj-docx-3-taw-10.1177_20420986231219472 – Supplemental material for Evaluation of four machine learning models for signal detection
Supplemental material, sj-docx-3-taw-10.1177_20420986231219472 for Evaluation of four machine learning models for signal detection by Daniel G. Dauner, Eleazar Leal, Terrence J. Adam, Rui Zhang and Joel F. Farley in Therapeutic Advances in Drug Safety
Supplemental Material
sj-docx-4-taw-10.1177_20420986231219472 – Supplemental material for Evaluation of four machine learning models for signal detection
Supplemental material, sj-docx-4-taw-10.1177_20420986231219472 for Evaluation of four machine learning models for signal detection by Daniel G. Dauner, Eleazar Leal, Terrence J. Adam, Rui Zhang and Joel F. Farley in Therapeutic Advances in Drug Safety
Footnotes
Acknowledgements
We thank Viviene Heitlage, PharmD, BCPS for conducting the second independent review of the prescribing information for the negative controls. This research was presented as a poster at the International Society for Pharmacoepidemiology Mid-Year Meeting in Reykjavik, Iceland from April 23-25, 2023.
Declarations
Supplemental material
Supplemental material for this article is available online.
References
Supplementary Material
Please find the following supplemental material available below.
For Open Access articles published under a Creative Commons License, all supplemental material carries the same license as the article it is associated with.
For non-Open Access articles published, all supplemental material carries a non-exclusive license, and permission requests for re-use of supplemental material or any part of supplemental material shall be sent directly to the copyright owner as specified in the copyright notice associated with the article.