
Abstract
Background:
Type 2 diabetes mellitus (T2DM) poses a growing global health challenge, particularly among individuals aged 55 years and above, placing significant pressure on healthcare systems.
Objectives:
This study aims to assess long-term trends in T2DM burden and its risk factors in this demographic from 1990 to 2021.
Design:
We conducted a retrospective analysis of T2DM based on the latest 2021 Global Burden of Disease (GBD) database.
Methods:
Utilizing data from the 2021 GBD Study, we analyzed T2DM incidence, prevalence, and disability-adjusted life years (DALYs) among individuals aged ⩾55 years, stratified by sex and age group. An autoregressive integrated moving average model was applied to forecast trends for 2022–2036.
Results:
In 2021, there were 9,179,347 (95% uncertainty interval (UI), 7,905,452–10,626,325) T2DM cases among those aged 55 years and above. From 1990 to 2021, global incidence increased from 409.06 (95% UI, 349.86–477.48) to 617.73 (95% UI, 532.00–715.10) per 100,000 population; diabetes-related mortality rose from 81.55 (95% UI, 76.57–85.44) to 96.19 (95% UI, 88.62–102.11) per 100,000, and DALYs climbed from 2562.71 (95% UI, 2293.81–2926.77) to 3552.41 (95% UI, 3041.94–4200.97) per 100,000. The highest mortality increase was in low-middle sociodemographic index (SDI) regions, while high SDI regions saw declines. Eastern Europe reported the highest incidence rate among 21 regions, at 1218.43 per 100,000 (95% UI, 1083.02–1370.82). Environmental, occupational, and behavioral risks were major contributors to diabetes-related mortality in this age group. Projections estimate T2DM cases will rise from 9.3 million in 2022 to 12.3 million by 2036.
Conclusion:
The global burden of diabetes in adults aged ⩾55 years has risen substantially from 1990 to 2021. As the population continues to age, urgent action is needed to address this growing disease burden.
Introduction
Type 2 diabetes mellitus (T2DM) is a major global public health challenge. Current estimates indicate that it affects 1 in 9 adults aged 20–79 years, with annual direct healthcare costs exceeding 1 trillion dollars worldwide. 1 This imposes a substantial healthcare and socioeconomic burden. As the global population continues to age, older adults are particularly affected by T2DM. Currently, nearly 50% of all diabetes cases occur in older individuals, with global surveillance data from 2021 indicating that the prevalence of diabetes exceeds 20% in the 65–95 age group.2,3 This demographic not only has a higher prevalence of T2DM but also experiences more severe complications. Older individuals with T2DM face a 2–3-fold increased risk of diabetes-related disability, account for nearly 50% of total diabetes healthcare expenditures in high-income countries despite comprising only 21% of the population with diabetes, and contribute significantly to rising admissions in long-term care facilities due to complications such as diabetic kidney disease and vascular dementia.2,4,5
Factors such as urbanization, sedentary lifestyles, dietary transitions, and increased life expectancy have contributed to the rising global burden of T2DM over the past three decades. 6 While much of the current literature focuses on slowing disease progression in young adults with early-onset T2DM or in midlife populations, the unique challenges faced by older adults—such as polypharmacy, multimorbidity, and inequitable access to healthcare often overlooked.7–10 This oversight is especially concerning given the accelerating pace of population aging: individuals aged ⩾55 years currently comprise 25% of the global population, a proportion projected to increase significantly by 2050. 3 Despite the growing need, few studies have provided a comprehensive and longitudinal analysis of global T2DM trends in individuals aged 55 and above.
Given the increasing burden of T2DM among older adults, understanding its global epidemiology and impact is crucial to inform health policy, resource allocation, and prevention strategies targeting this vulnerable population. Leveraging data from the Global Burden of Disease (GBD) Study 2021, this systematic analysis aims to address these gaps by comprehensively evaluating trends in T2DM among individuals aged ⩾55 years from 1990 to 2021. The findings are intended to inform future strategies for prevention, clinical management, and resource distribution to address the growing prevalence of T2DM in the aging population.
Methods
Study population and data collection
This study utilized data from the GBD 2021 study, publicly accessible via the Global Health Data Exchange and the Institute for Health Metrics and Evaluation (IHME) visualization tools (https://vizhub.healthdata.org/gbd-results/). In GBD 2021, diabetes mellitus prevalence was estimated using DisMod-MR 2.1, which provides stratified estimates by age, sex, year, geographic location, and sociodemographic index (SDI) region.11,12 To assess the burden of T2DM in older adults, we focused on individuals aged 55 years and above, further stratified into seven age groups: 55–59, 60–64, 65–69, 70–74, 75–79, 80–84, and ⩾85 years, for both males and females. We collected data on the number for this population, with corresponding global, regional, and national estimates.
SDI and geographic regions
The SDI, which reflects a country’s or region’s level of development based on socioeconomic conditions, is correlated with disease incidence and mortality rates. 3 It is calculated based on three components: the total fertility rate under age 25, mean years of education in individuals aged 15 and older, and lag-distributed income per capita. 13 For this study, we categorized countries and regions into five SDI levels based on their percentile rankings: low (<20th percentile), low-middle (20th–39th), middle (40th–59th), high-middle (60th–79th), and high (⩾80th percentile). This categorization enabled us to assess the relationship between socioeconomic development and the burden of T2DM in adults aged 55 and older. In addition, countries were grouped into 21 geographic regions according to the GBD classification system, allowing for regional comparisons (Supplemental Method).
Disability-adjusted life years
Disability-adjusted life years (DALYs) quantify the total health burden of T2DM by combining premature mortality and non-fatal outcomes. One DALY represents one lost year of optimal health. 14 In the GBD 2021 framework, DALYs are calculated as the sum of years of life lost (YLLs) due to premature death and years lived with disability (YLDs). YLLs are based on the number of T2DM-related deaths multiplied by the standard life expectancy at death. YLDs are derived from T2DM prevalence and corresponding disability weights (ranging from 0 to 1), which reflect health loss severity and are obtained from population surveys and expert input. 13 This approach is beneficial for chronic diseases like T2DM, which cause long-term disability and reduced quality of life without immediate mortality. 11
Risk factors
This study assessed T2DM-related mortality rates attributable to specific risk factors, including high body mass index, dietary risks, air pollution, tobacco use, low physical activity, and exposure to non-optimal temperatures. Definitions of these risk factors and their relative contributions to diabetes risk were outlined in prior research. 15 This analysis provides insights into the impact of modifiable risk factors on diabetes-related mortality in older populations.
Statistical analysis
This study also predicted the T2DM burden in adults aged 55 and older from 2022 to 2036 using the autoregressive integrated moving average (ARIMA) model. The rationale for selecting ARIMA lies in its flexibility and reliability in capturing temporal dependencies and long-term trends in epidemiological data. 16 The ARIMA model forecasts time series data by combining autoregressive and moving average elements with differencing (d) to stabilize the data. In the ARIMA (p, d, q) model, “p” denotes the number of autoregressive terms, “d” indicates the order of differencing, and “q” represents the number of moving average terms. 17 To enhance model robustness and prevent overfitting, five-fold time-series cross-validation was conducted on historical incidence data. As the GBD database contains high-quality modeled estimates with minimal missing data, interpolation was only applied when necessary using linear methods. In addition, we examined the global prevalence, mortality, and DALYs in 2021, along with the rate changes in these indicators by sex and age groups from 1990 to 2021. The GBD Study incorporates uncertainty intervals (UIs) to account for potential sampling error, non-sampling error, and heterogeneity across datasets. UIs were calculated using the 2.5th and 97.5th percentiles from a 1000-draw distribution for each metric. 12 All statistical analyses were conducted using R Studio (version 4.2.0), with a two-tailed p-value threshold for statistical significance set at p < 0.05.
Results
Global trends
Incidence
In 2021, there were 23,911,321 (95% UI, 22,140,751

Trends in T2DM incidence, mortality, and DALYs among population aged 55 years and over: 1990–2021. (a) Trends in the number of incident cases and incidence rate, (b) trends in number of deaths and mortality rate, and (c) trends in number of DALYs and DALY rate.
Mortality
In 2021, T2DM-related deaths among people aged ⩾55 years totaled 1,429,429 (95% UI, 1,316,887–1,517,402). The mortality rate for this age group was 96.19 per 100,000 (95% UI, 88.62–102.11), with females exhibiting a slightly higher rate of 96.44 per 100,000 (95% UI, 87.86–103.35), compared to 95.92 per 100,000 (95% UI, 88.49–103.45) in males. The highest number of deaths occurred in the 70–74 years age bracket, totaling 234,174 (95% UI, 218,953–248,827), while the highest death rate, 489.77 per 100,000 (95% UI, 365.97–555.40), was seen in those aged 95 years and older. Between 1990 and 2021, the global number of T2DM-related deaths increased by 161.06%, with mortality rates rising across all age groups. Among these, the 85–89 years age group experienced the most rapid increase in mortality rates, with a 0.15 rise (95% UI, 0.15–0.22) over the study period (Figure 1(b) and Supplemental Table 2).
Disability-adjusted life years
From 1990 to 2021, the global diabetes-associated DALYs among individuals aged ⩾55 years increased by 206.79%, rising from 17,206,720 (95% UI, 15,401,206–19,651,058) to 52,788,321 (95% UI, 45,202,803–62,425,759). The DALY rate increased across all age groups within this population, with the largest rise observed in the 60–64-year age group, which experienced a 41% increase (95% UI, 33%–50%). In 2021, the overall DALY rate for individuals aged ⩾55 years was 3552.41 per 100,000 (95% UI, 3041.94–4200.97), with males experiencing a higher rate of 3700.29 per 100,000 (95% UI, 3137.92–4382.48) than females, who had a rate of 3420.88 per 100,000 (95% UI, 2939.71–4062.41). DALY rates increased progressively with age, peaking at 5501.17 per 100,000 (95% UI, 4457.43–6291.80) among those aged 95 years and older (Figure 1(c) and Supplemental Table 3).
SDI regional trend
Incidence
In 2021, the middle SDI region reported the highest number of individuals with T2DM aged ⩾55 years, with a total of 2,900,356 (95% UI, 2,466,608–3,399,732), comprising 1,353,341 males (95% UI, 1,139,375–1,577,076) and 1,547,014 females (95% UI, 1,317,460–1,821,989). Males accounted for 46.66% of the cases, while females accounted for 53.34%. This region also saw the most significant increase in T2DM cases since 1990, with a rise of 275.13%, while the high-middle SDI region experienced the slowest growth at 161.83% (Figure 2(a), Supplemental Table 1).
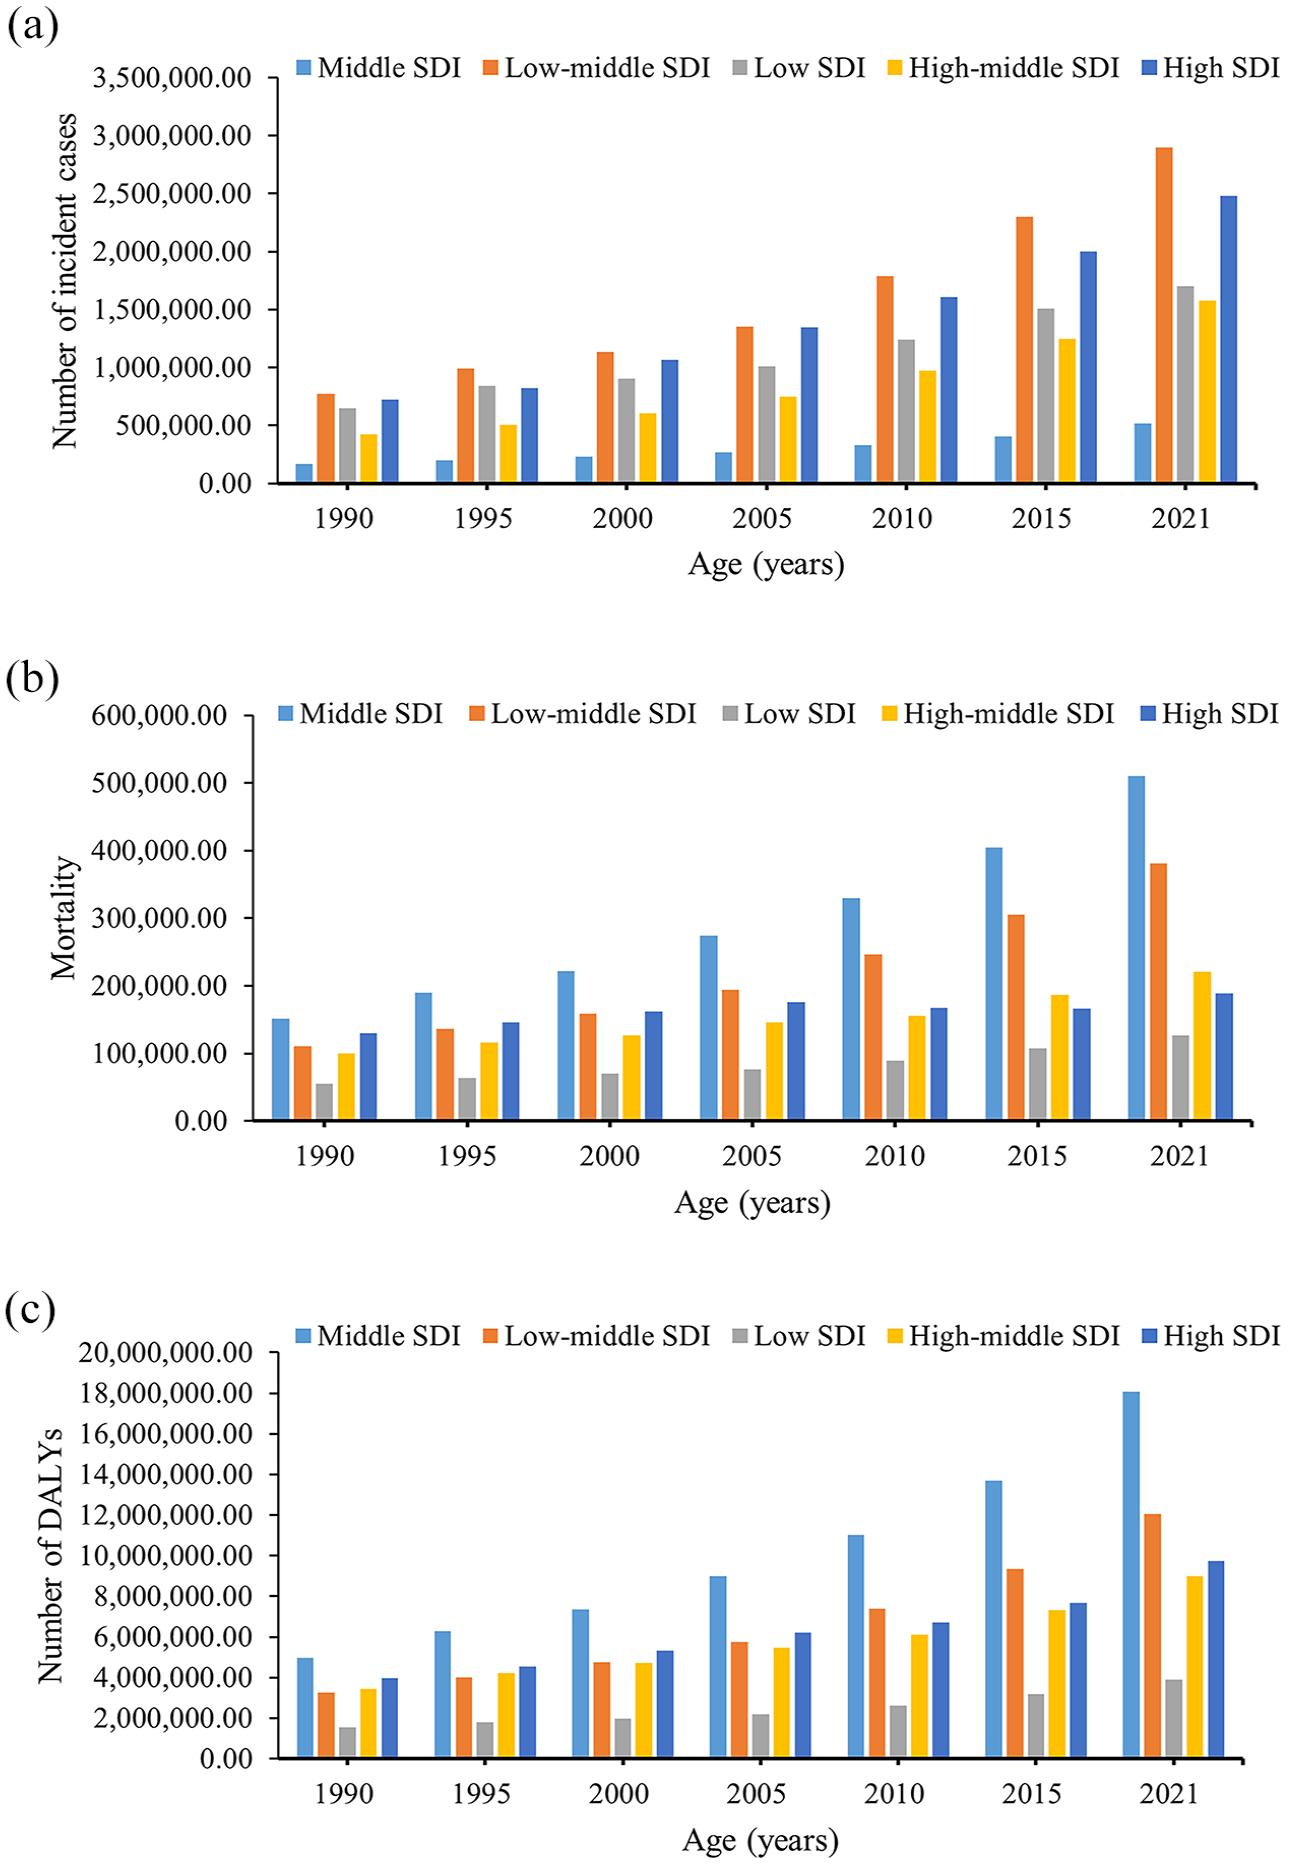
Epidemiologic trends of incidence, mortality, and DALYs in five SDI regions for T2DM among population aged 55 years and over: 1990–2021. (a) Trends in number of incident cases, (b) trends in mortality, and (c) trends in number of DALYs.
The high SDI region had the highest incidence rate at 718.49 per 100,000 population (95% UI, 632.75–813.97) and also exhibited the fastest growth rate, increasing by 0.85 times (95% UI, 0.76–0.94). Conversely, the high-middle SDI region had the lowest incidence rate at 490.99 per 100,000 population (95% UI, 413.43–578.43) and experienced the slowest growth, rising by 0.30 times (95% UI, 0.25–0.36). Age-specific incidence peaks varied across regions: in high, high-middle, low-middle, and low SDI regions, the highest incidence rates were found in the 55–59 age group, with rates of 1109.98 (95% UI, 927.22–1299.95), 709.87 (95% UI, 556.91–870.15), and 760.33 (95% UI, 587.02–946.05), respectively. In the middle SDI region, the highest incidence was observed among individuals aged 60–64 years, with a rate of 773.55 (95% UI, 601.81–950.42), while in the low SDI region, the peak was among those aged 65–69 years, at 727.09 (95% UI, 586.89–879.11) (Figure 3(a) and Supplemental Table 1).

Epidemiologic trends of incidence, mortality, and DALY rates in five SDI regions for T2DM among population aged 55 years and over: 1990–2021. (a) Trends in incidence rate, (b) trends in mortality rate, and (c) trends in DALY rate.
Mortality
The middle SDI region also reported the highest number of T2DM-related deaths, totaling 509,927 (95% UI, 470,069–542,140), with 45.54% of these deaths occurring in males (232,221; 95% UI, 211,305–251,130) and 54.46% in females (277,706; 95% UI, 253,573–298,121). The largest increase in deaths was observed in the low-middle SDI region, where T2DM-related deaths rose by 245.68%. In contrast, the high SDI region experienced the smallest increase in mortality, at 45.58% (Figure 2(b) and Supplemental Table 2). The highest mortality rate was observed in the low-middle SDI region, with a rate of 158.17 per 100,000 population (95% UI, 144.79–171.21), while the high-middle SDI region had the lowest rate at 54.83 per 100,000 (95% UI, 48.30–58.31) (Figure 3(b)). For females, the lowest mortality rate was found in the high SDI region, at 49.38 per 100,000 (95% UI, 40.96–53.73). From 1990 to 2021, mortality rates increased most significantly in the low-middle SDI region, with a rise of 0.45 times (95% UI, 0.28–0.61). Notably, the high SDI region was the only region to show a decrease in mortality, with a reduction of 0.21 times (95% UI, −0.26 to −0.18) (Figure 3(b) and Supplemental Table 2).
Disability-adjusted life years
In terms of DALYs due to T2DM, the middle SDI region recorded the highest number, totaling 18,072,905 (95% UI, 15,692,606–21,222,289) in 2021. Of these, 8,545,663 DALYs (95% UI, 7,345,980–9,996,066) were among males, and 9,527,242 (95% UI, 8,276,802–11,254,239) were among females, representing 47.28% and 52.72%, respectively. The low-middle SDI region experienced the most substantial increase in DALYs, with a 270.84% rise, whereas the high SDI region saw the least increase at 145.53% (Figure 2(c) and Supplemental Table 3). The highest DALY rate was recorded in the low-middle SDI region, at 4997.74 per 100,000 population (95% UI, 4405.08–5720.91), while the lowest was found in the high-middle SDI region, at 2589.09 per 100,000 (95% UI, 2132.80–3136.75) (Figure 3(c)). The greatest relative increase in DALY rates occurred in the low-middle SDI region, rising by 0.55 times (95% UI, 0.42–0.69), while the smallest increase was seen in the low SDI region, with 0.16 times rise (95% UI, 0.04–0.27) (Supplemental Table 3).
Geographic regional trend
Incidence
In 2021, East Asia recorded the highest number of individuals with T2DM aged ⩾55 years, totaling 1,415,500 (95% UI, 1,094,676–1,775,026). Of these, 44.22% were males (625,965; 95% UI, 508,510–713,983) and 55.78% were females (789,535; 95% UI, 612,876–981,609). High-income North America experienced the greatest increase in cases since 1990, with a rise of 460.65%, while Central Europe saw the smallest growth at 68.22% (Supplemental Table 1). Regarding incidence rates, Eastern Europe had the highest rate at 1218.43 per 100,000 (95% UI, 1083.02–1370.82), while East Asia reported the lowest at 360.99 per 100,000 (95% UI, 279.17–452.67). When examining sex-specific trends, Oceania had the highest incidence rate among males at 1293.47 per 100,000 (95% UI, 1109.57–1478.61), while Southern Sub-Saharan Africa recorded the highest incidence rate among females at 1232.08 per 100,000 (95% UI, 1093.51–1390.57) (Figure 4(a)). Over the study period, all regions experienced an increase in incidence rates, with High-income North America showing the largest increase (1.89 times, 95% UI, 1.64–2.17) and Central Latin America the smallest (0.03 times, 95% UI, −0.02 to 0.09) (Supplemental Table 1).
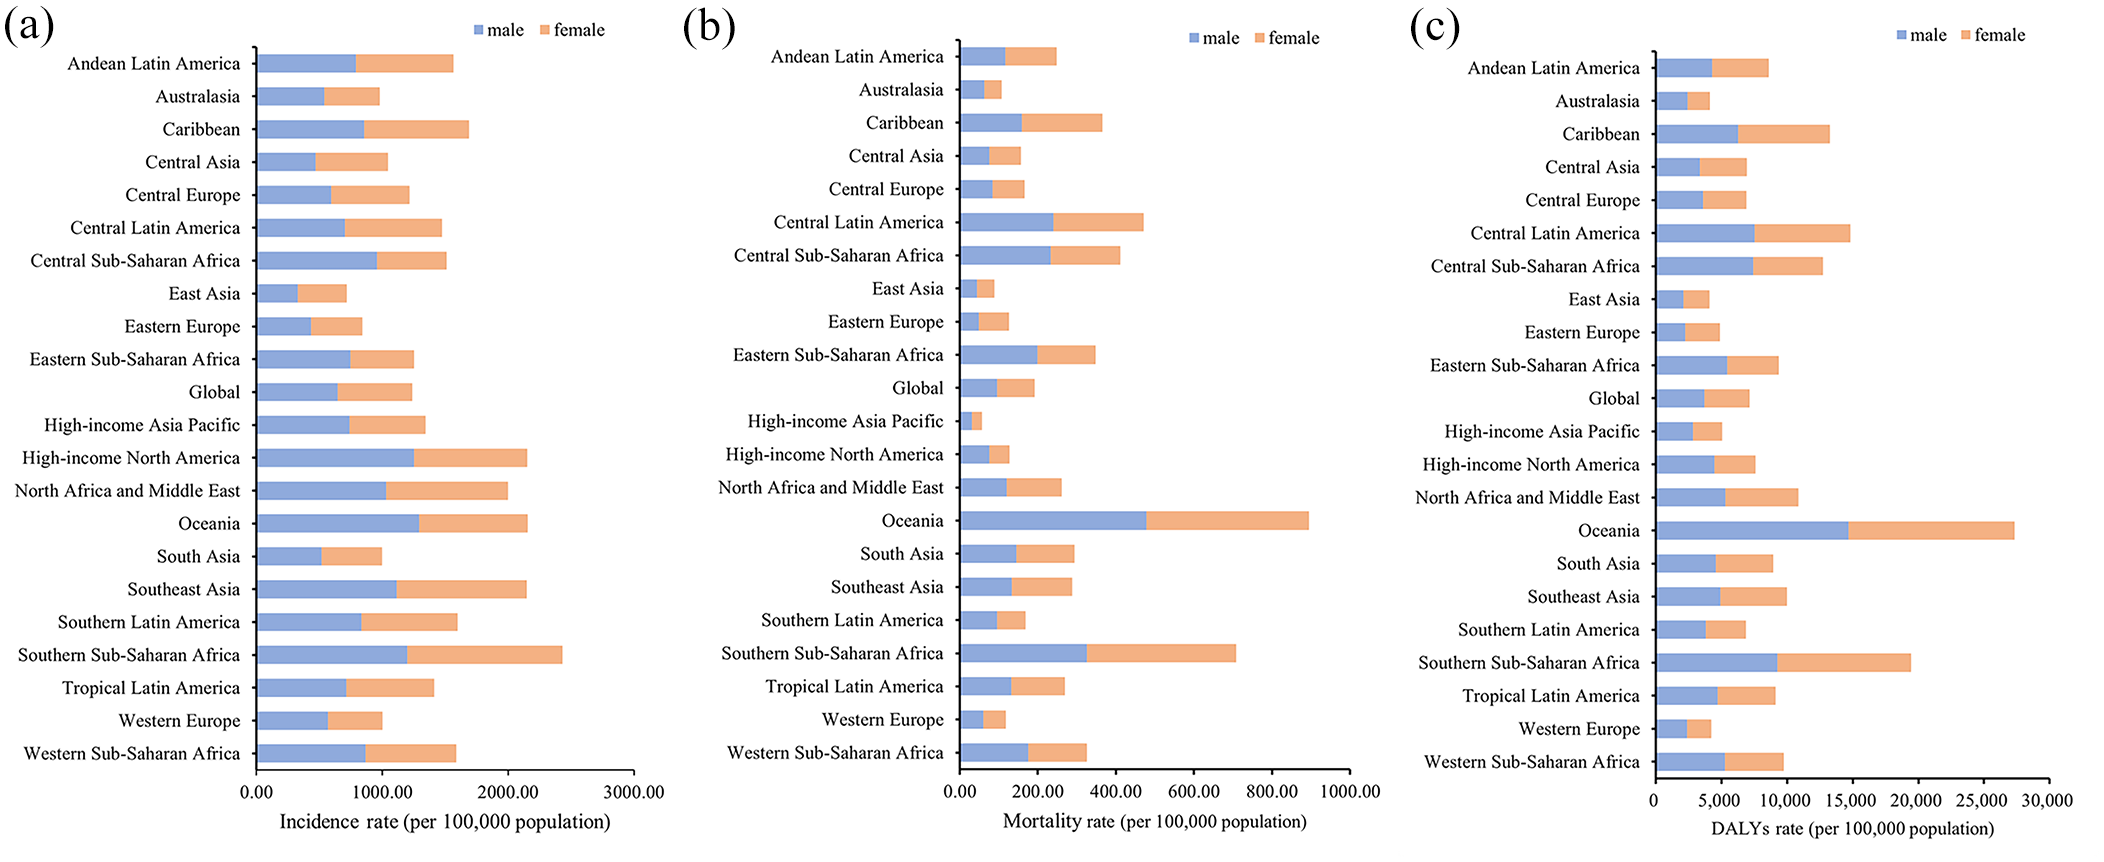
Incidence, mortality, and DALY rate in 21 geographic regions for T2DM among population aged 55 years and over: 2021. (a) Trends in incidence rate, (b) trends in mortality rate, and (c) trends in DALY rate.
Mortality
In 2021, South Asia reported the highest number of T2DM-related deaths among the 21 regions, with a total of 364,267 (95% UI, 324,311–402,118). Eastern Europe saw the most significant rise in deaths, increasing by 346.91%, while Western Europe experienced the smallest increase, at 9.96% (Supplemental Table 2). Oceania had the highest mortality rate, reaching 448.74 per 100,000 (95% UI, 381.62–536.54), in contrast to the lowest rate in High-income Asia Pacific, at 28.20 per 100,000 (95% UI, 23.41–31.33) (Figure 4(b)). Between 1990 and 2021, mortality rates showed considerable regional variation, with Eastern Europe experiencing the largest increase (2.52 times, 95% UI, 2.27–2.78) and High-income Asia Pacific showing the greatest decrease (−0.36 times, 95% UI, −0.43 to −0.29) (Supplemental Table 2).
Disability-adjusted life years
South Asia had the highest number of T2DM-related DALYs in 2021 for those aged 55 and older, totaling 11,116,186 (95% UI, 9,726,338–12,749,493), with a near-equal distribution between males (5,564,578; 95% UI, 4,674,903–6,473,380) and females (5,551,608; 95% UI, 4,803,330–6,471,302). The region with the most significant increase in DALYs since 1990 was Andean Latin America, which rose by 336.66%, while Western Europe saw the smallest increase at 57.79% (Supplemental Table 3). Oceania recorded the highest DALY rate in 2021 at 13,713.70 per 100,000 (95% UI, 11,655.00–16,156.49), while the lowest rate was in Australasia at 2039.79 per 100,000 (95% UI, 1621.25–2543.01). Notably, the lowest male DALY rate was in East Asia, at 2089.34 per 100,000 (95% UI, 1670.69–2657.43) (Figure 4(c)). Between 1990 and 2021, Eastern Europe had the largest increase in DALY rates, rising by 1.39 times (95% UI, 1.28–1.53), whereas Eastern Sub-Saharan Africa was the only region to show a decline, with a decrease of 0.08 times (95% UI, −0.19 to 0.05) (Supplemental Table 3).
National trend
Incidence
In 2021, China, the United States, India, Indonesia, and Brazil reported the highest numbers of T2DM cases among individuals aged ⩾55 years, together accounting for approximately 52.53% of global cases. Among all countries, the United Arab Emirates saw the largest growth in case numbers, increasing by 1732.41%, followed by Qatar (1437.24%) and Bahrain (932.05%). In contrast, Tokelau was the only country to experience a decrease in cases, with a decline of 0.55%. In terms of incidence rates, 145 countries exceeded the global average, while 59 countries fell below it (Supplemental Table 1). The countries with the highest incidence rates were Qatar (2565.27 per 100,000; 95% UI, 2110.10–2957.96), Bahrain (2424.93 per 100,000; 95% UI, 2062.03–2712.15), and Mauritius (2010.60 per 100,000; 95% UI, 1755.03–2243.02). Conversely, Belarus had the lowest incidence rate at 284.85 per 100,000 (95% UI, 239.75–340.24) (Figure 5(a)). Between 1990 and 2021, Timor-Leste experienced the highest relative increase in incidence rate, rising by 2.14 times (95% UI, 1.76–2.49), while Cyprus had the most significant decrease, with a decline of 0.28 times (95% UI, −0.36 to −0.22) (Figure 5(a)).
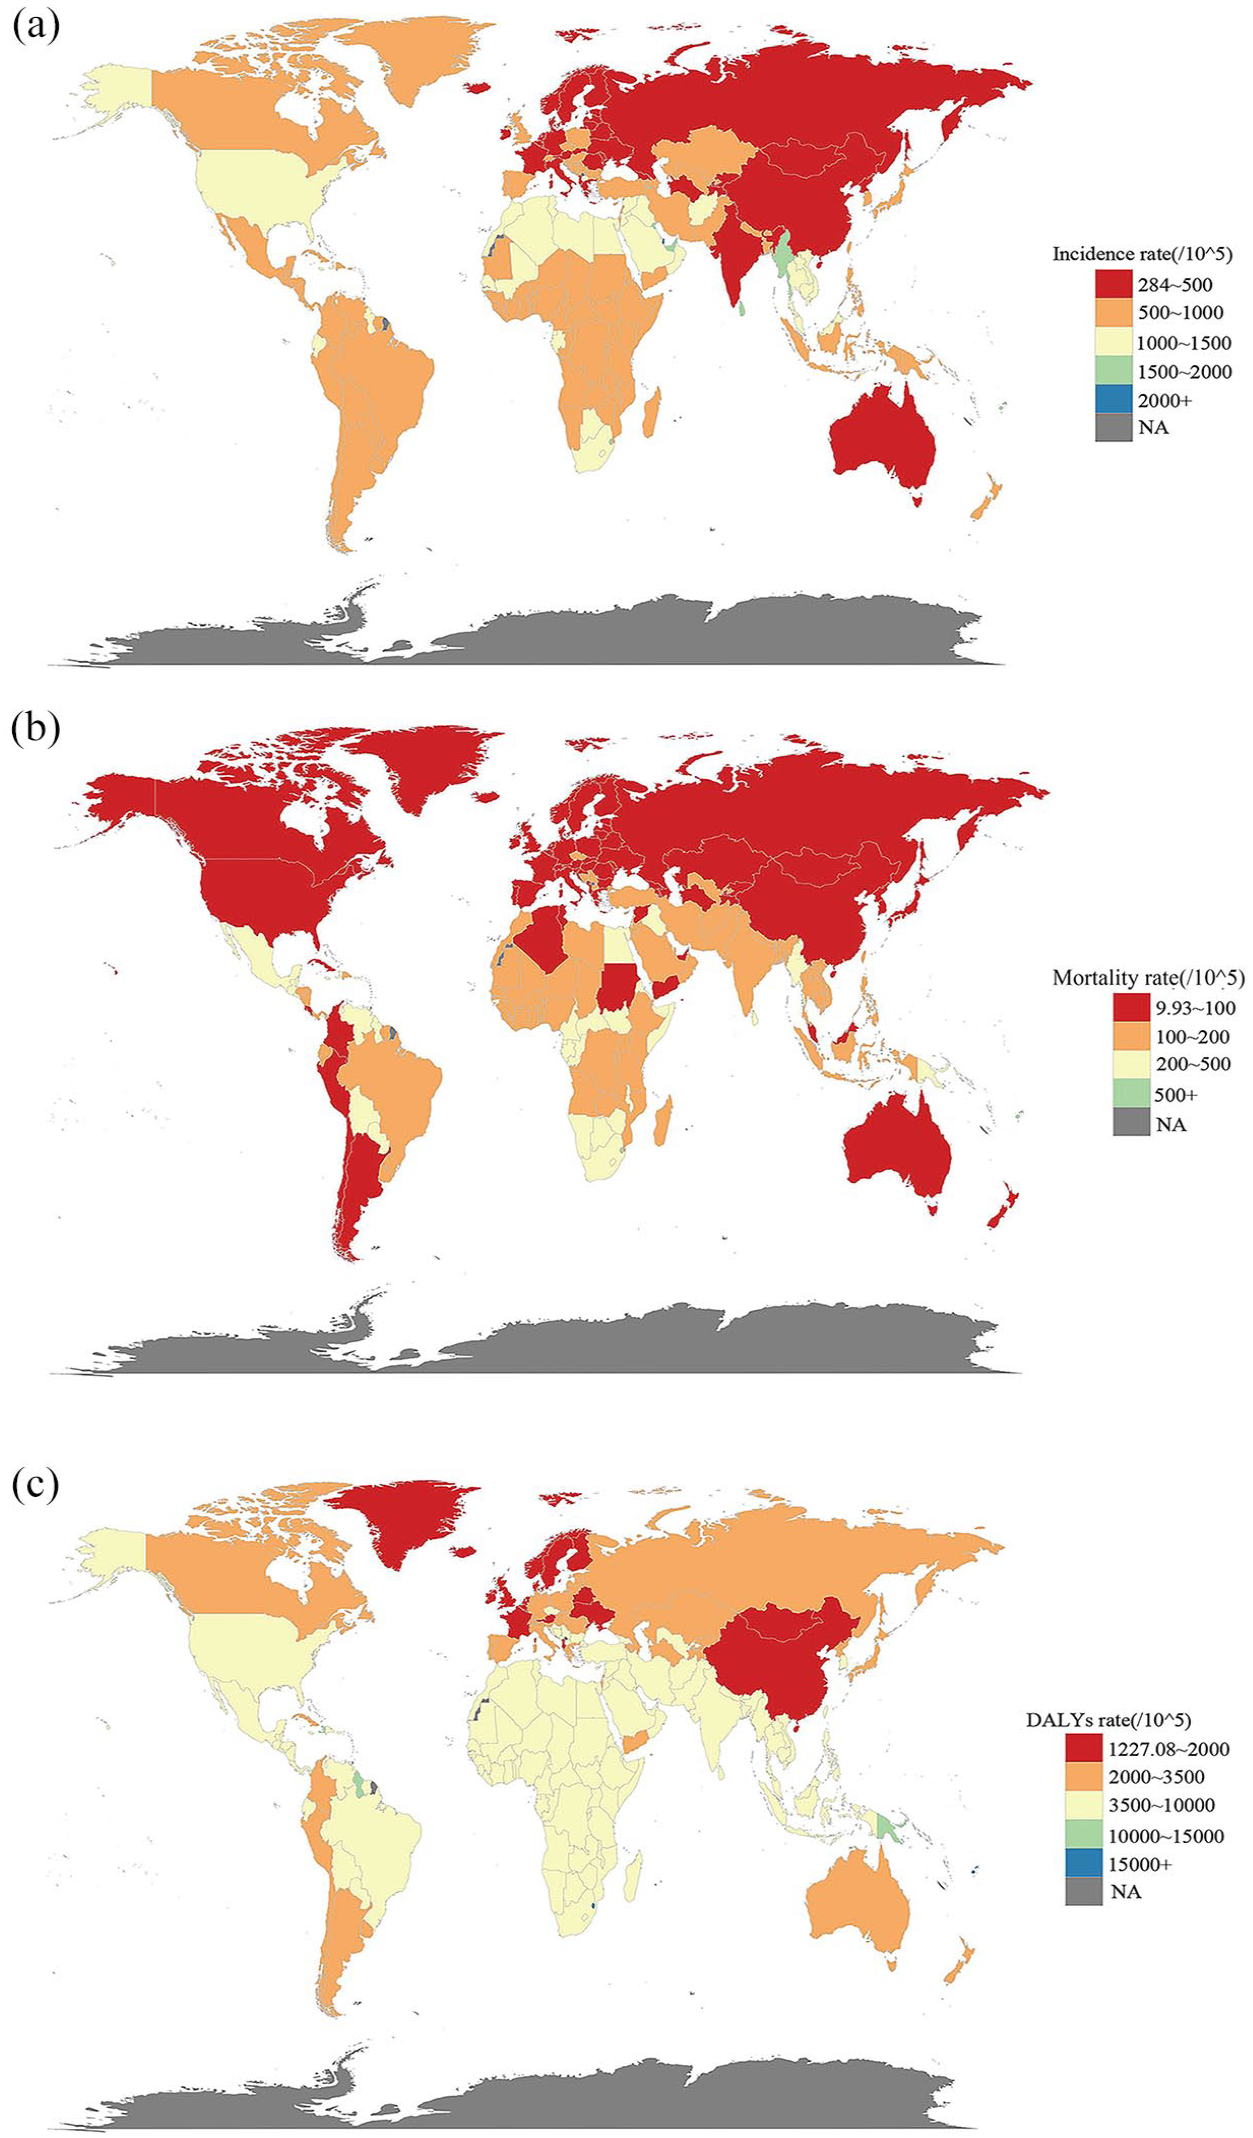
The incidence, mortality, and DALY rate of T2DM in populations aged 55 years and over across 204 countries and territories. (a) Disease burden of incidence rate, (b) disease burden of mortality rate, and (c) disease burden of DALY rate.
Mortality
Among 204 countries, India had the highest number of T2DM-related deaths in 2021 for individuals aged ⩾55 years, with 286,197 fatalities (95% UI, 252,900–320,399). The greatest increase in deaths occurred in Guatemala, where deaths rose by 1163.39%, while Qatar recorded the largest decrease, with an 84.87% reduction. A total of 135 countries had mortality rates above the global average, while 69 countries had rates below it. The highest death rates were observed in Fiji (1096.23 per 100,000; 95% UI, 861.34–1373.92), Kiribati (711.08 per 100,000; 95% UI, 557.26–918.81), and Marshall Islands (637.99 per 100,000; 95% UI, 436.82–928.27). Conversely, the lowest death rates were found in Singapore (9.93 per 100,000; 95% UI, 8.60–10.91), Ukraine (14.63 per 100,000; 95% UI, 10.97–18.54), and Japan (18.43 per 100,000; 95% UI, 14.79–20.46). Over the study period, the countries with the most significant increases in death rates were the Russian Federation (3.50 times; 95% UI, 3.17–3.83), Guatemala (2.97 times; 95% UI, 2.40–3.62), and Estonia (2.19 times; 95% UI, 1.74–2.70). On the other hand, Singapore, Switzerland, and the United Arab Emirates experienced the largest decreases in death rates, with reductions of (0.88 times; 95% UI, −0.90 to −0.87), (0.56 times; 95% UI, −0.60 to −0.52), and (0.55 times; 95% UI, −0.71 to −0.43), respectively (Figure 5(b)).
Disability-adjusted life years
In 2021, India, China, the United States, Mexico, and Brazil reported the highest numbers of DALYs due to T2DM among individuals aged ⩾55 years, contributing to approximately 45.83% of the global total. Kuwait experienced the largest increase in DALYs, rising by 691.05%, while Guatemala had the most substantial decrease, with a reduction of 90.81%. Forty-three countries had DALY rates above the global average, while 69 countries were below it. The countries with the highest DALY rates were Fiji (30,131.07 per 100,000; 95% UI, 24,306.64–37,519.75), the Marshall Islands (21,028.44 per 100,000; 95% UI, 15,992.73–28,513.40), and Kiribati (20,720.29 per 100,000; 95% UI, 16,835.66–26,442.10). In contrast, the lowest DALY rates were seen in Belarus (1227.08 per 100,000; 95% UI, 949.40–1586.02), Monaco (1362.39 per 100,000; 95% UI, 1035.33–1759.67), and Ireland (1408.67 per 100,000; 95% UI, 1086.02–1830.88). From 1990 to 2021, the countries with the most significant increases in DALY rates were Guatemala (2.42 times; 95% UI, 2.03–2.86), Uzbekistan (1.87 times; 95% UI, 1.55–2.23), and the Russian Federation (1.74 times; 95% UI, 1.58–1.94), while the greatest decreases were observed in Cyprus (0.41 times; 95% UI, −0.50 to −0.32), Ethiopia (0.38 times; 95% UI, −0.50 to −0.26), and Singapore (0.32 times; 95% UI, −0.44 to −0.21) (Figure 5(c)).
Risk factors for T2DM-related deaths
In 2021, an estimated 1,429,117 (95% UI, 1,314,993–1,517,174) deaths among people aged ⩾55 years were attributable to T2DM, with various risk factors contributing to this mortality. Beyond metabolic risks, such as high fasting plasma glucose, the GBD database identifies two additional categories of risk factors for this age group: Environmental/Occupational risks, accounting for 21.90% (95% UI, 15.08–29.05), and Behavioral risks, accounting for 37.66% (95% UI, 22.2–49.46) of deaths. Within these categories, dietary risks were significant, contributing to 22.68% (95% UI, 4.37–37.07) of T2DM-related deaths. Air pollution was another prominent factor, accounting for 16.82% (95% UI, 9.91–23.61). Low physical activity and tobacco use were also substantial contributors, accounting for 9.57% (95% UI, 4.18–14.63) and 9.47% (95% UI, 5.95–13.10) of deaths, respectively. Non-optimal temperatures contributed to 6.18% (95% UI, 3.9–9.15) of deaths, while high alcohol use was responsible for 1.77% (95% UI, 0.67–3.27). Risk factor impacts varied by sex, with males exhibiting higher death rates related to tobacco use and high alcohol consumption across all ages and geographic regions. These findings underscore the importance of addressing behavioral and environmental risk factors, in addition to metabolic risk, to reduce T2DM-related mortality among older adults (Figure 6).

Proportion of T2DM mortality rate attributable to risk factors among population aged 55 years and over.
Prediction of the incidence by ARIMA models
The ARIMA model predicts upward trends in the incidence and number of T2DM cases among individuals aged ⩾55 years from 2022 to 2036. By 2036, the global population in this age group with T2DM is projected to reach 12,287,979, representing a 232.06% increase from 2022. This rise is more pronounced among females, with an estimated increase of 233.02%, compared to a 231.10% increase in males (Figure 7).

Epidemiologic trends in diabetes incidence among population aged 55 years and over: 2022–2036. (a) Trends in overall number of incident cases, (b) trends in female number of incident cases, and (c) trends in male number of incident cases.
Discussion
This study presents the most comprehensive analysis to date of the global burden of T2DM among adults aged ⩾55 years, utilizing data from the GBD 2021 database. From 1990 to 2021, we observed a significant increase in T2DM incidence, mortality, and DALYs across nearly all geographic and sociodemographic regions. Incidence rose most notably among males and individuals aged 55–64 years, while mortality and DALYs were disproportionately concentrated among females and the oldest-old in low and middle SDI regions. At the national level, countries such as Qatar, Fiji, and India reported some of the highest T2DM-related burdens, highlighting substantial geographic disparities in health outcomes.
The pronounced increase in incidence among adults aged 55–64 years may be attributed to rising urbanization, dietary transitions, physical inactivity, and extended life expectancy. 18 The higher incidence in males may be attributed to sex-specific behaviors, including greater tobacco and alcohol use and occupational exposures that elevate metabolic risk. 19 Conversely, lower incidence rates in those aged ⩾75 years may reflect survivor bias, where individuals with severe metabolic dysregulation die earlier and do not survive into older age. 20
A particularly striking finding is the disproportionately higher T2DM-related mortality in older females in low and middle SDI regions. While prior studies in high-income settings have associated female sex with suboptimal glycemic control, our results suggest that this disparity is amplified in settings with limited resources.21–23 Sociocultural barriers, such as limited financial autonomy and lower health literacy, likely contribute to diagnostic delays and undertreatment.24,25 For example, in many middle- and low-income areas, gendered responsibilities for caregiving, limited economic autonomy, and limited health literacy prevent women from accessing timely diagnosis and treatment. 26 In addition, male-dominated decision-making structures and gender-insensitive healthcare systems further erode therapeutic autonomy and lead to delayed diagnosis. 27 Biologically, females are more susceptible to diabetes-related complications due to factors such as central fat distribution, postmenopausal hormonal changes, and increased vascular reactivity, which together increase the risk of kidney disease, cardiovascular events, and disability. 28
Regional and national disparities in the T2DM burden reflect differences in healthcare systems, policies, and access to treatment. High SDI regions, such as High-income Asia Pacific and North America, have some of the highest incidence rates. However, mortality has declined in these areas. This improvement is likely due to early diagnosis, comprehensive disease management, and access to novel glucose-lowering therapies, including SGLT2 inhibitors and GLP-1 receptor agonists.29,30 In contrast, mortality rates in low and middle SDI regions remain elevated due to limited access to diagnostics, essential medicines, and long-term follow-up care. 31
Our findings are consistent with prior GBD-based studies, which have documented the rising global burden of diabetes, particularly in low- and middle-income countries. For example, the GBD 2019 diabetes analysis reported increasing prevalence and YLDs in South Asia and sub-Saharan Africa, aligning with our observed high burden in India and other low- and middle-income countries. 32 Similarly, national-level studies from countries such as China and Mexico have shown rising incidence and mortality among older adults, largely driven by rapid urbanization and population aging. 33 However, compared to these earlier studies, our analysis is unique in its age-specific focus on adults aged ⩾55 years, providing new insights into the demographic most vulnerable to severe diabetes-related outcomes. In addition, identifying countries like Qatar and Fiji with unexpectedly high age-standardized DALY rates suggests the presence of potentially overlooked regional risk factors, warranting further investigation.
Beyond metabolic risks, behavioral and environmental factors significantly contributed to T2DM-related mortality among older adults. Dietary risks, particularly excessive intake of processed meats, sugar-sweetened beverages, saturated fats, and sodium, along with insufficient consumption of vegetables, fiber, and whole grains, were prominent contributors. 34 Other key risks included physical inactivity, tobacco use, and air pollution, with the latter accounting for over 16% of T2DM-related deaths in this age group. These findings underscore the multifactorial nature of diabetes pathogenesis and the need for comprehensive, multisectoral interventions. Environmental health interventions, particularly air quality improvements, require policy-level action.35,36 Governments should implement urban planning strategies, vehicle emission regulations, and air quality monitoring systems. 37 Fiscal measures such as taxing ultra-processed foods, limiting sugar content, and subsidizing healthy diets can also reduce dietary risks. 38 These policies are crucial in rapidly urbanizing regions experiencing nutritional and environmental transitions.
Future projections suggest that the burden of T2DM in older adults will continue to rise globally. 39 Our ARIMA model estimates that by 2036, over 12 million individuals aged ⩾55 years will be living with T2DM, a finding consistent with WHO projections that highlight the convergence of aging populations and diabetes prevalence.40,41 Between 2015 and 2050, the proportion of the world’s older adults will nearly double from 12% to 22%. 41 This projected increase is especially prominent among females, further reinforcing the need for sex-sensitive public health strategies.
Despite its strengths, this study has limitations. First, GBD estimates rely on modeled data, and in many low-income regions, limited surveillance systems and underreporting may result in under- or overestimation of disease burden. For example, settings lacking reliable death certification may misclassify diabetes-related mortality. 42 Conversely, model overfitting in high-data-density regions may exaggerate burden estimates.11,43,44 Second, although the GBD dataset is one of the most comprehensive globally, it lacks granularity at the subnational level. Future efforts should incorporate national electronic health records, longitudinal cohort data, and biomarker-linked surveys to generate more nuanced and regionally representative estimates of T2DM burden across diverse populations.45,46
In conclusion, this study provides a comprehensive assessment of the global burden of T2DM among adults aged 55 and older, highlighting substantial increases in incidence, mortality, and DALY rates from 1990 to 2021. The findings underscore the need for targeted interventions addressing behavioral, environmental, and metabolic risks, particularly in low- and middle-income regions. With projected increases in T2DM cases, especially among aging populations, integrated approaches that combine lifestyle modifications, early screening, and accessible healthcare are essential to mitigating the global impact of T2DM and improving outcomes for older adults worldwide.
Supplemental Material
sj-docx-1-tae-10.1177_20420188251362011 – Supplemental material for Global epidemiology and burden of type 2 diabetes in adults aged 55 and older: insights from 1990 to 2021
Supplemental material, sj-docx-1-tae-10.1177_20420188251362011 for Global epidemiology and burden of type 2 diabetes in adults aged 55 and older: insights from 1990 to 2021 by Xiao Yu, Chengxia Kan, Kexin Zhang, Xiaofei Zhang, Jiayi Ren, Jinyan Chen, Yuqun Wang, Yang Zhang, Guangdong Zhang and Xiaodong Sun in Therapeutic Advances in Endocrinology and Metabolism
Supplemental Material
sj-docx-2-tae-10.1177_20420188251362011 – Supplemental material for Global epidemiology and burden of type 2 diabetes in adults aged 55 and older: insights from 1990 to 2021
Supplemental material, sj-docx-2-tae-10.1177_20420188251362011 for Global epidemiology and burden of type 2 diabetes in adults aged 55 and older: insights from 1990 to 2021 by Xiao Yu, Chengxia Kan, Kexin Zhang, Xiaofei Zhang, Jiayi Ren, Jinyan Chen, Yuqun Wang, Yang Zhang, Guangdong Zhang and Xiaodong Sun in Therapeutic Advances in Endocrinology and Metabolism
Footnotes
References
Supplementary Material
Please find the following supplemental material available below.
For Open Access articles published under a Creative Commons License, all supplemental material carries the same license as the article it is associated with.
For non-Open Access articles published, all supplemental material carries a non-exclusive license, and permission requests for re-use of supplemental material or any part of supplemental material shall be sent directly to the copyright owner as specified in the copyright notice associated with the article.