
Abstract
Introduction:
There is conflicting evidence regarding optimal glycaemic targets to reflect the legacy effect of hyperglycaemia in people with type 2 diabetes (T2D). We examined the risks of microvascular complications and hospital admission with glycated haemoglobin (HbA1c) levels from the diagnosis of T2D.
Methods:
We identified individuals with incident T2D from 1998 to 2007 from the Clinical Practice Research Datalink and Hospital Episode Statistics. A composite microvascular outcome was defined as a new diagnosis of neuropathy, nephropathy or retinopathy. A multivariate time-varying Cox regression analysis was performed to assess the risk of microvascular disease associated with HbA1c at five different levels (1.0% (11 mmol/mol) intervals). HbA1c 6.5%–7.5% (48.0–58.9 mmol/mol) was defined as the reference.
Results:
N = 172,869 (mean age 62.6 ± 14.0 years, 54.6% female) were analysed. Average follow-up was 11.2 years. The risk of microvascular disease increased with higher HbA1c levels, the highest risk in the ⩾9.6% (⩾81 mmol/mol; hazard ratio (HR): 1.29, 95% confidence interval (CI): 1.11–1.51) and the lowest in the <6.5% (<48.0 mmol/mol; HR: 0.94, 95% CI: 0.83–1.08). The risk of hospital admission suggested a U-shaped association with HbA1c, highest risk in the lowest (<6.5% (<48.0 mmol/mol); HR: 1.04, 95% CI: 1.01–1.07) followed by HbA1c groups (8.6%–9.6% (70.0–81.0 mmol/mol); HR: 1.02, 95% CI: 0.97–1.08) while the lowest risk for hospital admission was observed for targets with the reference group (target between 6.5% and 7.5%, (48.0–58.9 mmol/mol)).
Conclusion:
The risk of microvascular complications was lowest when HbA1c levels were within the non-diabetic range and increased with higher HbA1c levels. The risk of hospital admission was significantly elevated in individuals with HbA1c levels below 6.5%, suggesting a potential U-shaped association, although the increased risk at higher HbA1c levels did not reach statistical significance. This highlights the importance of maintaining individualised HbA1c targets in the management of T2D from diagnosis to prevent these complications.
Plain language summary
In this study, we examined the risks of developing complications affecting the eyes, kidneys, nerve damage and hospital admission with blood sugar levels in people from diagnosis of their type 2 diabetes. We identified individuals with newly diagnosed type 2 diabetes from 1998-2007 and followed patients up for a further 11 years. Patients’ data was collected from the Clinical Practice Research Datalink and Hospital Episode Statistics. A combine small vessel disease outcome was defined as a new diagnosis of nerve damage, kidney disease and eye disease. We used statistical technique to assess the risk of small vessel disease associated with five different levels of glucose control, assessed by a measure of blood test called HbA1c. Data of 172,869 patients (average age 62.6 ± 14.0 years, 54.6% female) were analysed. Average follow-up was 11.2 years. The risk of small vessel diseases increased with higher HbA1c levels, the highest risk in the ⩾9.6% and the lowest in the <6.5%. The risk of hospital admission demonstrated a U-shaped association with HbA1c, highest risk in the lowest (<6.5%) and highest HbA1c groups. Conclusion The risk of small vessel diseases was lowest when HbA1c levels were within the non-diabetic range and increased with higher HbA1c levels. The risk of hospital admission was highest in both the lowest (<6.5%) and highest (8.6-9.6%) HbA1c categories, demonstrating a U-shaped association. This highlights the importance of maintaining individualised HbA1c targets in the management of T2D from diagnosis to prevent these complications.
Introduction
Chronic exposure to hyperglycaemia is associated with an increased risk of microvascular complications, leading to the development of diabetic kidney disease, nerve issues, lower limb amputation and blindness.1,2 These complications occur due to glucose-mediated damage to the endothelium mediated by oxidative stress, polyol pathway and the production of advanced glycation end products.2,3 Glycated haemoglobin (HbA1c) is an important determinant for microvascular risks.4–6 An increase of 11 mmol/mol in HbA1c is associated with a 37% increased risk of retinopathy or nephropathy.7,8 Landmark trials such as the United Kingdom Prospective Diabetes Study (UKPDS), 9 Action to Control Cardiovascular Risk in Diabetes (ACCORD), 10 Action in Diabetes and Vascular Disease: and Diamicron MR Controlled Evaluation (ADVANCE) 11 and Glucose Control and Vascular Complications in Veterans with Type 2 diabetes 12 have demonstrated the benefits of intensive glucose control to reduce risks of microvascular complications in people with type 2 diabetes (T2D). Consequently, current guidelines have recommended target HbA1c levels of between 6.5% and 7.5% (48–57 mmol/mol) to mitigate the risks of microvascular complications.13,14
While the aforementioned landmark trials9–12 have shaped current recommendations for optimal HbA1c targets, it is important to note that, apart from the UKPDS, most recent studies have not assessed the relationship between HbA1c levels and complication risk from diagnosis of T2D. The discrepancies observed between these trials regarding the impact of glycemic control are primarily related to macrovascular rather than microvascular outcomes and might be influenced by differences in patient characteristics (e.g. newly diagnosed vs long-standing diabetes, diabetes duration, baseline body mass index (BMI), etc.), target HbA1c level, rapidity of HbA1c lowering and risks of hypoglycaemia. 15 In contrast, the beneficial effect of improved glycaemic control on reducing microvascular complications has been more consistently observed across trials. 16 Notably, even in the ACCORD trial, 10 which enrolled patients with a median diabetes duration of 10 years and was halted prematurely due to increased mortality in the intensive control arm, a protective effect of intensive glycaemic control on microvascular complications was still observed, although the benefit was modest and outweighed by the increased mortality risk.
These conflicting findings were largely due to the failure to differentiate between the ‘legacy’ benefits of tight glucose control in the newly diagnosed population as in the UKPDS versus the risks in those with long-standing T2D many of whom also have other co-morbidities. The ‘legacy effect’ of hyperglycaemia refers to the long-term benefits of early glycaemic control, as sustained exposure to hyperglycaemia from diagnosis can induce irreversible microvascular damage.1–5 Importantly, the therapeutic landscape has significantly change since the UKPDS due to the advent of modern diabetes treatments which have vascular protective effects independent of glucose lowering and not associated with increased risks of hypoglycaemia. For example, a meta-analysis of 10 randomised controlled trials involving 92,400 participants with T2D using glucose-lowering therapies with low risk of hypoglycaemia demonstrated that a 11 mmol/mol reduction in HbA1c was associated with a significant 30% reduced risk for major adverse cardiovascular events while trials using conventional glucose-lowering agents with a higher risk of hypoglycaemia failed to demonstrate any benefits. 17 This may also explain the discordance in outcomes between observational studies and randomised controlled trials. 18
In addition to glucose-lowering agents, aggressive management of hypertension and dyslipidaemia—since the UKPDS—has also contributed to further reductions in microvascular risk among people with type 2 diabetes. Current guidelines are also advocating for less glucocentric approaches to management with an emphasis on individualisation of care and HbA1c targets.13,14 This aligns with the evolving landscape of diabetes management, which emphasises a shift towards more comprehensive approaches.
Recent studies investigating the optimal HbA1c target to reduce microvascular events and need for hospitalisation have therefore not taken the ‘legacy’ effects of hyperglycaemia into account by following patients from diagnosis.5,7,19–21 We, therefore, aim to undertake an observation study to investigate the most appropriate HbA1c target associated with decreased risk of microvascular complications and hospital admission by following patients from the date of diagnosis of T2D and considering various patient characteristics such as age, comorbidities and current medication usage.
Methods
Study design and source of data
We performed a prospective cohort study depending on data extracted from the Clinical Practice Research Datalink (CPRD) GOLD database linked to Hospital Episodes Statistics (HES) and Office of National Statistics (ONS) databases. The CPRD GOLD database holds data of over 17 million patients obtained from 674 general practices in the UK. 22 Data from CPRD are of high quality and validated to be representative of the overall UK population, 23 which makes it a reliable data source in many published high-quality observational studies. HES and ONS are used to link the data in CPRD to determine the details related to hospital activity and mortality of included individuals from the CPRD database. CPRD studies are approved by the Independent Scientific Advisory Committee of CPRD and the Medicines and Health Products Regulatory Authority (Protocol 19_202R). The data were provided by patients and collected by the NHS as part of their care and support. The interpretation and conclusions contained in this study are those of the authors alone.
Study population
We included people aged 18 or over with either a diagnosis or prescription record indicating newly diagnosed T2D between January 2007 and December 2017. The T2D patients were identified via read codes or prescriptions in CPRD data and International Classification of Diseases 10th edition ICD-10 codes in HES data. 24 Participants were followed up from the earliest: the date T2D diagnosis or date of the first prescription. We excluded individuals who had concurrent diagnoses of T2D or other types of diabetes, those with evidence of receiving medications for diabetes before the study period, patients with <12 months of registration before entering the study and <12 months of follow-up, individuals under 18 years of age at the start of the study, those initiating insulin therapy within 12 months after diagnosis, which could indicate a higher risk of misdiagnosis of T1DM and patients with pre-existing nephropathy, neuropathy or retinopathy. For hospital admission analysis, we excluded individuals who were hospitalised within 30 days of the study entry date.
Outcomes and exposure
The primary outcome – microvascular complications – was defined as any event of neuropathy, nephropathy or retinopathy. The secondary outcome – first hospital admission – was defined using HES data.
HbA1c levels are categorised into five groups aligned with current guidelines (<6.5% (48.0 mmol/mol); 6.5%–7.5% (48.0–57.9 mmol/mol); 7.5%–8.5% (58–69.9 mmol/mol), 8.5%–9.6% (70.0–80.9 mmol/mol) and ⩾9.6% (81 mmol/mol)). HbA1c 6.5%–7.5% (48.0–57.9 mmol/mol) was defined as the reference group aligned with current guidelines.
Confounders
We extracted data including patient characteristics, relevant clinical diagnoses, medications and laboratory measurements at quarterly intervals as follows: (1) Patient characteristics included age, gender, ethnicity, BMI, blood pressure (BP), alcohol consumption, smoking status and family history of heart disease. (2) Clinical diagnoses included ischaemic heart disease, atrial fibrillation, previous stroke, chronic kidney disease, Parkinson’s disease, peripheral arterial disease, heart failure, rheumatological conditions, hypertension, severe mental health problems, HIV/AIDS. (3) Medications included lipid-lowering drugs; antihypertensives and anti-diabetic medications such as metformin, thiazolidinediones, sodium glucose-linked transporter 2 inhibitors, dipeptidyl peptidase-4 inhibitors (DPP4), sulphonylureas (SU) and glucagon-like peptide-1 (GLP1) receptor agonists. (4) Laboratory values included HbA1c, estimated glomerular filtration rate, lipid profile (including low and high-density lipoprotein, total cholesterol and triglycerides) and urinary albumin creatinine ratio.
Statistical analysis
Patients’ characteristics, medications, clinical and laboratory data were described by mean and standard deviation for continuous variables and number and frequency for categorical variables. Incidence rates for each outcome were calculated per person-years of follow-up and presented using Kaplan–Meier curves. We managed missing data by multiple imputation using multiple chained equations. All analyses were performed on imputed datasets using Rubin’s rules to combine effect estimates and standard errors across five imputed sets. 25 The data were captured quarterly at 91-day intervals, and a time-varying multivariate Cox regression analysis was performed to assess the association between HbA1c levels and the outcomes of interest, adjusting for potential confounders. Early glycaemic control was measured based on the first available HbA1c value after diagnosis while accounting for regular monitoring throughout the follow-up period. The main models were adjusted for age, sex, BMI, smoking status, alcohol use and the use of antidiabetic, antihypertensive and lipid-lowering medications.
We evaluated the proportional hazards assumption and examined the distribution of all covariates. Any variables found to violate these assumptions were incorporated as strata if they were chosen for inclusion in the model. Continuous variables were included in the model as fractional polynomial terms.
We utilised forward stepwise selection to develop the model for each outcome. The model was considered optimal when the reduction in Akaike’s Information Criteria 26 was <2. Model calibration was assessed using Royston’s D 27 and Harrell’s C 28 statistics. Age at diagnosis was included in the model as a priori covariate.
Our main analyses investigated the risks for different categories of HbA1c using HbA1c 6.5%–7.5% (48.0–57.9 mmol/mol) as the reference group. For illustrative purposes, we also present risk estimate patterns for exact HbA1c values, with reference of 7% (53 mmol/mol). These estimates highlight the continuous nature of risk variation across HbA1c levels.
Subgroup analyses were conducted to evaluate the risk of composite microvascular and hospital admission across HbA1c levels in patients with selected conditions, prescriptions and those aged 60 or older at baseline. Two separate analyses were performed per covariate: one for patients with the condition/prescription and one for patients aged 60 or older. These characteristics encompassed pre-existing cardiovascular disease (CVD), insulin and sulphonylureas usage, as well as age groups for hospital admission. For the composite microvascular outcome, we examined hypertension at the time of T2D diagnosis, the use of antihypertensive medication and age groups. Data preparation and analyses were performed using Stata v17.0 (StataCorp LLC, College Station, TX, USA).
Results
Cohort characteristics
The study cohort comprised 172,869 individuals who were newly diagnosed with T2D. The flowchart in Supplemental Figure 1 illustrates the process the study population was selected from the larger CPRD population of individuals with T2D for composite microvascular disease and hospital admission.
Over the study period, 3817 individuals (3.2%) experienced composite microvascular outcomes, while 55,382 individuals (32.6%) were admitted to the hospital for the first time. On average, the total population was 62.6 years old (standard deviation (SD) 14), with a mean BMI of 31.9 (SD 6.6) and mean HbA1c level of 52.6 (SD 13.3). The majority were female (54.6%). A summary of the baseline characteristics is presented in Table 1.
Baseline characteristics of the cohort.

BMI, body mass index; BP, blood pressure; DPP4, dipeptidyl peptidase-4; GLP1, glucagon-like peptide-1; HbA1c, glycated haemoglobin; SD, standard deviation; SGLT2, sodium glucose-linked transporter 2.
The rate of composite microvascular outcomes was estimated at 0.54 (95% confidence interval (CI): 0.53–0.56) per 100 person-years, while the rate of first hospital admission was 9.37 (95% CI: 9.29–9.45) per 100 person-years. The study involved an average follow-up period of 11.2 years for the entire cohort. However, in analyses of the composite microvascular outcomes, the median follow-up duration was 3.7 years, and for the hospital admission analysis, it was 2.7 years. These median values reflect the central point of the follow-up periods for participants included in those specific outcome analyses. The total analysis time at risk was 702,960 years for composite microvascular outcomes and 590,813 years for hospital admission. Supplemental Figure 2 presents Kaplan–Meier survival curves demonstrating the event rate of microvascular complications (Supplemental Figure 2(a)) and hospital admission (Supplemental Figure 2(b)) across HbA1c categories. Higher HbA1c levels are associated with an increased risk of both microvascular complications and hospital admission and lower survival probabilities in higher HbA1c groups.
Composite microvascular outcome
The risk of developing composite microvascular disease increases progressively with rising HbA1c levels, without a sharp threshold. As shown in Figure 1, individuals with HbA1c ⩾9.6% (81.0 mmol/mol) had the highest risk (hazard ratio (HR): 1.70, 95% CI: 1.47–1.97), whereas those with HbA1c <6.5% (48.0 mmol/mol) had the lowest observed risk (HR: 0.95, 95% CI: 0.87–1.04).

The risk of composite microvascular diseases across different levels of HbA1c (reference: 6.5%–7.5% (48.0–57.9 mmol/mol)).
Fractional polynomial modelling confirms a continuous, non-linear association, demonstrating that the risk of microvascular complications begins to rise at HbA1c 7% (53 mmol/mol), with an accelerating increase at higher levels. The steepness of the curve reflects a sharper increase in risk beyond this point, which corresponds to wider CIs in these ranges – likely due to greater variability in estimates. The HRs for covariates, Royston’s D and Harrell’s C statistics are provided in Supplemental Table 1.
In the context of age subgroup analysis, individuals aged <60 years had the lowest incidence of composite microvascular outcome event when their HbA1c levels were <6.5% (48.0 mmol/mol; HR: 0.80, 95% CI: 0.62–1.02). Conversely, the highest risk was observed in this age group among those with HbA1c levels of 9.6% (81.0 mmol/mol) or higher (HR: 1.64, 95% CI: 1.30–2.08). Among individuals aged ⩾60 years, the risk of microvascular complications was elevated across all HbA1c groups relative to the reference. Although the numerically lowest risk was observed in those with HbA1c <6.5% (<48 mmol/mol), this difference was not statistically significant when compared to the reference group (6.5%–7.5% (48–58 mmol/mol); HR: 1.00, 95% CI: 0.92–1.10). The highest risk was observed in individuals with HbA1c >9.6% (⩾81 mmol/mol), which was statistically significant (HR: 1.50, 95% CI: 1.24–1.82), as shown in Supplemental Figure 3(a).
Among individuals without hypertension, the risk of composite microvascular complications was significantly elevated in those with HbA1c levels ⩾9.6% (81.0 mmol/mol) (HR: 1.72, (95% CI: 1.39–2.12)) compared to the reference group. Similarly, among individuals with hypertension, a significantly increased risk was observed in those with HbA1c levels ⩾9.6% (81 mmol/mol; HR: 1.66, (95% CI: 1.38–1.98)). No other HbA1c categories showed a statistically significant difference in risk compared to the reference group in either population as demonstrated in Supplemental Figure 3(b).
Among individuals using antihypertensive drugs, the risk of microvascular complications was significantly elevated in those with HbA1c levels ⩾9.6% (81 mmol/mol; HR: 1.53 (95% CI: 1.07–2.19)) compared to the reference group. Similarly, among those not using antihypertensive drugs, a significantly increased risk was observed in individuals with HbA1c levels ⩾9.6% (81.0 mmol/mol; HR: 1.77 (95% CI: 1.36–2.29)). No other HbA1c categories showed a statistically significant difference in risk compared to the reference group in either population as demonstrated in Supplemental Figure 3(c).
First hospital admission outcome
The risk of first hospital admission followed a U-shaped pattern across HbA1c levels, with the lowest risk observed in the reference group (HbA1c 6.5%–7.5% (48.0–57.9 mmol/mol)). As shown in Figure 2, individuals with HbA1c <6.5% (48.0 mmol/mol) exhibited a slightly higher risk of hospitalisation (HR: 1.04, 95% CI: 1.01–1.07), while increased risk was also observed at higher HbA1c levels, particularly in the 8.6%–9.6% (70.0–80.9 mmol/mol) range. Fractional polynomial modelling further confirms a non-linear relationship, illustrating a U-shaped risk association. The risk increases at both lower and higher HbA1c levels, with a more pronounced rise beyond HbA1c 7% (53 mmol/mol). The HRs for covariates, Royston’s D and Harrell’s C statistics are provided in Supplemental Table 2.
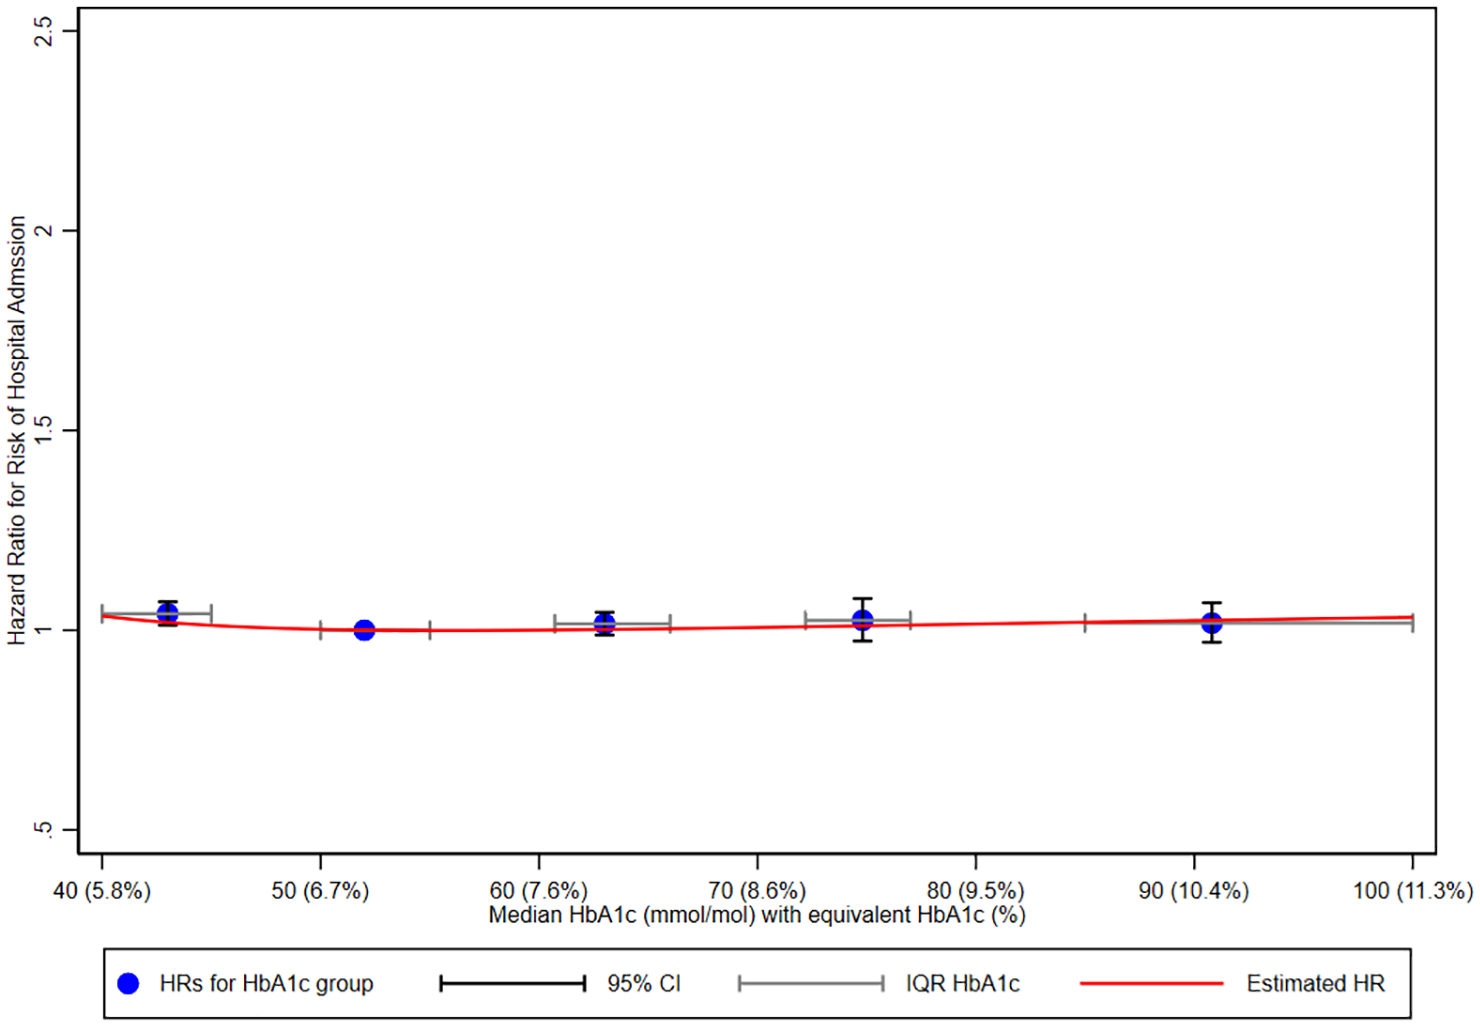
The risk of first hospital admission across different levels of HbA1c (reference: 6.5%–7.5% (48.0–57.9 mmol/mol)).
In both age groups, the risk of first hospital admission did not differ significantly across HbA1c categories. While there were numerical differences in HRs, these did not reach statistical significance. For example, in individuals aged <60 years, the HbA1c 7.5%–8.6% (58–70 mmol/mol) group showed a slightly lower risk, whereas the <6.5% group had a modestly higher risk, though neither was statistically significant. Similarly, among those aged ⩾60 years, the risk was broadly similar across all HbA1c categories, including the ⩾9.6% (⩾81 mmol/mol) group (HR: 1.05, 95% CI: 0.97–1.13). These patterns are illustrated in Supplemental Figure 4(a).
People with no previous CVD had a lower risk of first hospital admission compared to those with a history of CVD. Among individuals without CVD, the reference group (HbA1c 6.5%–7.5% (48.0–57.9 mmol/mol)) had the lowest risk. The highest risk was observed in the <6.5% (48.0 mmol/mol) group, with a HR of 1.04 (95% CI: 1.00–1.08). For individuals with CVD, the reference group (HbA1c 6.5%–7.5% (48.0–57.9 mmol/mol)) also had the lowest risk. The highest risk was observed in the 8%–9.6% (70.0–80.9 mmol/mol) group, with an HR of 1.06 (95% CI: 0.95–1.18). These patterns are demonstrated in Supplemental Figure 4(b).
Both insulin and SU use were generally associated with higher risks of first hospital admission across HbA1c categories when compared to the reference group (<6.5% (<48 mmol/mol)). However, these differences were not statistically significant. Among insulin users, the HRs were modestly elevated across all HbA1c groups, with the highest estimate in the 7.6%–8.5% (58–70 mmol/mol) group (HR: 1.10, 95% CI: 0.88–1.39). Similarly, among sulphonylurea users, the HRs were slightly increased but non-significant, including in the 8.5%–9.5% (70–80.9 mmol/mol) group (HR: 1.06, 95% CI: 0.98–1.14). These findings are presented in Supplemental Figure 4(c) and (d).
Discussion
We found that HbA1c levels below 6.5% (48 mmol/mol) were non-significantly associated with decreased risks of microvascular complications, whereas the risk increased as HbA1c levels rose. Additionally, HbA1c levels between 6.5% and 7.5% (48 and 57.9 mmol/mol) were associated with the lowest risk of hospitalisation, indicating a U-shaped association. Higher HbA1c levels were associated with increased hospitalisation risk across subgroups of older patients, those with CVD and those using insulin. Similarly, the risk of microvascular complications increased with higher HbA1c levels in all patients, with a stronger association in older individuals and with hypertension.
Despite the emergence of new therapies and more aggressive treatment guidelines, our findings remain largely in line with the UKPDS study, which found that a decrease of 10 mmol/mol in HbA1c can result in a significant decrease in microvascular complications. 9 Other large trials such as VADT and ADVANCE consistently demonstrate decreased complications with HbA1c levels below 53 mmol/mol, supported by meta-analyses comparing tight diabetes control to conventional approaches. 28 HbA1c levels above 7% (53 mmol/mol) in newly diagnosed patients with T2D are associated with increased microvascular complication risk.29,30 Beyond microvascular risk, a recent study interestingly suggests a progressively reduced risk for cardiovascular complications even below 5.7% after mean follow-up by 4.6 years. 31 We would suggest and speculate that this observation suggests that factors determining macrovascular risk in people with T2D are likely to be multifactorial, and the reduction in macrovascular risk with much lower HbA1c is a surrogate of an overall better treatment compliance, lifestyle and behavioural choices.
Older patients demonstrate a higher risk of microvascular complications across all HbA1c levels compared to younger individuals, with the lowest risk found in the reference group (HbA1c range 6.5%–7.5% (48.0–57.9 mmol/mol)), though this difference was not statistically significant. In contrast, the highest risk was significantly associated with HbA1c levels >9.6% (81 mmol/mol) in both older and younger patients. The effect of age as an important determinant of microvascular risk has been reported by numerous studies.21,32–35 Age-related factors such as increased insulin resistance, beta cell damage and higher risk of vasculopathy contribute to this phenomenon.21,35 Butler et al. 5 conducted a systematic review and meta-analysis, demonstrating a 3.3-fold increase in retinopathy risk in patients above 55 years compared to younger patients. They also found that patients aged over 50 years exhibited higher prevalences of retinopathy across various HbA1c targets, similar to our findings. 5 However, limited data exist on age-specific effects on other microvascular complications such as nephropathy and neuropathy. Cheema et al. 4 highlighted age as a significant predictor of retinopathy but not of nephropathy and neuropathy, underscoring the need for further research to elucidate age-specific effects on each microvascular complication. Importantly, while lowering HbA1c levels below 48 mmol/mol reduces the risk of microvascular complications, the impact on macrovascular complications and mortality is less clear. Studies such as the ACCORD trial have highlighted potential risks associated with intensive glycaemic control in older populations, particularly with respect to hypoglycaemia and increased mortality.10,36 These risks are often compounded by polypharmacy and comorbidities prevalent in this age group.
Hypertension and use of antihypertensive therapies are important modulators of risks for developing microvascular complications in T2D. 21 We observed that among patients with hypertension, risks of developing microvascular complications were increased across all HbA1c values, whereas among patients without hypertension, achieving HbA1c targets below 6.5% (48 mmol/mol) was not statistically significantly associated with a reduced risk of developing microvascular complications. HbA1c level of >9.6% (81 mmol/mol) poses the highest risk in both hypertensive and non-hypertensive patients. However, specific HbA1c targets for hypertensive and non-hypertensive individuals remain underexplored and require further investigation to optimise treatment strategies. 19
Guidelines recommend a target BP <140/80–90 mmHg in patients with T2D, with a lower threshold (<130/80 mmHg) recommended for patients with microvascular complications. 14 Our analysis showed that the lowest risk of microvascular complications occurred at HbA1c levels <6.5% (<48 mmol/mol), although this was not statistically significant in either patients using or not using antihypertensive medications. In contrast, HbA1c levels ⩾9.6% (⩾81 mmol/mol) were associated with significantly increased risk in both groups. These findings reinforce the importance of optimal glycaemic control and suggest that antihypertensive therapy may play a complementary role in reducing microvascular risk, though further studies are needed to explore this hypothesis.
Levels of HbA1c below 6.5% (48 mmol/mol) are associated with an increased risk of hypoglycaemia and other complications.10,29,37 While HbA1c levels below 6.5% showed the lowest observed risk of microvascular complications, this finding was not statistically significant. In contrast, the lowest hospital admission rates were observed in the reference group (HbA1c between 6.5% and 7.5% (48–57.9 mmol/mol)), demonstrating a U-shaped relationship between HbA1c levels and hospital admissions.
These results underscore the need to balance the benefits of reduced microvascular risk with the increased risks of hypoglycaemia and hospitalisation when determining optimal glycaemic targets. Based on our findings, maintaining HbA1c levels between 6.5% and 7.5% (48–57.9 mmol/mol) may be a more practical approach for patients at higher risk of hospital admission or hypoglycaemia. This approach aligns with the American Diabetes Association’s recommendations, which emphasise the importance of individualised glycaemic targets to minimise adverse outcomes while achieving overall benefits. 13
The observed differences in HbA1c levels associated with reduced hospitalisation risk between younger (7.5%–8.6% (58–70 mmol/mol)) and older (<6.5% (<48 mmol/mol)) patients are interesting. The association between increased risk of severe hypoglycaemia with intensive glycaemic control is well recognised. 38 As such, current guidelines recommend less stringent glycaemic targets (e.g. <8% (<64 mmol/mol)) for frail older patients to balance the risks and benefits of glycaemic control. We would suggest however that our observation of lower risk of hospital admission with HbA1c <6.5% in the elderly population may reflect choice of more cautious treatment strategies used to achieve these optimal targets (i.e. less use of sulphonylurea or intensive insulin treatment, but rather via glucose-lowering therapies with limited risk of hypoglycaemia). In support of this interpretation, we observed that among older individuals (⩾60 years), insulin use was lowest in those with HbA1c <6.5% (0.6%), increasing to 4.2% in those with HbA1c ⩾9.6%. Similarly, sulphonylurea use was 13.1% in the <6.5% group compared to 23.4% in the highest HbA1c group, suggesting that lower-risk therapies were more commonly used to achieve tighter control in this population. In addition, lower HbA1c targets in older patients may reduce risks of dehydration, infections risks, etc., which are important causes of hospital admission among the elderly. Conversely, the higher optimal HbA1c levels 7.5%–8.6% (58–70 mmol/mol) to reduce hospitalisation risk may reflect the broader use of intensive insulin treatment and sulphonylureas in younger patients with concurrent increased risks of hypoglycaemia. This is supported by our data: among younger individuals with HbA1c <6.5%, insulin use was 1.2% – double that of their older counterparts – and sulphonylurea use was similarly high at 12.9%. This may partly explain the increased hospitalisation risk at lower HbA1c levels in younger patients. This contrasts with current guidelines recommending HbA1c targets below 7% (53 mmol/mol) for this population.13,39 This discrepancy supports a patient-based approach in the management of diabetes, taking into account the individual’s age and their risk of developing hypoglycaemia, as well as the risk of hospitalisation. 40 Furthermore, the underlying reasons for hospitalisation likely vary across age and HbA1c categories. Younger patients with HbA1c levels below 7% (53 mmol/mol) might experience more hospitalisations due to hypoglycaemia.
Both insulin and sulfonylurea use were associated with an increased risk of hospitalisation driven by increased risk of hypoglycaemia.41,42 Insulin-induced hypoglycaemia, however, is also a major risk factor for cardiovascular complications and hence increases the risk of hospitalisation.11,43,44 Despite this, we found that HbA1c levels of <7.5% among insulin users were associated with the lowest level of hospitalisation. Thus, the relationship between hypoglycaemia risks is complex and its pathophysiology is likely to be multifactorial. Further studies are required to understand this link to improve clinical outcomes in people with T2D.
Strengths and limitations
To the best of our knowledge, this is the first large observational study to examine the association between HbA1c targets and microvascular complications or hospital admissions in specific high-risk T2D subgroups, including older adults, individuals with comorbidities such as hypertension and CVD, as well as those on insulin, sulfonylureas or antihypertensive medications, from the time of diagnosis. The study’s strengths lie in its utilisation of a robust time-dependent Cox regression model, adjusting for a comprehensive set of potential confounders, thus providing valuable insights into real-world clinical practice. Importantly, the study population is derived from a national database, enhancing the generalisability of our findings to the broader population of patients with T2D. While our observational study provides valuable insights, it is important to acknowledge its limitations. These include potential biases and unmeasured confounders that may influence our results. To address potential bias due to missing data, we employed multiple imputation techniques. However, residual confounding may still be present due to unmeasured factors like diet and lifestyle, which could impact the relationship between HbA1c and outcomes. Also, the median follow-up duration – 3.7 years for microvascular outcomes and 2.7 years for hospital admission – may not have been long enough for some individuals to develop significant risk of these complications. Lastly, relatively small number of participants were using medications like sodium glucose-link transporter 2 inhibitors or GLP-1 receptor agonists, which are now recommended earlier in treatment and are known for their cardio-renal benefit independent of glucose-lowering effect. In addition, the number of diabetes-related admissions for diabetic ketoacidosis, hyperosmolar syndrome and hypoglycaemia were not frequent enough for us to undertake a robust analysis of these important outcomes.
Conclusion
Our study revealed significant insights into the relationship between HbA1c levels and health outcomes. We observed that maintaining HbA1c levels below 6.5% (48 mmol/mol), within the normoglycemic range, was associated with a reduced risk of microvascular diseases with risks notably increased with HbA1c levels exceeding 9.6% (81 mmol/mol). The risk of hospital admission was significantly elevated in individuals with HbA1c levels below 6.5%. Although a U-shaped association was suggested, the increased risk observed at higher HbA1c levels was not statistically significant. These findings emphasise the importance of individualising target HbA1c levels based on the unique risk factors and medical conditions to optimise health outcomes.
Supplemental Material
sj-docx-1-tae-10.1177_20420188251350897 – Supplemental material for The legacy effect of early HbA1c control on microvascular complications and hospital admissions in type 2 diabetes: findings from a large UK study
Supplemental material, sj-docx-1-tae-10.1177_20420188251350897 for The legacy effect of early HbA1c control on microvascular complications and hospital admissions in type 2 diabetes: findings from a large UK study by Rami Aldafas, Yana Vinogradova, Thomas S. J. Crabtree, Jason Gordon and Iskandar Idris in Therapeutic Advances in Endocrinology and Metabolism
Supplemental Material
sj-docx-2-tae-10.1177_20420188251350897 – Supplemental material for The legacy effect of early HbA1c control on microvascular complications and hospital admissions in type 2 diabetes: findings from a large UK study
Supplemental material, sj-docx-2-tae-10.1177_20420188251350897 for The legacy effect of early HbA1c control on microvascular complications and hospital admissions in type 2 diabetes: findings from a large UK study by Rami Aldafas, Yana Vinogradova, Thomas S. J. Crabtree, Jason Gordon and Iskandar Idris in Therapeutic Advances in Endocrinology and Metabolism
Footnotes
Acknowledgements
We would like to thank the Clinical Practice Research Datalink (CPRD) for data access. No conflict of interest is declared for all authors in relation to the content of this manuscript.
Declarations
Supplemental material
Supplemental material for this article is available online.
References
Supplementary Material
Please find the following supplemental material available below.
For Open Access articles published under a Creative Commons License, all supplemental material carries the same license as the article it is associated with.
For non-Open Access articles published, all supplemental material carries a non-exclusive license, and permission requests for re-use of supplemental material or any part of supplemental material shall be sent directly to the copyright owner as specified in the copyright notice associated with the article.