
Abstract
Background:
Previous research has established a link between high blood levels of parathyroid hormone (PTH) levels and hyperglycemia, as well as early mortality. However, the extent of this relationship and the predictive value of PTH for mortality risk in hyperglycemic populations have been minimally explored.
Methods:
The National Health and Nutrition Examination Survey study conducted from 2003 to 2006 identified 932 adults with diabetes and 1645 adults with prediabetes. A weighted multivariate logistic regression analysis was utilized to examine the association between PTH levels and hyperglycemia. Furthermore, Cox proportional hazards regression models were employed to examine the correlation between PTH levels and both cardiovascular and overall mortality within the hyperglycemia cohort.
Results:
(1) The research findings revealed a negative association between PTH levels (per 10-pg/mL increase) and diabetes status (OR, 0.79; 95% confidence interval (CI), 0.73–0.86). (2) There was a significant correlation between the risk of all-cause mortality (hazard ratios (HR), 1.13; 95% CI, 1.01–1.29) and cardiovascular disease mortality (HR, 1.39; 95% CI, 1.05–1.84) among individuals with diabetes for every 10-pg/mL increase in PTH levels.
Conclusion:
The current research shows that individuals with elevated PTH spectrum within the normal range are less likely to have diabetes, while those with higher PTH levels in adults with diabetes are linked to worse outcomes, particularly cardiovascular mortality.
Background
The rapid demographic shift toward an older global population is anticipated to result in a significant uptick in the incidence of adult diabetes mellitus, which is expected to climb from 10% globally as of 2021 to 12% by the year 2045. 1 In parallel, there is a projected increase in prediabetes worldwide by 2045. 2 This escalation poses a considerable challenge to healthcare systems, as the burgeoning number of individuals with diabetes places a significant burden on medical resources, particularly in light of the macrovascular complications that are often associated with the condition. Diabetes has been linked to a substantial increase in mortality rates, ranging from two to four times higher, and has a well-established correlation with cardiovascular disease (CVD).3–5 It is paramount to recognize and evaluate prognostic factors that may predict adverse outcomes in populations exhibiting hyperglycemia, beyond the scope of conventional risk assessments.
It is widely acknowledged in academic literature that there is a close relationship between metabolic syndrome, specifically diabetes mellitus, and parathyroid-related disorders. 6 Metabolic dysregulation can manifest to varying degrees in individuals with hyperparathyroidism and hypoparathyroidism. In addition to the kidney and bone, parathyroid hormone (PTH) receptors are found in numerous tissues throughout the body. The metabolic and cardiovascular implications of parathyroid disorders may have a common underlying cause with metabolic syndrome.7,8 Research indicates that the advancement of diabetes mellitus could be affected by increased calcium concentrations within adipocytes, which are triggered by the activity of the parathyroid gland. This condition can result in a diminished capacity for insulin to facilitate the uptake of glucose in peripheral tissues and a reduction in the breakdown of fat within adipocytes due to the presence of excessive calcium, a state known as hypercalcemia.9,10 Studies have revealed a significant correlation between primary hyperparathyroidism (PHPT) and insulin resistance in patients. 11 The meta-analysis 12 revealed scant evidence of an association between PTH and diabetes, based on five studies examining this relationship. This suggests that the relationship between PTH levels and the risk of diabetes is not significantly influenced by modest variations in PTH concentration. The existing research does not impose any limitations on the range of PTH values, and there is a lack of evidence linking normal PTH levels to prediabetes or diabetes.
Previous studies have indicated a strong association between hyperparathyroidism and an unfavorable prognosis, particularly cardiovascular mortality.13,14 Elevated levels of PTH have been implicated in several detrimental outcomes, including weight gain, 15 heightened peripheral vascular resistance, atherosclerosis, endothelial dysfunction,16,17 and a significant correlation with heart failure and its severity,18–20 all of which may contribute to adverse cardiovascular events. Elevated PTH levels are associated with accelerated bone turnover, potentially causing a decrease in bone mineral density. This hormonal imbalance is also linked to an increased risk of fragility fractures, contributing to potential sources of mortality and disability. The connection between elevated PTH and these adverse outcomes underscores the importance of maintaining optimal PTH levels for bone health and overall well-being. 21 Studies have also suggested a potential link between high PTH levels and cancer,22,23 resulting in premature mortality. A meta-analysis 24 of 31,616 non-dialysis patients found that elevated serum PTH concentrations were associated with a 19% increased risk of mortality from all causes when comparing the group with the highest versus the lowest PTH concentrations. However, men are more likely to die from cardiovascular causes, with a 68% higher risk of death. The potential association between PTH and glycemic abnormalities, as well as the prognostic implications, remains uncertain in individuals with diabetes or prediabetes who have normal levels of calcium, phosphorus, and PTH. This investigation drew from the National Health and Nutrition Examination Survey (NHANES) database, focusing on cohorts exhibiting hyperglycemia. The aim was to explore and ascertain any significant associations that might exist between standard levels of PTH with the untoward outcomes of cardiovascular mortality and overall mortality among individuals with hyperglycemia.
Methods
The population of the study
The NHANES represents a sweeping and in-depth national initiative designed to assess and monitor the overall health and nutritional standing of people across the United States. This extensive survey serves as a critical tool for gathering data that paints a picture of the nation’s health landscape, informing policy and public health initiatives. This initiative gathers a wide range of information on individuals’ lifestyles, dietary patterns, and health conditions, supported by laboratory tests and physical examinations. The data collection process involved obtaining written consent from all 20,470 participants who took part in two data collection cycles between 2003 and 2006. Initially, 9515 participants aged 20 and above were enrolled in the study. Subsequently, 509 cases involving pregnant women and 567 instances with incomplete PTH data were excluded from the analysis. Furthermore, exclusion criteria for the study included 127 cases with incomplete data or abnormal serum albumin-adjusted calcium levels falling outside the established reference range of 8.5–10.5 mg/dL, 972 cases with incomplete data or abnormal serum phosphorus levels outside the reference range of 2.6–4.4 mg/dL, 3 cases lacking data on vitamin D, 8 cases with missing data on follow-up or mortality, and 60 cases with an estimated glomerular filtration rate lower than 30 mL/min/1.73 m². We identified 6435 adults with PTH levels falling within the normal range (18–74 pg/mL) and subsequently applied diagnostic criteria to include 1645 cases of prediabetes and 932 cases of diabetes (Figure 1).

Flowchart about eligible subjects.
Assessment of hyperglycemia and PTH
Any of the following criteria were used to identify diabetes: fasting plasma glucose (FPG) levels higher than 7.0 mmol/L, random plasma glucose levels, or 2-h glucose levels over 11.0 mmol/L following a 75-g oral glucose tolerance test, an HbA1c level reaching or surpassing 6.5%, provided that the serum hemoglobin concentration is over 100 g/dL, or the use of antihyperglycemic agent, along with a self-reported diagnosis by a healthcare professional. Prediabetes is characterized by the fulfillment of one or more of the following benchmarks: an FPG concentration ranging from 5.6 to 7.0 mmol/L, a casual plasma glucose measurement, or a glucose level at 2 h following a 75-g oral glucose tolerance test falling between 7.8 and 11.0 mmol/L, an HbA1c value spanning from 5.7% to 6.4%, provided that the serum hemoglobin level is over 100 g/dL, or an individual’s account of having been previously diagnosed with prediabetes.
The quantification of PTH was performed utilizing the Elecsys 1010 analyzer and a sandwich assay based on the electrochemiluminescent Origen technique. Under the laboratory’s procedural protocols, the reference range for PTH levels in healthy adults was determined to be 18–74 pg/mL. This determination was derived from the examination of samples collected from 214 participants in the NHANES conducted in September 2003, revealing that 95% of the healthy individuals had PTH levels falling within this specified range. To investigate the potential association between varying levels of PTH and the risk of death, the study categorized the PTH concentrations into three equivalent segments, known as tertiles.
Determination of mortality from all causes and CVD
Death records, covering all fatalities, with a focus on those attributable to cardiovascular conditions, were sourced from the National Death Index and then integrated with the NHANES database. Data collection and linkage were sustained until December 2019, with the follow-up period for each individual commencing from the date of blood sample analysis and concluding at death time or the end of the specified follow-up period. To determine the occurrences of mortality related to cardiovascular conditions, the International Classification of Diseases, 10th Revision (ICD-10) codes were consulted. The specific codes utilized for this classification encompassed I00-09, I11, I13, I20-51, and I60-69, which encompass a broad spectrum of cardiovascular ailments and disorders as delineated within the ICD-10 framework. The causes of infectious disease mortality included chronic lower respiratory diseases (J40-J47), influenza and pneumonia (J09-J18), and nephritis (N00-N07).
Covariates assessment
The research collected baseline data on participants, encompassing personal attributes like age, gender, ethnicity, educational level, and the ratio of family income to the poverty line, utilizing the Computer-Assisted Personal Interviewing system and questionnaires on Family and Sample Person Demographics. Furthermore, the study compiled information on lifestyle elements including smoking habits, alcohol intake, the use of hypoglycemic drugs, scores on the healthy eating index (HEI), and medical records pertaining to cardiovascular issues (such as coronary artery disease, heart failure, angina, myocardial infarction, or stroke), hypertension, and cancer. The NHANES protocol was followed to apply correct weighting to the baseline data. Additionally, blood samples were collected for the measurement of various biomarkers including serum PTH, creatinine, total calcium, phosphorus, albumin, 25-hydroxyvitamin D [25(OH)D], glycated hemoglobin A1c (HbA1c), lipid, and glucose (fasting, random or a 2-h glucose level after a 75-g OGTT), which were analyzed in a laboratory environment. Considering the impact of serum albumin levels on the overall serum calcium concentration, a correction formula was utilized to compute the serum albumin-adjusted calcium level, defined as the total serum calcium value subtracted by 0.02 times the disparity between the serum albumin level and 40 g/L. Under the Endocrine Society’s Clinical Practice Guidelines, 25 serum 25(OH)D levels were categorized into two groups: vitamin D deficiency for levels below 50 nmol/L and non-deficiency for levels at or above 50 nmol/L. The study utilized lifestyle interviews to classify smoking habits into three distinct groups: never-smokers, former smokers, and current smokers. Individuals who had smoked fewer than 100 cigarettes in their lifetime were categorized as never-smokers. Those who had surpassed the threshold of 100 cigarettes but had subsequently ceased smoking were designated as former smokers. Meanwhile, individuals who had smoked more than 100 cigarettes and continued to smoke, whether occasionally or regularly, were classified as current smokers. 26 Furthermore, participants’ alcohol intake was divided into two categories: non-drinkers, who had a lifetime consumption of less than 12 drinks, and ever-drinkers, who had consumed 12 or more drinks over their lifetime. 27 The quality of participants’ diets was evaluated using the HEI-2015 scores, with higher scores reflecting greater adherence to nutritional balance. 28 Physical activity levels were measured through metabolic equivalent (MET) scores, consistent with national physical activity recommendations. Engagement in physical activity was classified as low for those who expended less than 500 MET per week, whereas a high level of physical activity was denoted by 500 MET or above weekly. 29
Statistical analysis
Consistent with the analytical procedures outlined by NHANES, which consider the complex survey design, all data were adjusted to incorporate survey weights. Continuous data were presented using mean values and standard errors, whereas categorical variables were represented through numerical counts and percentages. Weighted Chi-square tests were employed for comparing baseline characteristics across different groups for categorical data, and Kruskal–Wallis tests were utilized for continuous data analysis. The study utilized Cox proportional hazards regression analysis to assess the association between PTH levels and the risk of overall and cardiovascular-specific mortality in individuals with diabetes and prediabetes. Hazard ratios (HRs) and their corresponding 95% confidence intervals (CI) were calculated while accounting for survey weights. Three separate models were developed to further investigate this relationship. The statistical approach involved utilizing the lower range of PTH as the baseline group to investigate the association between higher PTH levels and mortality within various models. To mitigate the impact of missing values in the study’s covariates, multiple imputation was utilized as a statistical method to estimate and substitute missing data, thereby enhancing the robustness of the analysis of the entire dataset. 30
The study utilized weighted multivariate logistic regression to assess the odds ratios and their corresponding 95% CI for the association between PTH levels and the prevalence of diabetes or prediabetes. This sophisticated statistical method allowed for a comprehensive assessment that accounts for multiple variables, thereby providing a more accurate and nuanced understanding of the potential links between PTH concentrations and glucose metabolism disorders. After adjusting for survey weights, Cox proportional hazards regression was employed to investigate the association between PTH levels and the risks of overall and CVD mortality among people with diabetes or prediabetes across different models. To enhance the precision of capturing and examining the intricate associations between PTH levels and mortality risks within the prediabetes cohort, we employed an advanced statistical approach. Through the utilization of two-piecewise Cox proportional hazards regression models, we were able to deconstruct the correlation between baseline PTH levels and mortality while considering the fluctuations in HR across varying PTH levels.
Weighted Kaplan–Meier survival curves were employed to demonstrate the cumulative probabilities of overall survival and survival free from CVD, stratified by three distinct ranges of PTH levels. This stratification facilitated a clear visualization of survival probabilities and the frequency of deaths at different follow-up time points, as outlined in the accompanying risk table. Following adjustment for all pertinent covariates, we employed restricted cubic splines (RCS) to graphically represent the non-linear relationship between PTH levels and the risks of mortality from all causes and CVD in individuals with diabetes or prediabetes. The RCS curves served to illustrate this intricate relationship, thereby augmenting our comprehension of the potential connection between differing PTH levels and mortality outcomes within these specific cohorts.
To evaluate possible differences in the correlation between PTH levels and the outcomes of interest, the study conducted subgroup analyses. Subgroups were delineated according to various clinical and demographic factors, including age, gender, ethnicity, educational level, BMI, smoking and alcohol habits, history of cancer, CVD, hypertension, physical activity level, and 25(OH)D levels. To enhance the validity of our results, sensitivity analyses were performed. Initially, deaths within the initial two-year follow-up period were excluded, followed by the exclusion of participants with a confirmed history of CVD or cancer. Furthermore, an analysis was conducted specifically on individuals who self-reported being free of CVD and cancer at the beginning of the study. The computational processes involved in this statistical analysis were performed utilizing R software, specifically version 4.2.2, which is made available by the R Foundation for Statistical Computing. To ascertain the statistical relevance of the findings, a cut-off criterion for the two-tailed p-value was set at a level of 0.05 or lower, indicating statistical significance.
Results
Baseline characteristics
In our study, a cohort of 2577 participants aged 20 years and above displaying hyperglycemia was examined, with 932 subjects diagnosed with diabetes and 1645 categorized as having prediabetes. The mean weighted age of the study population was 58.7 years for diabetes adults and 52.9 years for those with prediabetes. Among the participants, 44.42% of subjects with diabetes and 50.88% with prediabetes were identified as non-Hispanic white. We found that a history of CVD was present in 25.54% of diabetes subjects and 12.34% of those with prediabetes, while a cancer history was reported by 12.88% of participants with diabetes and 10.46% of people with prediabetes. The prevalence of 25(OH)D insufficiency was significantly higher in the hyperglycemia population, with 49.68% of diabetic subjects and 38.48% of people with prediabetes affected. Subjects were stratified into three groups (low, medium, and high-range) based on tertiles of PTH levels. When compared to those in the low-medium range of PTH, participants with diabetes in the high-range group showed characteristics such as older age, non-Hispanic black ethnicity, single marital status, obesity, and insufficient levels of 25(OH)D. They also had a higher prevalence of CVD. However, there were no significant differences observed in terms of gender, education level, family income–poverty ratio, alcohol and tobacco use, bone mass, physical activity, history of hypertension, hyperlipidemia, cancer, anemia, and HEI scores (Table 1).
Baseline characteristics of subjects.

Data were presented as n (%) for categorical variables and mean (standard error) or median (IQR) for continuous variables. All the continuous variables are normally distributed by the test of Q–Q diagram. All percentages and mean were adjusted for survey weights designed in NHANES. Range of PTH in diabetes subjects: Low: 18–34 pg/mL; Medium: 34–47 pg/mL; High: 47–74 pg/mL. Range of PTH in prediabetes subjects: Low: 18–36 pg/mL; Medium: 36–48 pg/mL; High: 48–74 pg/mL. p < 0.05 means statistical significance.
25(OH)D, 25-hydroxyvitamin D; BMI, body mass index; CRP, C-reactive protein; CVD, cardiovascular disease; HbA1c, glycated hemoglobin A1c; HEI, healthy eating index; PTH, parathyroid hormone.
Association of PTH levels with hyperglycemia status
In this study, a cohort of 3858 subjects exhibited normal glucose and PTH levels. Table 2 depicts the relationship between different PTH levels and the prevalence of diabetes and prediabetes in the sample. The low PTH group served as the reference point for comparison. The results indicated an inverse association between diabetes status and rising PTH levels, with a 10-pg/mL increase in PTH linked to decreased odds of diabetes (OR, 0.79; 95% CI, 0.73–0.86) after controlling for multiple factors. In contrast, after controlling for potential confounding variables, there was no statistically significant association between PTH levels and prediabetes status (OR, 0.97; 95% CI, 0.89–1.05). Initially, a positive correlation was observed between high PTH levels and both diabetes (OR, 1.31; 95% CI, 1.03–1.66) and prediabetes (OR, 1.53; 95% CI, 1.22–1.91) before adjusting for confounders. However, following adjustment for these variables, a negative relationship was found between high PTH levels and diabetes status (OR, 0.48; 95% CI, 0.37–0.64), while no significant association was detected with prediabetes status (OR, 0.97; 95% CI, 0.72–1.31).
Association of PTH levels with diabetes and prediabetes.
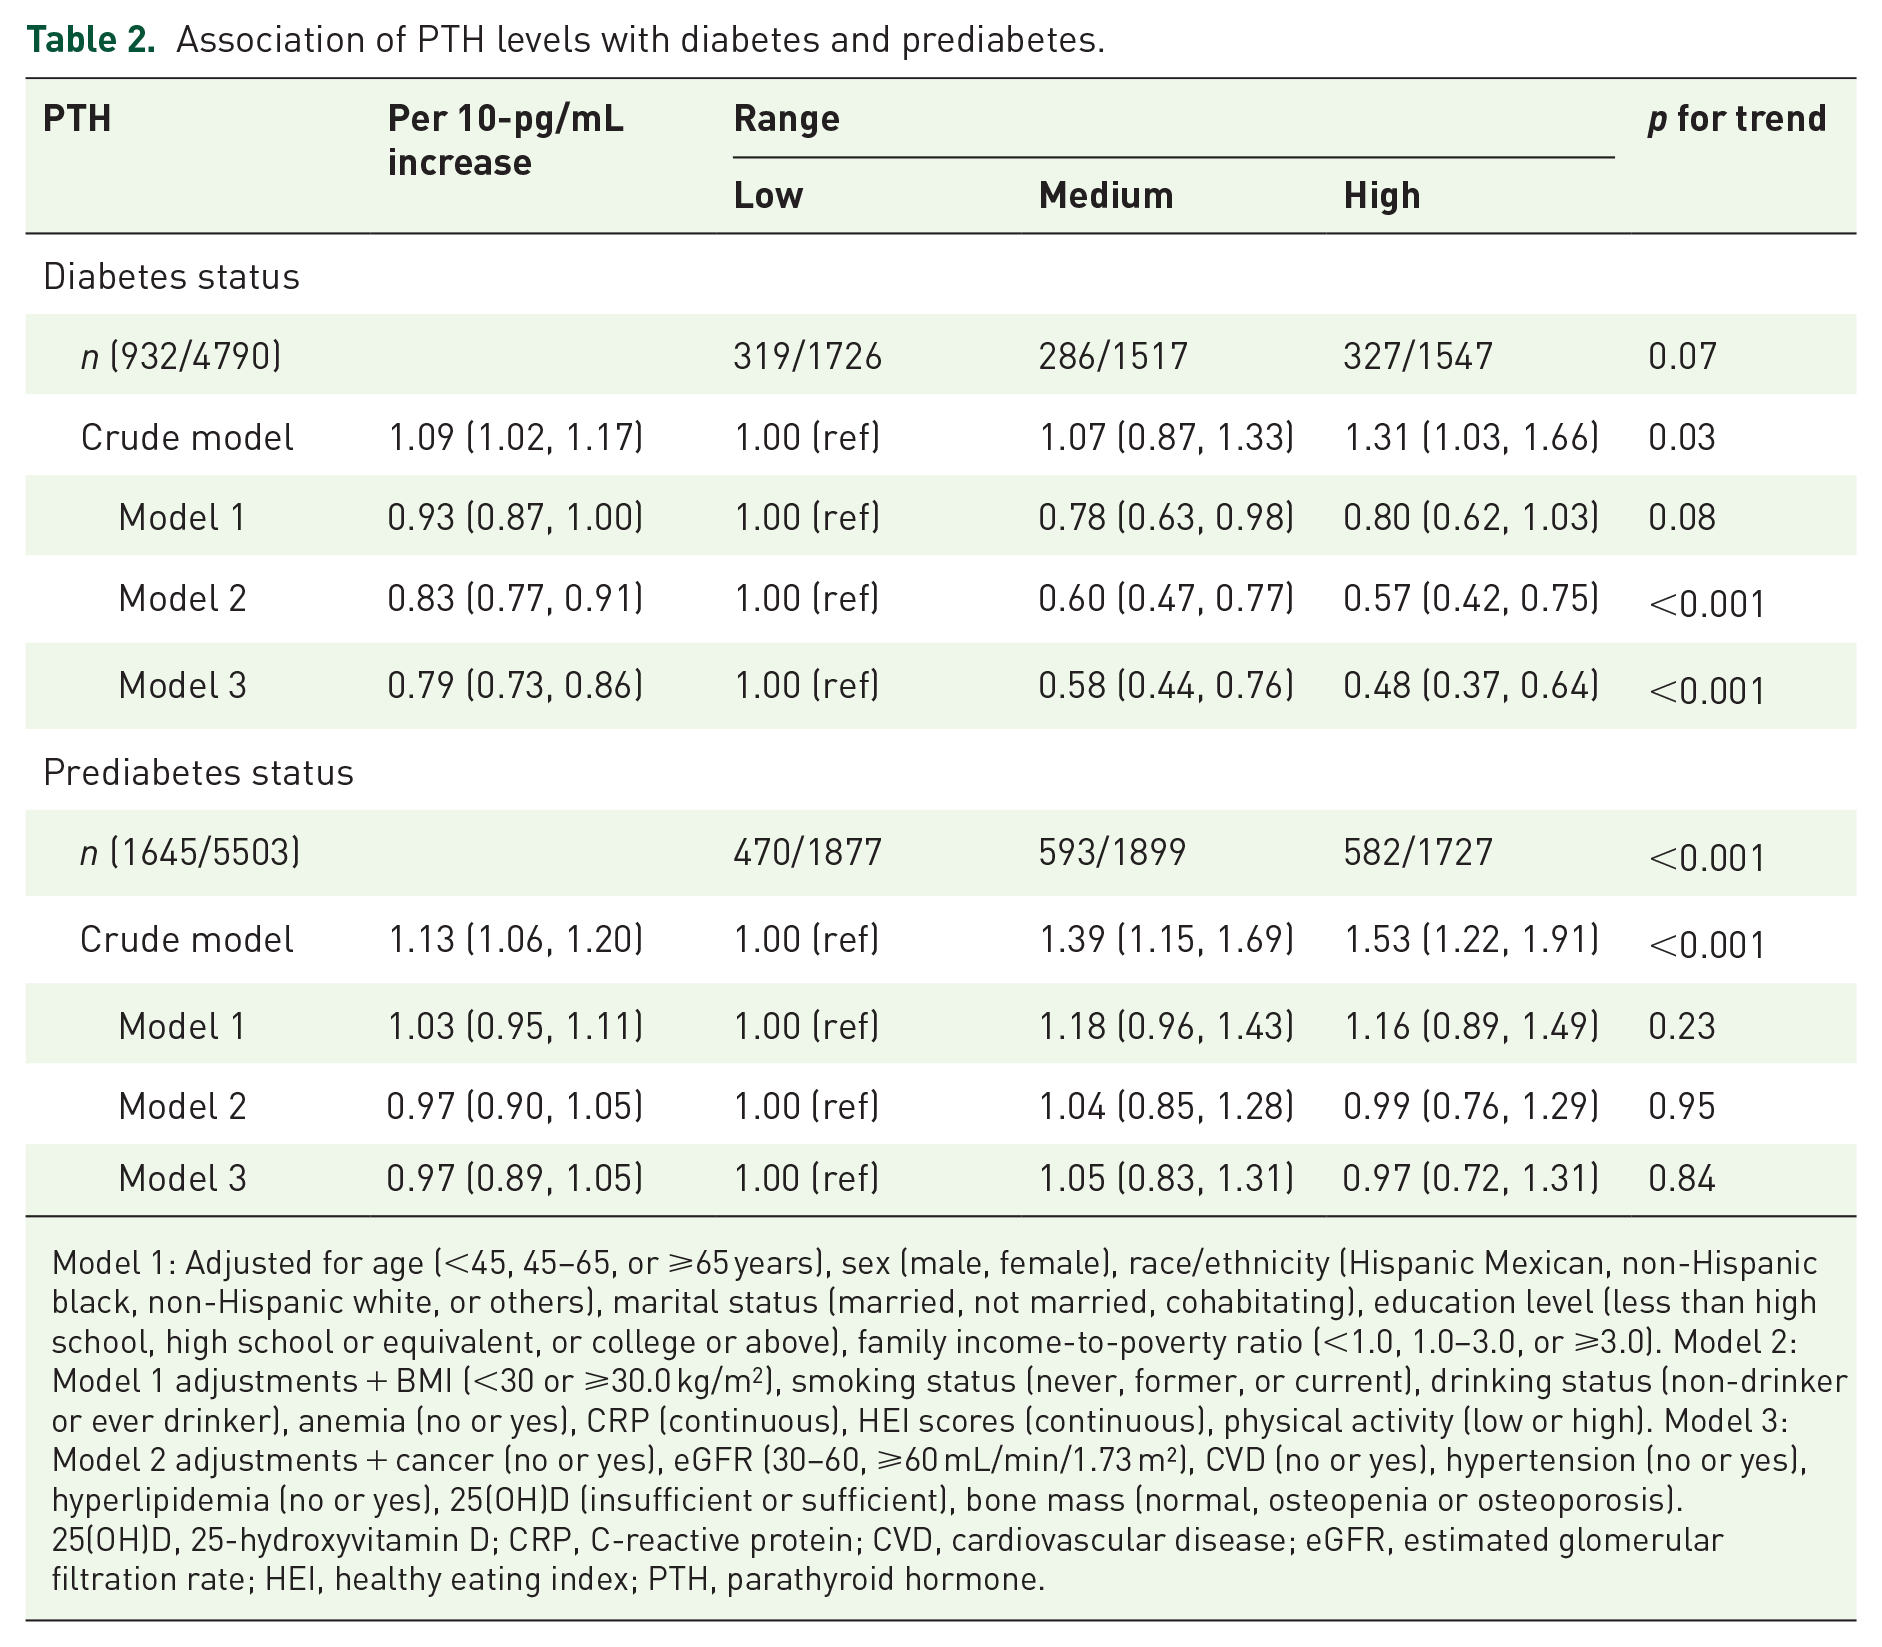
Model 1: Adjusted for age (<45, 45–65, or ⩾65 years), sex (male, female), race/ethnicity (Hispanic Mexican, non-Hispanic black, non-Hispanic white, or others), marital status (married, not married, cohabitating), education level (less than high school, high school or equivalent, or college or above), family income-to-poverty ratio (<1.0, 1.0–3.0, or ⩾3.0). Model 2: Model 1 adjustments + BMI (<30 or ⩾30.0 kg/m2), smoking status (never, former, or current), drinking status (non-drinker or ever drinker), anemia (no or yes), CRP (continuous), HEI scores (continuous), physical activity (low or high). Model 3: Model 2 adjustments + cancer (no or yes), eGFR (30–60, ⩾60 mL/min/1.73 m²), CVD (no or yes), hypertension (no or yes), hyperlipidemia (no or yes), 25(OH)D (insufficient or sufficient), bone mass (normal, osteopenia or osteoporosis).
25(OH)D, 25-hydroxyvitamin D; CRP, C-reactive protein; CVD, cardiovascular disease; eGFR, estimated glomerular filtration rate; HEI, healthy eating index; PTH, parathyroid hormone.
Correlation of PTH levels with mortality from all causes and CVD
Over a median duration of 7.8 years of observation, 407 adults with diabetes succumbed, with 136 fatalities attributed to CVD. Additionally, over 8.2 years, 448 adults with prediabetes passed away, with 150 cases linked to CVD. HR for all-cause and CVD mortality in three distinct PTH ranges among hyperglycemia subjects are detailed in Tables 3 and 4, with a low PTH range group serving as the baseline. Results indicate that individuals in the medium-high PTH range groups generally exhibited a poorer prognosis for both mortality from all causes and CVD compared to the reference group. We focus on the mortality of diabetes subjects with the top range of PTH. Prior to controlling for potential confounding variables, people with diabetes and high-range PTH levels were found to have a significantly higher risk of all-cause mortality (HR, 1.78; 95% CI, 1.25–2.55) and CVD mortality (HR, 2.80; 95% CI, 1.49–5.26). Upon adjusting for possible confounders, individuals with diabetes and high-range PTH levels continued to exhibit an increased risk of overall mortality (HR, 1.53; 95% CI, 0.99–2.34) and CVD mortality (HR, 2.98; 95% CI, 1.19–7.50). After adjusting for multiple variables, an increase of 10 pg/mL in PTH levels was found to be significantly associated with an elevated risk of all-cause mortality (HR, 1.13; 95% CI, 1.01–1.29) and CVD mortality (HR, 1.39; 95% CI, 1.05–1.84) in diabetes. Conversely, when examining the prognostic outcomes regarding both overall mortality and CVD-related deaths, no notable disparities were observed across the three distinct levels of PTH among individuals with prediabetes after adjustments. A discernible link was identified between a rise of 10 pg/mL in PTH levels and a heightened vulnerability to CVD-related mortality among those with prediabetes. This association was characterized by an HR of 1.22, with the 95% CI extending from 0.99 to 1.49. On the contrary, there was no significant association found between a comparable elevation in PTH levels and the overall mortality risk, as indicated by an HR of 1.05 and a 95% CI ranging from 0.96 to 1.15.
HR (95% CI) for all-cause and CVD mortality by range of PTH in diabetes subjects.

Model 1: Adjusted for age (<45, 45–65, or ⩾65 years), sex (male, female), race/ethnicity (Hispanic Mexican, non-Hispanic black, non-Hispanic white, or others), marital status (married, not married, cohabitating), education level (less than high school, high school or equivalent, or college or above), family income-to-poverty ratio (<1.0, 1.0–3.0, or ⩾3.0). Model 2: Model 1 adjustments + BMI (<30 or ⩾30.0 kg/m2), smoking status (never, former, or current), drinking status (non-drinker or ever drinker), anemia (no or yes), HbA1c (continuous), CRP (continuous), HEI scores (continuous), physical activity (low or high). Model 3: Model 2 adjustments + cancer (no or yes), eGFR (30–60, ⩾60 mL/min/1.73 m²), CVD (no or yes), hypertension (no or yes), hyperlipidemia (no or yes), 25(OH)D (insufficient or sufficient), use of antidiabetic drug (no or yes), use of hypotensive drug (no or yes), use of lipid-lowering drug (no or yes).
25(OH)D, 25-hydroxyvitamin D; CRP, C-reactive protein; CVD, cardiovascular disease; HbA1c, glycated hemoglobin A1c; HEI, healthy eating index; PTH, parathyroid hormone.
HR (95% CI) for all-cause and CVD mortality by range of PTH in prediabetes subjects.
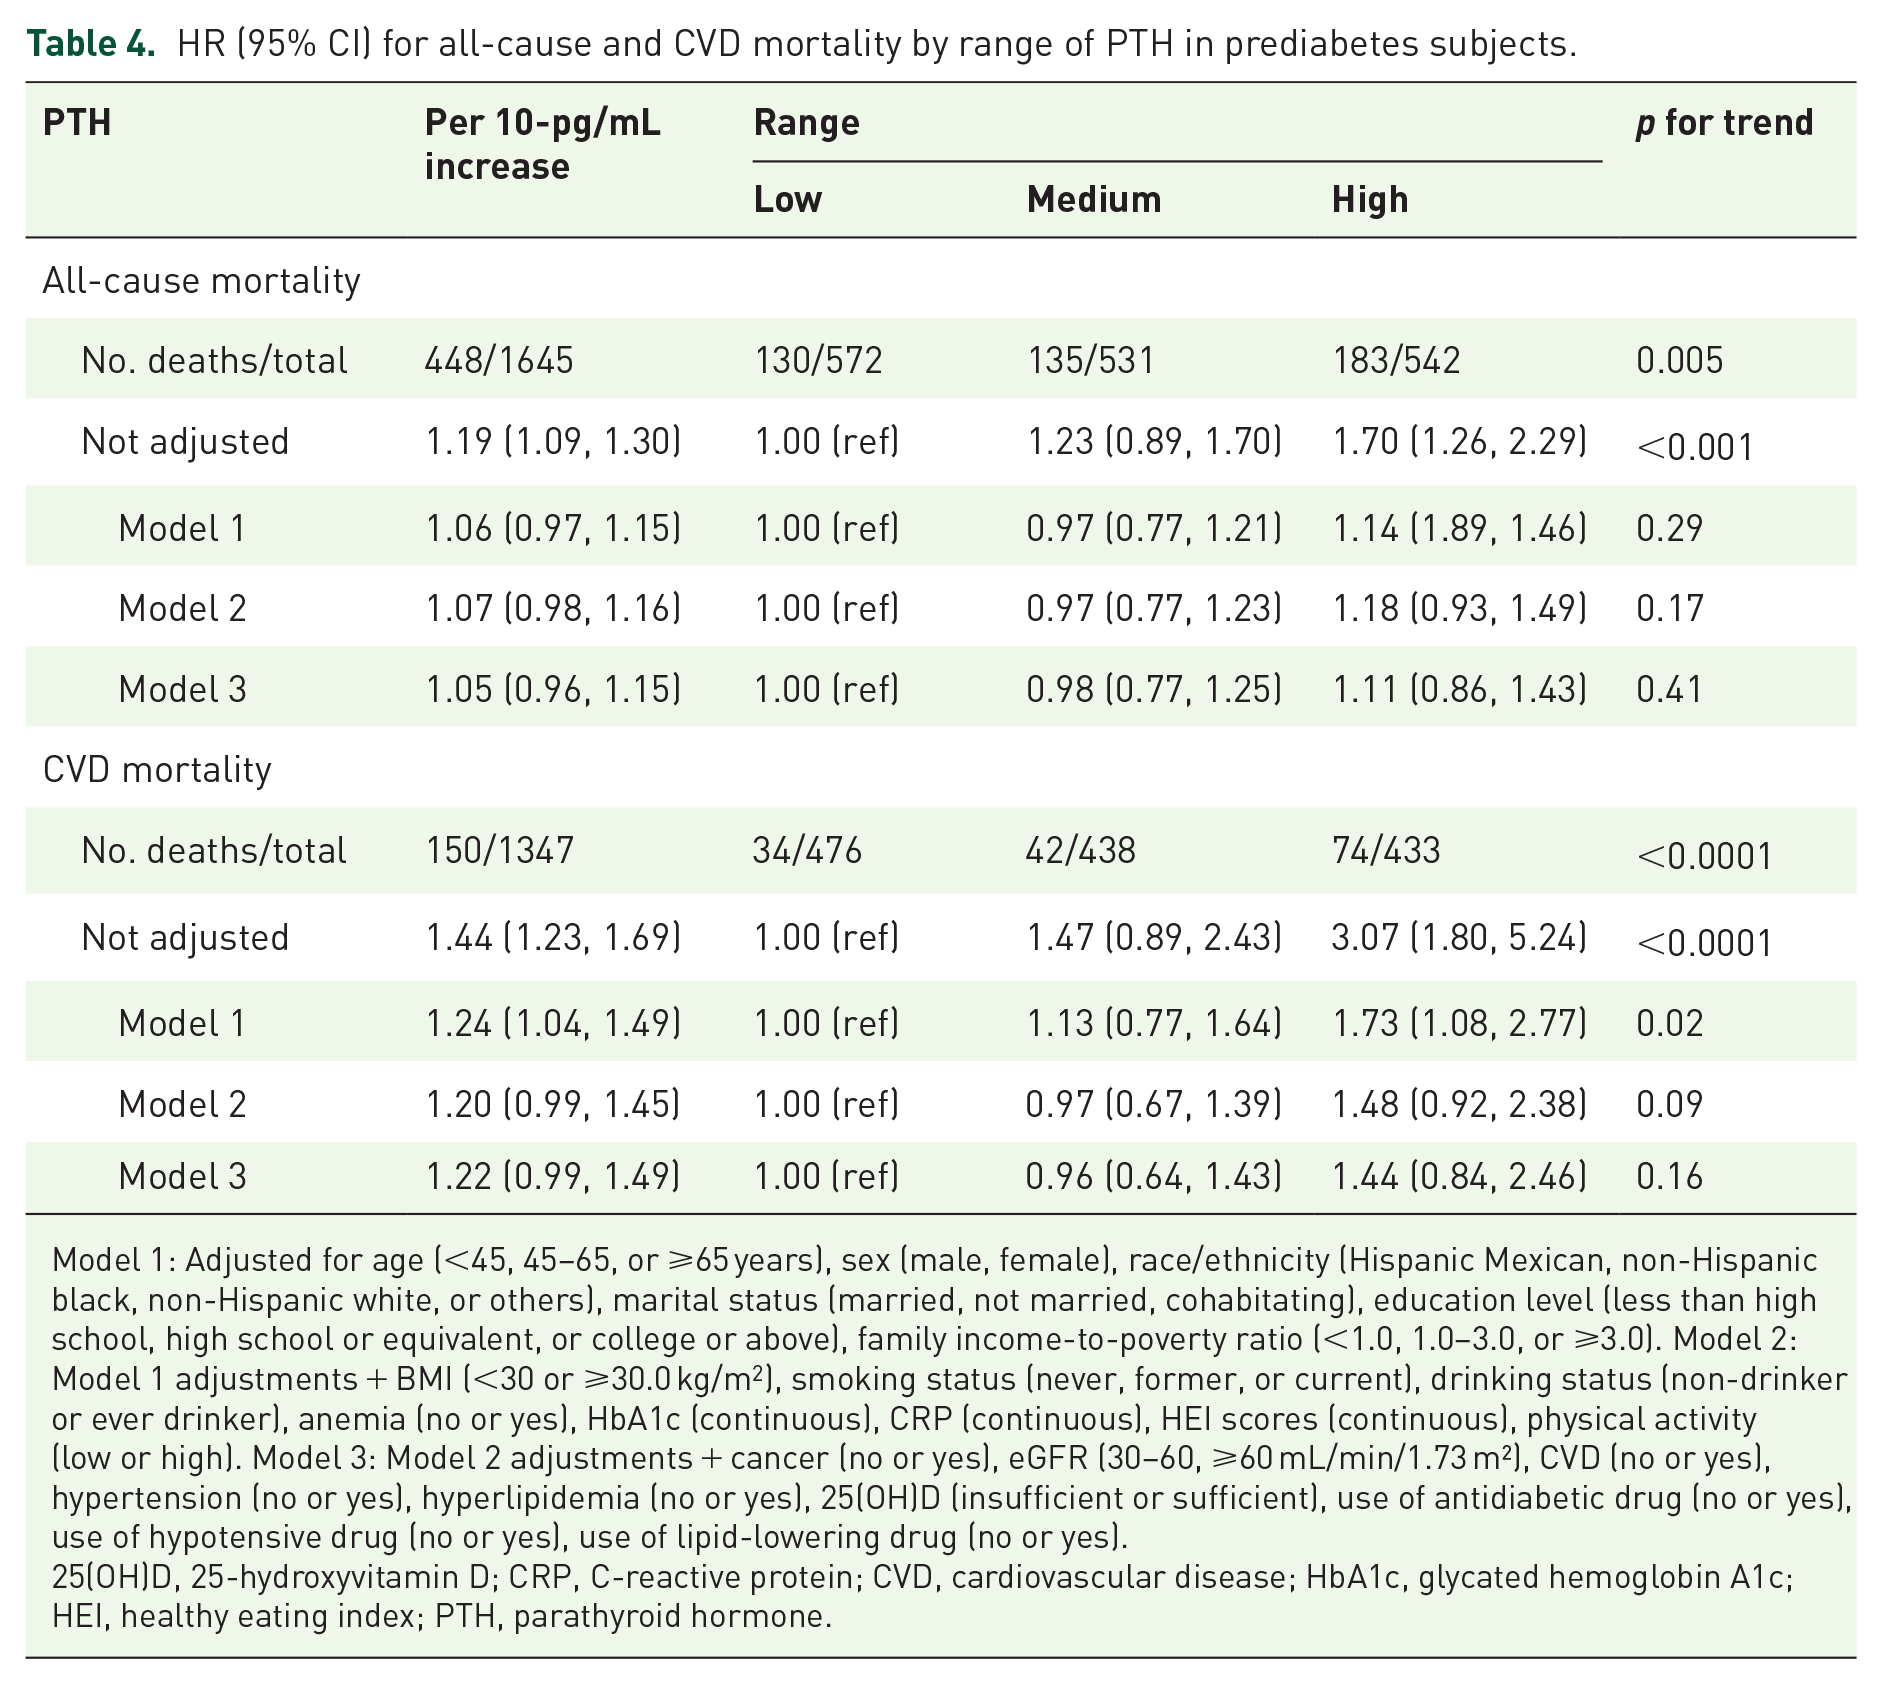
Model 1: Adjusted for age (<45, 45–65, or ⩾65 years), sex (male, female), race/ethnicity (Hispanic Mexican, non-Hispanic black, non-Hispanic white, or others), marital status (married, not married, cohabitating), education level (less than high school, high school or equivalent, or college or above), family income-to-poverty ratio (<1.0, 1.0–3.0, or ⩾3.0). Model 2: Model 1 adjustments + BMI (<30 or ⩾30.0 kg/m2), smoking status (never, former, or current), drinking status (non-drinker or ever drinker), anemia (no or yes), HbA1c (continuous), CRP (continuous), HEI scores (continuous), physical activity (low or high). Model 3: Model 2 adjustments + cancer (no or yes), eGFR (30–60, ⩾60 mL/min/1.73 m²), CVD (no or yes), hypertension (no or yes), hyperlipidemia (no or yes), 25(OH)D (insufficient or sufficient), use of antidiabetic drug (no or yes), use of hypotensive drug (no or yes), use of lipid-lowering drug (no or yes).
25(OH)D, 25-hydroxyvitamin D; CRP, C-reactive protein; CVD, cardiovascular disease; HbA1c, glycated hemoglobin A1c; HEI, healthy eating index; PTH, parathyroid hormone.
Weighted Kaplan–Meier survival curves were employed to illustrate the cumulative survival probabilities for both all-cause mortality and CVD outcomes, stratified by different levels of PTH. Statistical significance was observed in the comparison of low, medium, and high PTH levels with overall and CVD mortality (Figure 2). Following adjustments for relevant variables, participants with high PTH levels exhibited a poorer prognosis compared to those with lower PTH levels. The probability of survival over a 10-year period was calculated to be 66.28%, 81.02% for all-cause events, and 81.02%, 93.46% for cardiovascular events in the high range of PTH among diabetes and prediabetes individuals, respectively.

Weighted Kaplan–Meier survival curves show all-cause mortality for diabetes (a) and prediabetes (b) and CVD mortality for diabetes (c) and prediabetes (d) subjects according to PTH ranges. Range of PTH in diabetes subjects: Low: 18–34 pg/mL; Medium: 34–47 pg/mL; High: 47–74 pg/mL; Range of PTH in prediabetes subjects: Low: 18–36 pg/mL; Medium: 36–48 pg/mL; High: 48–74 pg/mL. The risk table was presented as numbers (weighted percentages) for cumulative survival.
The non-linear association between PTH levels and the risks of overall and CVD mortality in adults with hyperglycemia was precisely portrayed by the RCS curves, following comprehensive adjustments, as shown in Figure 3. Importantly, a significant association was observed between PTH levels and the aforementioned mortality endpoints, indicating a dose-response association for diabetes (p-value = 0.004 and 0, respectively) and prediabetes (p-value = 0.026 and 0.006, respectively). Furthermore, our research discovered a direct linear correlation between PTH levels and the mortality rates for all causes and CVD among people with diabetes (Figure 3(a) and (c)). This was demonstrated by the non-significant p-values for non-linearity observed within the diabetes cohort (p-value = 0.801 for all-cause mortality and p-value = 0.403 for cardiovascular mortality). Furthermore, the adjusted smoothed plots illustrated U-shaped relationships between PTH levels and both all-cause mortality (Figure 3(b)) and CVD mortality (Figure 3(d)) among individuals with prediabetes, which exhibited p-values of 0.036 for all-cause mortality and 0.038 for cardiovascular mortality.

Dose-response associations between PTH and all-cause mortality in diabetes (a) and prediabetes (b) and CVD mortality for diabetes (c) and prediabetes (d) subjects. The solid line and gray shading showed HRs and 95% CIs, respectively. Models were adjusted by age, gender, ethnicity, marital status, education, economic status, alcohol consumption, smoking habits, BMI, eGFR, HbA1c, CRP, HEI scores, physical activity levels, and the presence of CVD, hypertension, hyperlipidemia, cancer, anemia, and use of hypotensive drug and lipid-lowering drug. Both p-values for overall was 0. p-values for nonlinearity in diabetes and prediabetes subjects were 0.801, 0.036, 0.403, and 0.038, respectively. The use of antidiabetic drugs was adjusted additionally for diabetes subjects.
Subgroups and sensitivity analyses
Figures 4 and 5 display the results of the analyses conducted based on various demographic and health-related factors. There was no statistically significant relationship found between PTH levels and overall mortality, except when considering gender for diabetes and smoking status, as well as history of CVD for prediabetes. Additionally, there was no significant interaction observed between PTH levels and the aforementioned variables about overall and CVD mortality for prediabetes. Furthermore, 25(OH)D levels were found to have no impact on the association between PTH levels and adverse prognosis in both diabetes and prediabetes.

Stratified analyses were conducted to examine the link between PTH and all-cause mortality among individuals with diabetes (a) and prediabetes (b). The statistical models accounted for various factors including age, gender, ethnicity, marital status, education, economic status, alcohol consumption, smoking habits, BMI, eGFR, HbA1c, CRP, HEI scores, physical activity levels, and the presence of CVD, hypertension, hyperlipidemia, cancer, anemia, and vitamin D levels (25(OH)D). Additionally, the use of hypotensive and lipid-lowering medications was considered, with the exception of variables specific to each subgroup. For the diabetes group, the models also included adjustments for the use of antidiabetic medications.

Stratified analyses were conducted to examine the link between PTH and CVD mortality among individuals with diabetes (a) and prediabetes (b). The statistical models accounted for various factors including age, gender, ethnicity, marital status, education, economic status, alcohol consumption, smoking habits, BMI, eGFR, HbA1c, CRP, HEI scores, physical activity levels, and the presence of CVD, hypertension, hyperlipidemia, cancer, anemia, and vitamin D levels (25(OH)D). Additionally, the use of hypotensive and lipid-lowering medications was considered, with the exception of variables specific to each subgroup. For the diabetes group, the models also included adjustments for the use of antidiabetic medications.
After comprehensive adjustments, the relationship between high PTH levels and cancer mortality did not reach statistical significance in adults with diabetes (HR, 0.61; 95% CI, 0.25–1.44) or prediabetes (HR, 3.39; 95% CI, 0.78–14.71), as presented in Table S1a and b. Similarly, the association between high PTH levels and mortality from infectious disease was not statistically significant in individuals with diabetes (HR, 1.48; 95% CI, 0.94–2.32) or prediabetes (HR, 1.21; 95% CI, 0.89–1.66), according to the same tables. In the subset of participants who did not experience mortality within 2 years of follow-up, the adjusted HRs for overall and CVD mortality remained consistent in subjects with diabetes and prediabetes (Table S2a and b). For individuals without a prior cardiovascular condition, the adjusted HRs, when comparing high to low PTH levels, for both all-cause mortality (HR, 1.16; 95% CI, 0.78–1.73) and mortality specifically due to cardiovascular issues (HR, 2.18; 95% CI, 0.89–5.35) in people with diabetes, were determined to be statistically non-significant (Table S3a). The association between elevated levels of PTH and all-cause mortality was found to be statistically significant in people with prediabetes (HR, 1.44; 95% CI, 1.06–1.95). However, no statistically significant association was identified with cardiovascular mortality (HR, 1.79; 95% CI, 0.86–3.73), as presented in Table S3b. In the subset of adults who had not previously been diagnosed with cancer, the correlation between high levels of PTH and the risk of death from any cause (HR, 1.61; 95% CI, 1.05–2.48) as well as from CVDs (HR, 3.10; 95% CI, 1.28–7.49) was found to be statistically significant in diabetic individuals, as detailed in Table S4a. The association between elevated levels of PTH and CVD mortality was found to be statistically significant in adults with prediabetes (HR, 1.97; 95% CI, 1.12–3.48), but not in those without a specific cause (HR, 1.10; 95% CI, 0.81–1.49) (Table S4b). Among the participants free of a previous CVD or cancer, the adjusted HRs for mortality from all causes (HR, 1.23; 95% CI, 0.80–1.88) and CVD (HR, 2.51; 95% CI, 0.93–6.80) in those with diabetes did not reach statistical significance, as indicated in Table S5a. The study found a statistically significant correlation between elevated levels of PTH and increased mortality rates from all causes (HR 1.43; 95% CI 1.07–1.90) and CVD (HR 2.60; 95% CI 1.19–5.70) among individuals with prediabetes, as shown in Table S5b.
Discussion
PTH, in conjunction with vitamin D and calcitonin, plays a crucial role in the regulation of calcium and phosphate distribution within the skeletal system, as well as in the facilitation of calcium absorption in the intestines and phosphate excretion through the kidneys. 31 The concentration of calcium in the body exerts regulatory control over PTH secretion. Furthermore, vitamin D deficiency is associated with an abnormal increase in PTH levels, which in turn enhances calcium absorption in the intestines. 32 The association between reduced vitamin D activity and diabetes mellitus has been established in epidemiological studies. 33 This theory posits that people with hyperglycemia often exhibit elevated PTH levels. Given the high sensitivity of PTH to fluctuations in blood calcium and phosphorus levels, the presence of normal levels of these minerals significantly reduces the likelihood of PTH pathology. Yu and colleagues discovered that baseline PTH, rather than calcium or vitamin D levels, is the most accurate predictor of negative outcomes in untreated PHPT during long-term follow-up. 14 Therefore, we suggest that elevated PTH levels may serve as a reliable prognostic indicator for diabetics within a non-PHPT population exhibiting normal PTH levels, calcium levels, and phosphorus metabolism.
The analysis uncovered an inverse relationship between circulating PTH levels and the incidence of diabetes, with a significant 21% drop in the prevalence of diabetes for each 10 pg/mL increment within the normal PTH range. This inverse relationship was especially marked when considering PTH levels at the higher end of the normal spectrum (47–74 pg/mL). In this range, an even more substantial 52% reduction in the likelihood of diabetes was noted with every 10 pg/mL rise in PTH levels. Contrary to expectations, a notable correlation between the incidence of prediabetes and PTH levels was not observed. Genetic analysis conducted through a Mendelian randomization study indicated that PTH levels were not associated with the development of diabetes. 34 Past research on the relationship between serum PTH and diabetes has yielded inconsistent results. Two prospective investigations35,36 have demonstrated variations in this association across different racial groups, with elevated PTH levels in white adults being independently related to an increased risk of diabetes, while no such correlation was found in black adults. A separate prospective study conducted in an atherosclerotic population without diabetes at baseline found that each 1-pg/mL increase in serum PTH was linked with a 1% increase in the risk of diabetes. 37 In contrast to prior studies, the current research was conducted in a population with normal blood calcium and phosphorus levels, absence of renal failure, and PTH levels within the normal range, both with and without diabetes. The results of the correlation analysis in this study suggest that elevated PTH levels within the standard range may serve as a protective factor against diabetes. Theoretically, diabetic populations should commonly present with vitamin D deficiency and heightened PTH levels. However, this study found that elevated PTH levels within the normal range were associated with a reduced risk of developing diabetes. The underlying pathophysiological mechanisms remain inadequately understood. Patients with PHPT exhibit a three- to fourfold increased risk of developing diabetes compared to those without the condition.38,39 However, there is a paucity of research examining diabetic or pre-diabetic populations with PTH levels within the normal range. The interaction between PTH and pancreatic islets may be facilitated through the regulation of insulin secretion via the PTH/PTH-related protein receptor (PTH1R). 40 PTH has been demonstrated to enhance serine phosphorylation of insulin receptor substrate 1 in adipocytes, subsequently resulting in diminished glucose uptake. 41 However, this mechanism appears to be secondary to PTH-induced increases in intracellular calcium levels, as evidenced by both in vivo and in vitro studies. 42 The current study focused on a cohort comprising diabetic and pre-diabetic individuals with normal serum calcium and PTH levels, indicating an absence of parathyroid gland abnormalities. Consequently, the association between PTH and diabetes may not exhibit a positive correlation within this particular population as it does in the general population.36,37 After controlling for multiple confounding variables, including 25(OH)D, the inverse association between PTH levels and diabetes persisted, thereby offering substantial evidence of a strong relationship.
The survival analysis undertaken as part of the research revealed that, among the population with diabetes, a rise of 10 pg/mL in PTH levels was significantly correlated with an escalated risk of cardiovascular mortality by 39% and a heightened risk of all-cause mortality by 13%. The findings of this study underscore the critical impact of PTH levels on the cardiovascular and overall health outcomes for individuals with diabetes, emphasizing the importance of closely monitoring and regulating PTH levels within this group. The particular significance lies in the marked effect observed in individuals with PTH levels at the upper limit of the normal range, where a staggering 198% surge in CVD mortality risk and a 53% increase in overall mortality risk were reported. In contrast, within the population with prediabetes, a 10-pg/mL increase in PTH levels was linked to a 22% elevation in the risk of cardiovascular mortality. This indicates a more modest but still significant impact of PTH levels on cardiovascular health in this earlier stage of glucose intolerance. Interestingly, our study found no statistically significant alteration in the risk of cardiovascular or overall mortality linked with vitamin D deficiency in adults suffered diabetes or prediabetes. This suggests that while vitamin D plays a role in overall health, its deficiency does not markedly affect the negative outcomes related to PTH levels within the normal range for individuals experiencing hyperglycemia. The disparity in all-cause mortality risk among varying degrees of PTH in prediabetes became statistically significant in sensitivity analyses after excluding adults with underlying CVD. Excluding those with underlying cancer, the disparity in cardiovascular death risk among different levels of PTH in prediabetes becomes notable, implying a worse prognosis for cardiovascular death in this population. The prognostic significance of PTH levels varies among different segments of the general population. A forward-looking cohort study has revealed that within the elderly demographic, individuals presenting with increased PTH levels encounter a heightened risk of overall mortality, specifically a 53% rise when compared to their counterparts with more moderate PTH levels. 43 In contrast, some investigations have not found a substantial link between heightened PTH levels and the likelihood of cardiovascular or all-cause mortality among the elderly American population who do not have a history of cardiovascular illness. 44 In a community-based cohort study of elderly men, it was found that plasma PTH levels were a significant predictor of cardiovascular mortality, even in individuals with normal PTH levels. 45 The contrasting results for all-cause and cardiovascular mortality further highlight the need for a nuanced understanding of the role of PTH in health outcomes and the importance of considering a broad range of variables in future research. 46 Prior research examining the predictive impact of PTH on mortality has predominantly concentrated on individuals with parathyroid disorders. In contrast, the current study encompasses participants exhibiting normal ranges of calcium, phosphorus, and PTH levels. Notably, even within the normal PTH range, variations in PTH levels are significantly correlated with adverse prognostic outcomes. The poor prognosis associated with elevated PTH levels can be attributed to multiple factors. These include diminished bone mass, which increases the risk of fragility fractures 21 ; stimulation of mitotic activity in certain cancer types, notably prostate and colorectal cancers22,23; exacerbation of atherosclerosis; and an increase in ventricular hypertrophy, which can progress to heart failure,47,48 ultimately resulting in disability or mortality.
As this is an observational study, our analysis should be regarded as exploratory in nature. To date, no empirical evidence has demonstrated the potential clinical benefits of therapy for individuals with PTH levels within the normal range, and it is not possible to state a causal relationship between PTH and the onset of diabetes or death from our study. Overall, significant variations in prognosis among diabetic or prediabetic populations with varying degrees of PTH suggest the potential advantages of maintaining low PTH levels for long-term prognosis. Lowering targeted circulating PTH concentrations may potentially mitigate the unfavorable prognosis in hyperglycemic populations. Therapies that target the modulation of PTH levels, including the use of vitamin D supplementation and calcium intake, are readily available and can be integrated into clinical practice.49–51
As far as we are aware, this research marks the pioneering exploration of the prognostic significance of PTH within a demographic comprising individuals with diabetes or prediabetes. Our approach differs from previous research on PTH and its association with poor prognosis, which often relied on studies with lacked crucial information regarding participants’ lifestyle, comorbid conditions, serum calcium levels, serum phosphorus levels, vitamin D status, and PTH levels. In contrast, by employing the NHANES database, we are presented with a unique opportunity to effectively account for a range of confounding variables that were previously unaddressed. The primary limitations of our study are rooted in the cross-sectional correlation analysis we conducted, which did not include continuous monitoring of PTH levels to establish a baseline. Instead, it relied on the database we used that may not have offered a comprehensive representation of the participants’ PTH concentrations over time. The NHANES database predominantly comprises laboratory and interview data, yet it lacks detailed information regarding the specific medications taken by subjects, such as information on calcium and vitamin D intake. This limitation poses challenges in accurately categorizing the use of particular medications. Consequently, this study included only subjects with normal blood calcium, blood phosphorus, and PTH levels, thereby minimizing the potential influence of medications on PTH levels. Additionally, this study is constrained by factors such as a limited sample size, unidentified confounding variables, and potential categorization errors of variables during the interview process. Finally, power analysis for sample size calculation was not done due to the specific group of our study.
The present study indicates a negative association between PTH levels and diabetes status, suggesting that individuals with elevated PTH levels within the normal range are less likely to have diabetes. Furthermore, higher PTH values within the normal range in diabetic adults are linked to a worse prognosis, particularly in terms of CVD mortality.
Supplemental Material
sj-docx-1-tae-10.1177_20420188251328806 – Supplemental material for Association of serum parathyroid hormone within normal range with the prevalence and prognosis among adults with diabetes and prediabetes: insight from NHANES 2003–2006 data
Supplemental material, sj-docx-1-tae-10.1177_20420188251328806 for Association of serum parathyroid hormone within normal range with the prevalence and prognosis among adults with diabetes and prediabetes: insight from NHANES 2003–2006 data by Guangshu Chen, Li Che, Xueman Wen, Meizheng Lai, Ting Wei, Ping Zhu and Jianmin Ran in Therapeutic Advances in Endocrinology and Metabolism
Footnotes
Acknowledgements
We wish to express our heartfelt gratitude to Jing Zhang of the Second Department of Infectious Diseases at Shanghai Fifth People’s Hospital, for his substantial contributions to the NHANES database. His exceptional efforts in developing the nhanesR package and its associated website have greatly facilitated the exploration of the extensive data available within the NHANES database.
Declarations
Supplemental material
Supplemental material for this article is available online.
References
Supplementary Material
Please find the following supplemental material available below.
For Open Access articles published under a Creative Commons License, all supplemental material carries the same license as the article it is associated with.
For non-Open Access articles published, all supplemental material carries a non-exclusive license, and permission requests for re-use of supplemental material or any part of supplemental material shall be sent directly to the copyright owner as specified in the copyright notice associated with the article.