
Abstract
Background:
Exercise has been suggested to effectively improve cardiac performance in children with type 1 diabetes (T1D) by enhancing the glycemic control. The purpose of this study was to investigate (1) effects of a 12-week combined interval running and resistance training (CIRRT) and (2) 1 month of detraining on cardiac structure and myocardial performance in adolescent males with T1D.
Methods:
A total of 72 participants, including 48 adolescent males with T1D (fasting blood glucose (FBG): 274.67 ± 52.99 mg/dL, age: 15.20 ± 1.78 years) and 24 healthy adolescents (FBG: 90.75 ± 5.47 mg/dL, age: 15.08 ± 1.67 years), were recruited to the study. Participants were allocated into diabetes exercise (DE), diabetes control (DC), and healthy controls (HC) groups. The DE group performed 12 weeks of a CIRRT program three times per week. Blood glucose profile, echocardiography (ECHO) indices, and peak oxygen consumption (VO2peak) were measured pre- and post-intervention and following 1-month detraining period. Repeated measures ANOVA was used for pre- and post-intervention comparisons within the DE group and across the three study groups. Significance level was set at p < 0.05.
Results:
Exercise intervention resulted in decreased hemoglobin A1c (HbA1c% = Pre: 10.44 ± 2.03, Post: 9.38 ± 1.66, p < 0.05), FBG, left ventricular (LV) internal diameter, and both tricuspid and mitral deceleration time (DT) in the DE group. VO2peak, ejection fraction (EF% = Pre: 62.38 ± 1.6, Post: 64.08 ± 1.18, p < 0.05), fractional shortening, early tricuspid diastolic inflow E velocity, and tricuspid velocity during atrial contraction were also increased following the exercise training. HbA1c (Pre vs Follow-up: 9.83 ± 1.73, p < 0.05), EF (Pre vs Follow-up: 62.97 ± 1.56, p < 0.05), LV, and DT tricuspid remained significantly improved after detraining period compared to the baseline. In the baseline, the glycemic index and ECHO variable significantly differed in the DE and DC groups with the HC group (p < 0.05). However, after the intervention, the DC and HC groups did not change significantly (p > 0.05).
Conclusion:
The CIRRT intervention was associated with improved cardiac structure and performance in male adolescents with T1D potentially due to exercise-induced adaptations. Meanwhile, the results indicate that most cardiac morphological and functional changes are reversible following periods of inactivity in patients with T1D.
Introduction
Type 1 diabetes (T1D) is a chronic metabolic and endocrine condition with considerable subclinical complications. 1 Studies in adults with T1D have reported structural abnormalities of the myocardium and impaired performance. 2 In addition, significant changes in the dimensions of the ventricular cavity and myocardial relaxation 3 along with diastolic abnormalities 4 have been reported in young people with T1D. Diastolic dysfunction affects heart’s ability to relax during early diastole with subsequent changes to the ventricular filling patterns. This can lead to an increase in the left ventricular (LV) filling pressure during exercise and a decrease in end-diastolic volume. 5 The asymptomatic preclinical damage and abnormalities in the dimensions and performance of the myocardium may progressively lead to diabetes-related cardiomyopathy and heart failure in patients with T1D, 6 which may worsen with age. 7
The detectable functional abnormalities in diabetic cardiomyopathy begin with diastolic dysfunction, which may then progress to systolic dysfunction. 8 Thus, Doppler echocardiography (ECHO), in particular, has been used as a noninvasive tool to evaluate the filling of the ventricles and structural cardiac changes for early detection of the functional heart abnormality in T1D.9,10 Early detection of changes in heart structure and function in young patients with T1D may assist with the development of noninvasive interventions to prevent and control future complications.
Patients with T1D have a lower maximum oxygen consumption (VO2peak) compared to healthy people, making it a reliable and repeatable index for evaluating cardiorespiratory performance. 11 Previous studies in adults with diabetes suggest that physiological growth, myocyte size, pathological remodeling, LV wall compliance, contraction relaxation velocity, ejection fraction (EF), and cardiac output are improved with exercise in adults with T1D.12–14 This indicate that regular exercise may offer a non-pharmacological solution to prevent potential changes in cardiac function and performance in younger individuals with T1D due to its metabolic and physiological benefits, including enhanced regulation of the blood circulation (hemodynamic). 15
Yet, limited number of T1D patients engage in exercise due to the fear of hypoglycemia in aerobic exercise16,17 and hyperglycemia in resistance exercise 18 as well as insufficient knowledge about safe exercise interventions. Although various physical activities are recommended for T1D, 19 it appears that a suitable and safe exercise protocol for adolescents with T1D in terms of type, intensity, and duration with beneficial effects on glycemic control, cardiac performance, structure, and function has yet to be established. The main purpose of the present study was to investigate and compare cardiac structure and myocardial performance indices in adolescent males with T1D before and after 12 weeks of combined interval running and resistance training (CIRRT) using Doppler ECHO. Furthermore, the correlation between changes in the glycemic index and changes in the selected LV indices was determined.
Methods
Participants
Seventy-two adolescent males aged 12–18 years, including 48 with T1D and 24 healthy control (HCs), participated in the study. The study formed three age-homogeneous groups including diabetes control (DC—n = 24), diabetes exercise (DE—n = 24), and HCs (n = 24; Figure 1). Using G*Power software, we calculated the sample size necessary to achieve a power of 0.8 with an alpha level of 0.05. The numeric results indicate that for a one-way ANOVA with three groups and an effect size of 0.5, a minimum of 14 participants per group is required to achieve the desired power. However, we decided to use 24 participants per group to increase the power and robustness of our findings and to account for potential dropouts or missing data. 20 All participants were from student population in growth 3–5 stages of Tanner’s scale and considered inactive based on the number of daily steps (<5000 step/day).20,21 The study was approved by the Research Ethics Committee of Bu-Ali Sina University-Hamedan for humanities studies (IRCT202111031052926N1). Written informed consent was obtained from all participants or their parents as appropriate prior to participation in the study.
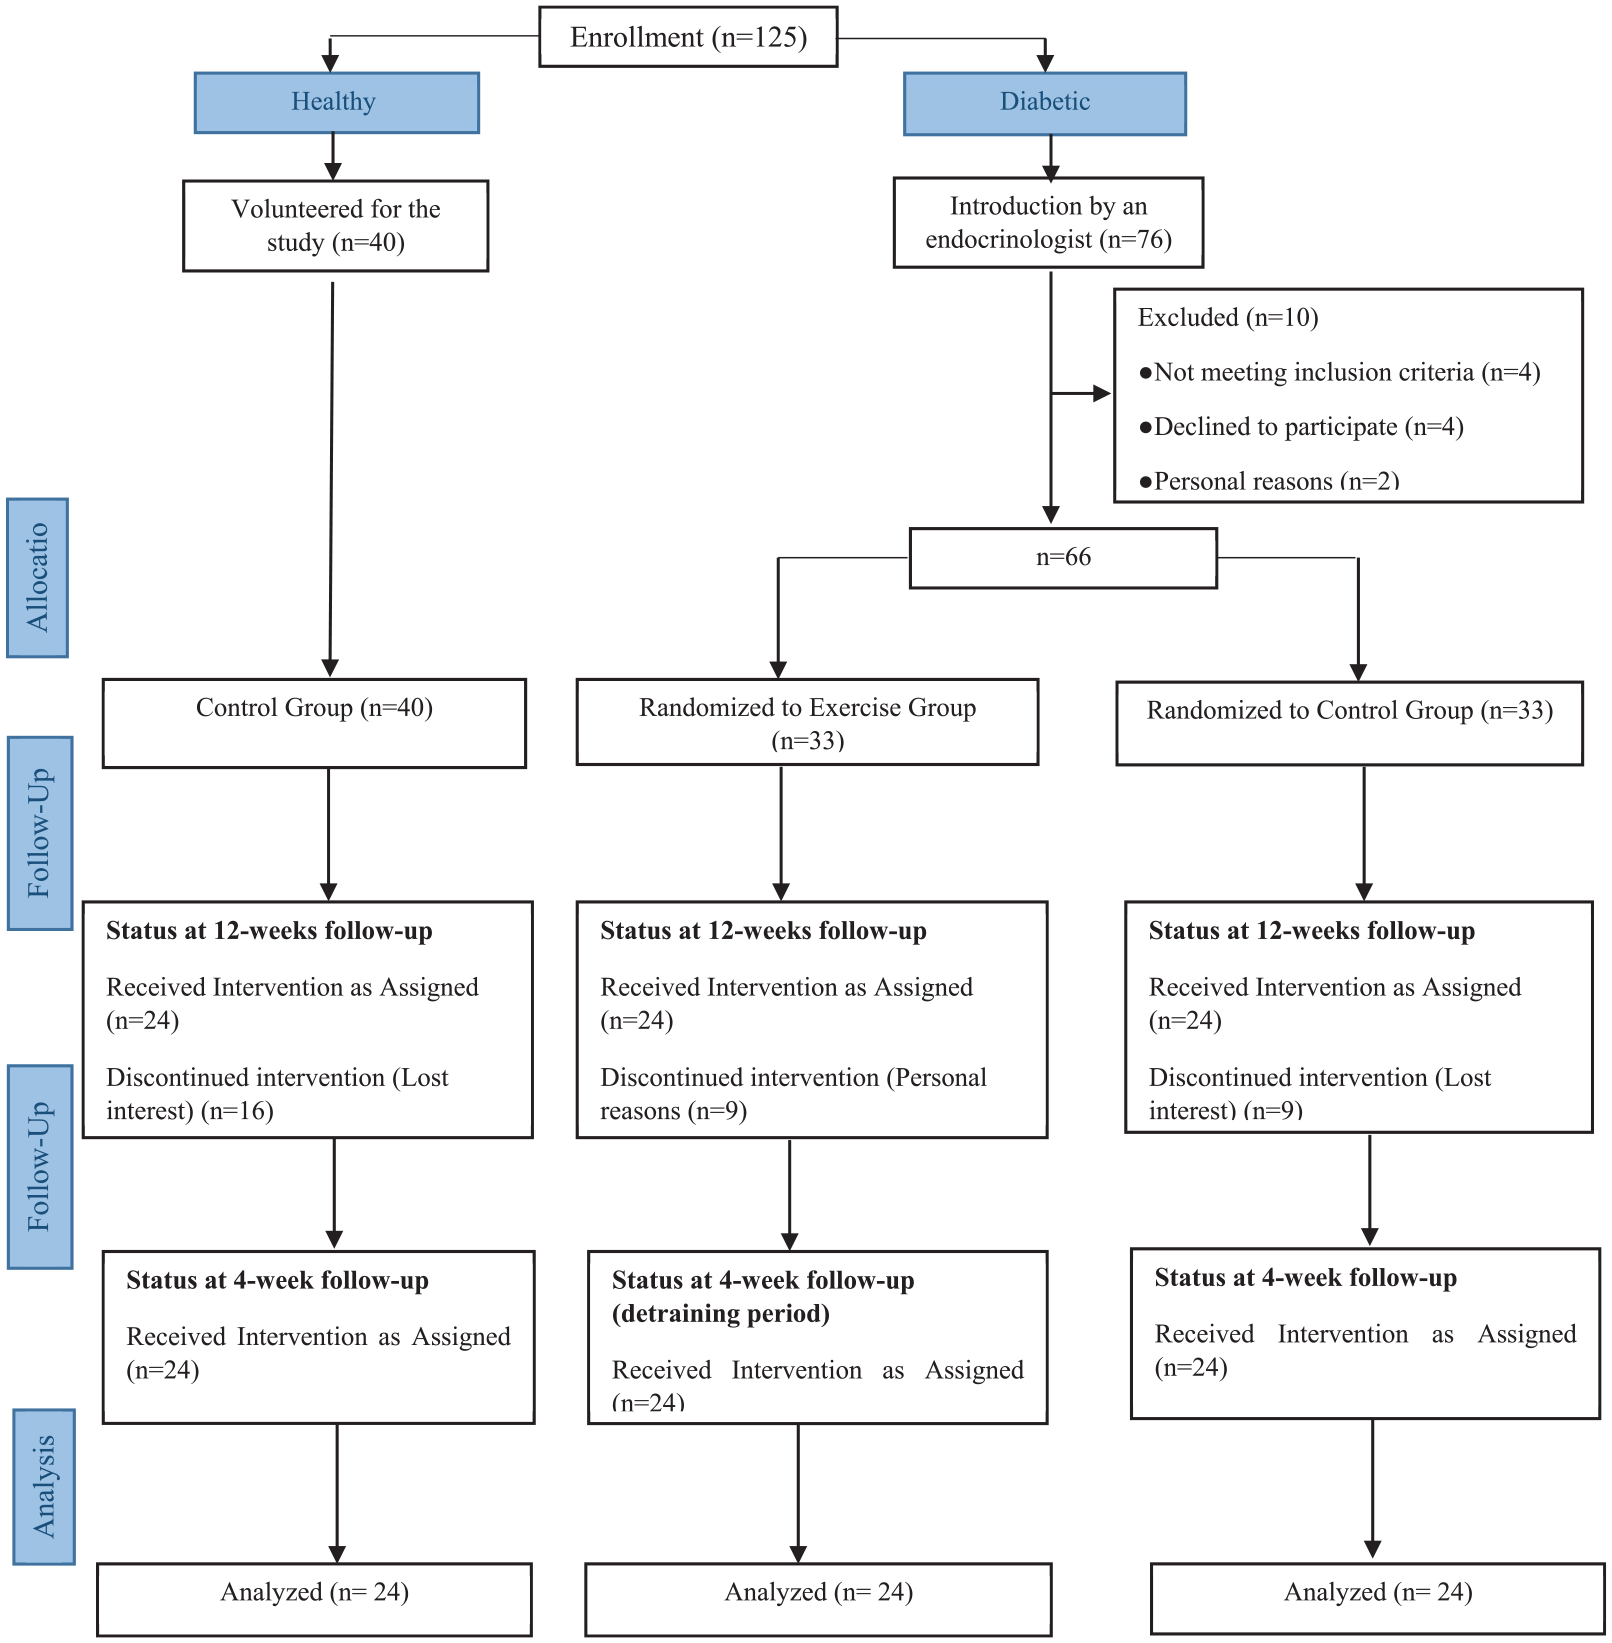
Study flowchart.
The inclusion criteria for participants with T1D included history of diabetes for at least 6 years, body mass index less than 25 kg/m2, fasting blood glucose (FBG) level at 8–9 am from 10 mL of right brachial vein blood sample over 130 mg/dL, and hemoglobin A1c (HbA1c) levels of over 7.5%. Those with history of cardiopulmonary disease, neuropathy, neuromuscular, or metabolic abnormalities, those receiving medications that affect heart function, and those non-compliant with exercise and nutrition programs were excluded from the study. Diabetes groups received daily insulin. The HC group includes healthy individuals with no systemic diseases who are not receiving any medications (Table 1).
General characteristics of subjects (mean ± SD).

BMI, body mass index; DBP, diastolic blood pressure; DC, diabetes control group; DD, diabetic duration; DE, diabetes exercising group; FBG, fasting blood glucose; HbA1c, hemoglobin A1c; HC, health control group; HDL-c, high-density lipoprotein cholesterol; HR, heart rate; LDL-c, low-density lipoprotein cholesterol; SBP, systolic blood pressure; SD, standard deviation; TC, total cholesterol; TG, triglyceride.
All participants were encouraged to follow a balanced and healthy diet under the supervision of a specialist and to record their daily energy intake (2091–2758 kcal/day). 22 DC and HC groups did not participate in the CIRRT program and continued their daily physical activity routine monitored with a pedometer. Regular exercise is expected to have a positive effect on ECHO prognostic factors in boys with T1D, and the adaptations to CIRRT to last after a 1-month non-training period.
Measurements
Metabolic tests
Glycemic changes were monitored with FBG measured after 12 h of overnight fasting and HbA1c at three time points (baseline, after completion of exercise training, and after 4 additional weeks of detraining) for three groups. Plasma glucose extracted from 10 mL blood samples (median cubital vein of the right arm) and centrifuged at 4–8°C with 4000 rpm for 10 min. HbA1c, FBG, low-density lipoprotein cholesterol (LDL-c), high-density lipoprotein cholesterol (HDL-c), total cholesterol (TC), and triglyceride (TG) were analyzed using commercial quality-controlled kits (LDN, Germany, Nordhorn) via the enzymatic method by Noble Laboratory in Isfahan, Iran. 23
Graded exercise test
A graded exercise test was conducted to evaluate aerobic capacity of the participants. The test was performed after 4 pm to avoid the morning effect of insulin administration. All participants in three groups underwent modified Bruce exercise testing protocol on a treadmill (XSCRIBE; TM65, Mortara, Italy) under controlled laboratory conditions (temperature: 19–21°C, humidity: 39%–43%, and 1860 m height above mean sea level). During the experiment, respiratory gases were collected through a facemask and analyzed by open-circuit calorimetry via ergospirometry (PowerCube; Carefusion, Höchberg, Germany). The modified Bruce protocol is commonly used to evaluate aerobic capacity in children and patients. 24 The target zone for the GXT was determined based on the ability to achieve ⩾85% (208−(0.7 × age in years)) threshold. 25 VO2peak was calculated using the Bruce equation and running time during the GXT. 26
Echocardiography
ECHO was performed on all participants three times (baseline, post training, and post detraining) in left lateral supine position using a General Electric system (MyLab Seven; Esaote, Italy, Genova) with probe 3 or 5 MHz (multi-frequency transducer) according to the age of participants. To ensure the reliability of measurement, it was conducted twice in each step, and the results were only confirmed if the difference between the repeated measurements was clinically acceptable. 27 The ECHO system was synchronized with an ultrasound machine to define timing of the cardiac cycle events. The examination was performed by a pediatric cardiologist in accordance with the recommendations of the American Society of Echocardiography. 28 The M-mode rest ECHO included standard dimensional measurements of the aorta (AO), left atrium (LA), right ventricular (RV), left ventricular internal diameter during diastole and systole (LVIDd and LVIDs), interventricular septum (IVS), left ventricular posterior wall (LVPW), fractional shortening (FS), and EF. Trans-mitral and trans-tricuspid flows were also obtained with pulsed wave Doppler at the leaflet tips to determine early diastolic inflow velocity (E), velocity during active atrial contraction (A), E to A wave (E/A) ratio, deceleration time (DT), and myocardial performance index (MPI). In order to improve the accuracy of calculations, M-mode ECHO variables were obtained in terms of body surface area. 29
Training program
The exercise intervention consisted of 12-week (3 days/week) CIRRT supervised by an exercise physiologist. All participants were prohibited from heavy physical activity 24 h before the training session. Three hours before starting each exercise session, blood glucose was measured three times at intervals of 1 h, every 30 min during exercise, and 2 h after exercise using a glucometer device (AgaMatrix; Jazz Wireless, USA, Rockingham), and symptoms of hypoglycemia or hyperglycemia until 12 h after exercise. 30 The training took place in the morning with awareness of blood glucose levels within the safe range (140–250 mg/dL). Each training session (outdoor grass pitch) started with 10–15 min of warm-up and stretching followed by 10–15 min of resistance training (RT) and 30–55 min of interval running training (IRT) ending with a 10-min cooling down period. 31 Participants were first instructed to perform RT to reduce the risk of hypoglycemia during IRT. 32 Appropriate weights were used to enable 6–12 repetitions with the 1RM calculated using the Holten chart. 33 The RT session included bodyweight exercises (lunges and push-ups) and strengthening workouts (leg press, bench press, leg extension, seated shoulder press, bicep curl, and triceps dips). Each training session was performed with three strength movements including: 3 sets of 8–12 repetitions in 30–45 s with 1–1.3 min of passive rest between sets. 33
IRT was carried out on good quality grass. DE group performed IRT for 30–55 min, 3 sessions a week for 12 weeks. For adaptation, IRT started with 30-min interval in the first week and gradually increased to 55 min by the 12th week. The protocol consisted of 3–6 intervals of 5-min running at 50%–75% heart rate reserve (HRR), followed by 4 min of active recovery at 10%–20% HRR between intervals. IRT started with three intervals in the first week and increased to six intervals in the 12th week. To maintain training intensity, heart rate (HR) was monitored during all training sessions using an HR monitor (Polar H10; Finland, Kempele). 34
During each session, exercise intensity was adjusted to remain within the prescribed HRR range. Furthermore, exercise volume was increased by 5% each week to prevent participants from becoming conditioned to the same routine. 35
Data analysis
Data normality analysis was determined by the Shapiro–Wilk test. ANOVA with repeated measures and Bonferroni’s post hoc tests were used to compare pre- and post-training changes in the DE, DC, and HC groups and across the study groups. The difference between the baseline stage and after 12-week intervention was calculated as (Δ1). The difference between the training intervention and the 1-month detraining was defined as (Δ2), and the difference between the baseline stage and the detraining period was determined as (Δ3). Pearson’s correlation was used to investigate the relationship between parameter changes in three stages. Data were analyzed using the SPSS software (Version 26, IBM Corp, Armonk, New York). Results presented as mean ± standard deviation (SD) where appropriate with the significance level set at p < 0.05. The graphs were drawn using GraphPad Prism 9.4.1 software with the formulas written in Microsoft Equation v. 3.1.
Results
Table 2 presents and compares anthropometric, metabolic, physiological, and structural data for all study groups across the three phases of baseline, training intervention, and detraining. The DC and DE groups received (28.08 rapid-acting, 27.16 basal), and (27.16 fast-action, 26.33 short-action) units of insulin injections per day under the supervision of an endocrinologist. Systolic blood pressure, diastolic blood pressure, and fat profile (TC, TG, LDL, and HDL) did not change significantly after exercise intervention in the three groups. Both DC and DE groups had lower VO2peak compared to HC (p < 0.005). No other differences were observed for any metabolic, physiological, or ECHO parameters between the DC and DE groups. EF was significantly lower in the T1D groups compared to HC (p < 0.05). No difference was observed for LVMPI between T1D groups and HC.
Subjects’ physiological, structural, and functional echocardiographic parameters in phases (baseline, 12 weeks, detraining periods).

Values are mean ± SD. All values are presented as (mean ± SD).
Significantly different with DC group.
Significantly different with DE group, p < 0.05.
Significantly different with HC group.
A, A wave velocity; AO, aorta; BMI, body mass index; DC, diabetes control; DE, diabetes exercise; DT, deceleration time; E, E wave velocity; EF, ejection fraction; FBG, fasting blood glucose; FS, fractional shortening; HbA1c (%), hemoglobin A1C; HC, healthy control; IVS, interventricular septum; LA, left atrium; LV, left ventricle; LVIDd, left ventricular internal dimension during diastole; LVIDs, left ventricular internal dimension during systole; MPI, myocardial performance index; PW, posterior wall; RV, right ventricle; SD, standard deviation; VO2peak, peak oxygen uptake.
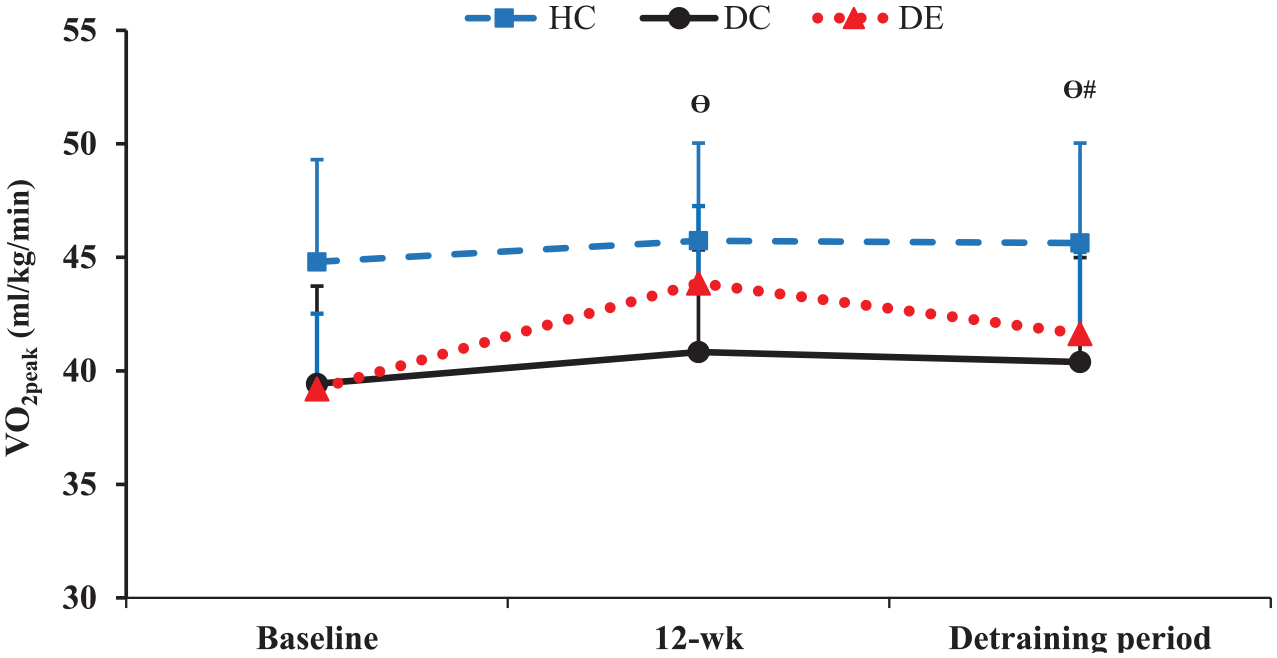
FBG showed a significant post-intervention decrease in the DE group but not after 1-month detraining (Figure 2). VO2peak improved significantly in the DE group following the 12-week training and then declined after 1-month detraining (p < 0.05) while still remaining considerably higher than the baseline values (Figure 3). There was no difference in VO2peak and E tricuspid parameters between DE and DC groups, and they returned to baseline status after the detraining.
Fasting blood glucose and HbA1c values with exercise training and detraining.

The changes pattern in VO2peak levels during the study period in three groups.
EF showed a significant increase after the training intervention and a substantial decrease after 1 month of detraining but still showed a considerable increase compared to the baseline (Figure 4). LVIDs, LVPW, and DT tricuspid magnitudes were higher in T1D groups than in HC (p < 0.05), whereas FS, E tricuspid, A tricuspid, and E mitral were lower in T1D than HC (p < 0.005). Other structural and functional variables, including AO, LA, RV, LVIDd, IVS, E/A ratio tricuspid, A mitral, E/A ratio, and DT mitral, were not different among the groups (Figure 5). FS and LVIDs parameters did not differ between DE and DC groups following the 12-week training program and detraining period.

The changes pattern in EF during the study period in three groups.

The changes pattern in LVIDd, LVIDs, tricuspid DT, and mitral DT during the study period in three groups.
Table 3 shows the correlations between selected parameter changes after 12 weeks of CIRRT intervention and 1 month of detraining in the DE group. After 12 weeks, HbA1c changes (Δ1) were correlated with LA, LVIDd, LVIDs, DT tricuspid, and DT mitral changes. After the detraining period HbA1c changes (Δ2) correlated only with DT tricuspid. From baseline to the end of the detraining period HbA1c changes (Δ3) were strongly correlated with LVIDd, LVIDs, and DT tricuspid.
Correlation between selected parameter changes after 12-week exercise and 1-month detraining in the DE group.

*, Significant correlation, r, Pearson correlation coefficient, p, p value. Δ1, changes between baseline and 12 weeks, Δ2, changes between 12 and 16 weeks, Δ3, changes between baseline and 16 weeks.
DE, diabetes exercise; DT, deceleration time; EF, ejection fraction; HbA1c (%), hemoglobin A1C; LA, left atrium; LV, left ventricle; LVIDd, left ventricular internal dimension during diastole; LVIDs, left ventricular internal dimension during systole; MPI, myocardial performance index.
EF changes (Δ1) showed a high correlation with changes in LA, LVIDd, LVIDs, DT tricuspid, and DT mitral. After 1 month of detraining, EF changes (Δ2) maintained correlation with DT tricuspid and DT mitral. From baseline to the end of the detraining period, the EF changes (Δ3) were highly correlated with LVIDd, LVIDs, and DT tricuspid.
LVMPI changes (Δ1) were significantly correlated with LVIDd, LVIDs, DT tricuspid, and DT mitral changes. After 1 month of detraining, the correlation between LVMPI changes (Δ2) was maintained only with DT tricuspid. From the baseline to the end of the detraining period, LVMPI changes (Δ3) were significantly correlated with LVIDs, and DT mitral.
Discussion
The study investigated the effect of a CIRRT intervention and 1-month detraining in adolescent males with T1D. Exercise program intervention resulted in a lower glycemic profile (FBG and HbA1c) and higher VO2peak in T1D patients which persisted after a month of detraining.
The present study focused on the assessment of the structure and performance of the LV given the sensitivity of this variable to inactivity and exercise. 36 In the baseline condition, of the study, Doppler ECHO during active atrial contraction and diastolic inflow indicated considerably lower FS, EF, E mitral, LVMPI, E and A tricuspid variations and significantly higher LVIDs, PW, and DT tricuspid values in T1D compared to the HCs. However, there was no difference in the blood flow velocity index. Previous studies have reported alterations in the dimensions and performance of the heart after 6 years, 37 which is in line with findings of the present study. The scientific findings indicated that chronic hyperglycemia in the early stages of cardiac abnormalities is associated with endothelial dysfunction, filling period and relaxation of ventricles and atria, prolonged time or incomplete filling of the ventricles, and microvascular disease. 38 Cardiac abnormalities can also manifest with pathological myocardial hypertrophy and a reduced LV function in systole and diastole, although these abnormalities may be independent of blood pressure changes and ischemic heart disease. 39
In the present study, the 12 weeks of CIRRT resulted in significant improvements in ECHO variables (i.e., LVIDd, LVIDs, FS, EF, tricuspid E, tricuspid A, tricuspid DT, and LVMPI variables). However, the effects of such an exercise intervention were maintained during detraining with regard to LVIDd, LVIDs, DT tricuspid, EF, and LVMPI. Previous studies have shown that the differences in cardiac performance of individuals with and without diabetes are very small in the absence of obvious contractile dysfunction in rest condition. Hence, the main determinant of cardiac performance during exercise intervention may be the resting stroke volume and LV contractility state, 40 which may be related to subclinical abnormalities in the structure of the heart.
In prior studies, exercise training programs in T1D have been associated with increased capillary density and skeletal muscle blood flow, 15 oxidative capacity, blood volume, 41 baroreflex sensitivity, and endothelial performance, 42 and decreased resting cardiopulmonary activity and blood pressure. 43 Furthermore, regular physical activity specifically causes the release of norepinephrine levels in the circulation system, which acts as a main factor in stimulating glucose uptake by tissues in the absence of insulin performance. 44 This study found that an improvement of LVIDd and LVIDs and reduction of filling time of LV could lead to improvements in LV EF and subsequent favorable cardiac reconstruction following training. This functional improvement may result from a significant increase in end-diastolic LV (Frank-Starling mechanism) filling volume along with ventricular and atrial morphological adaptations that support cardiac relaxation. These observations are consistent with the study by LaMonte and Eaton. 45 Rawshani et al. 46 and Zhao et al. 6 suggested that abnormality in the heart dimensions and performance of T1D people is due to aortic valve abnormality and pathological hypertrophy of ventricles and atria at rest. Bezen et al. 47 found a direct relationship between the growth of the end-diastolic LV thickness diameter and the diameter of PW with the glycemic index in adults with T1D, but no significant relationship was reported between the others LV parameters and glycemic index.
Traditional interventions for enhancing heart structure and function have not been effective and trending treatments mainly target drug therapy.48,49 According to the present study, if heart dysfunction in adolescents with T1D is due to high blood glucose fluctuations, relative cardiac atrophy, or pathological hypertrophy, caused by an inactive lifestyle, common intervention may not be effective. Regular supervised exercise activity could be considered as a reliable intervention in managing the structure and function of the heart, 50 potentially due to direct stimulation of the nervous system and underlying mechanisms. The data from the present study suggest a marked reduction in heart structure and function profile in T1D patients with poor glycemic control compared to HCs. Furthermore, findings support the prescription of regular exercise with relatively durable effects as an effective method for the control and management of primary structural abnormalities and reduced performance in adolescent males with T1D.
According to previous reports, blood glucose fluctuations are correlated with endothelial disorder and heart function abnormalities and an inverse relationship with functional capacity (VO2peak). 51 In contrast to previous investigations, the present study found a high association between poor glycemic profile and reduced VO2peak and subclinical cardiac function abnormalities in T1D.52,53 This could be explained by the differences in the participants of this study and some previous studies in terms of age, body mass, duration of diabetes, comorbidities and socioeconomic status, exercise intensity, lifestyle, and volume of exercise training and nutritional status. 54 Furthermore, controlling for some intervening variables, such as obesity, high-calorie diet, additional cardiovascular risk factors, and less exercise participation, allowed a better assessment of the relationship between cardiac structural abnormalities, VO2peak, and glycemic variables.
Although several researchers found no correlation between glycemic measures like FBG and A1C and VO2peak and heart structure,55,56 the majority of them reported an inverse significant relationship between glycemic and VO2peak.57–59 Scott et al. 60 compared intense and moderate and long-term exercises for 6 weeks (3 times/week) in T1D patients and reported improved VO2peak and aortic pulse wave velocity by more than 10% in both groups; however, the moderate intensity and prolonged exercises group faced a greater drop in glycemic indices that concur with our finding.
Strengths and limitations
The current study performed a comprehensive evaluation and comparison of the cardiac structural and functional characteristics of adolescent males with and without T1D. Further investigation explored the effect of 12 weeks of RIT on the glycemic indices, VO2peak, heart structure, and function in T1D aiming to provide further evidence for non-pharmacological management of the condition as well as preventing and controlling cardiac problems in this population. The study had some limitations. First, while there are reports of gender-related differences in glycemic control (i.e., poorer glycemic control in females with T1D), the study exclusively investigated male participants. This was mainly due to obvious gender-related differences in the structure and function of the heart in adolescence and gender-specific clinical diagnostic criteria leading to the focus of research on male patients. 61 Second, even though all participants were encouraged to maintain a balanced diet prior to and during their participation in the study supervised by a nutritionist, the study did not control the participants’ dietary intake and eating patterns by means of diet diaries and surveys. Finally, controlling cognitive decrements and psychological status could have enhanced the interpretation of the outcome of the intervention.
Conclusion
T1D cohorts showed primary heart structural abnormalities, decreased performance, and reduced VO2peak compared with HCs. Inactive lifestyle and pathological and subclinical heart abnormality were associated with a lower VO2peak. The study findings suggest that CIRRT may be considered as an effective modality for managing T1D by enhancing the glycemic profile and imposing beneficial effects on the cardiac structure and performance. Future studies of investigating the linear or curvilinear regression patterns among LV ECHO parameters using a larger sample size are needed. Future research should also examine the effects of exercise protocols of higher duration and increased volume of the interval submaximal RT along with enhanced control of the daily energy consumption.