
Abstract
Background:
Continuous glucose monitoring (CGM) with minimally invasive devices plays a key role in the assessment of daily diabetes management by detecting and alerting to potentially dangerous trends in glucose levels, improving quality of life, and treatment adherence. However, there is still uncertainty as to whether CGMs are accurate enough to replace self-monitoring of blood glucose, especially in detecting episodes of hypoglycemia.
Objectives:
Evaluate clinical, numerical accuracy, sensitivity, and specificity of the CGM devices commercially available when compared to the reference standard of arterial or venous blood glucose.
Data sources and methods:
We searched the Cochrane Library, PubMed, EMBASE, and LILACS databases. The quality was assessed with the Quality Assessment Diagnostic Accuracy Studies (QUADAS-2) tool. Clinical and numerical accuracy data were extracted. Sensitivity and specificity were calculated using Review Manager software. Heterogeneity was assessed by visual examination of forest plot and summary receiver operating characteristic curves.
Results:
Twenty-two studies with a total of 2294 patients were included. The average mean absolute relative difference for overall diagnostic accuracy was 9.4%. None of the devices evaluated with ISO 15197:2013 criteria achieved values ⩾95% of measurements in the stipulated ranges in hypoglycemia (±15 mg/dL), but two devices did achieve it in hyperglycemia (±15%; Dexcom G6 and G7). Most of the devices evaluated with consensus error grids reached values above 99% in zones A and B only in overall accuracy and hyperglycemia. For hypoglycemia, the average sensitivity was 85.7% and specificity 95.33%, and for hyperglycemia was 97.45% and 96% respectively.
Conclusion:
Currently available CGM devices have adequate accuracy for euglycemia and hyperglycemia; however, it is still inadequate for hypoglycemia, although it has improved over time.
Trial registration:
Prospero registration ID CRD42023399767.
Introduction
Glucose monitoring is essential to assess glycemic control and optimize treatment. Strategies have evolved from self-blood glucose monitoring (SBGM) to noninvasive and minimally invasive continuous glucose monitoring (CGM) devices,1,2 that have opened new horizons in the daily management of diabetes, improving quality of life and adherence to treatment by detecting hypoglycemic and hyperglycemic events not visible by SBGM and providing alerts on potentially dangerous trends in glucose changes, allowing the patient to take preventive measures.3–5 In addition, a significant reduction in HbA1c has been demonstrated in CGM users in both type 1 diabetes mellitus (TDM1) and type 2 diabetes mellitus (TDM2; −0.26% to −0.40%), and the percentage of patients achieving HbA1c <7% and <8% is higher in CGM users.6–9 A systematic review and meta-analysis also showed an effect on time-in-range (TIR), with a 5.4% absolute increase in TIR among CGM users. 6
Karter et al., 9 showed that hypoglycemia rates decreased from 5.1% to 3.0% among real-time CGM initiators and increased from 1.9% to 2.3% among non-initiators (difference-in-differences estimate: −2.7%; 95% CI: −4.4 to −1.1; p = 0.001), with no statistically significant difference in rates of hyperglycemia or hospitalization for any reason. Similar data were found by Reaven et al., 8 where CGM initiation was associated with significantly reduced risk of hypoglycemia (hazard ratio (HR): 0.69; 95% CI: 0.48–0.98) in patients with TDM1, however in this study they also find a reduction in all-cause hospitalization in TDM2 and TDM1, HR: 0.75; 95% CI: 0.63–0.90 and HR: 0.89; 95% CI: 0.83–0.97, respectively. As a result, current guidelines recommend CGM as the preferred method of glucose monitoring for all patients with T1DM and T2DM on intensive insulin therapy or at high risk for symptomatic or asymptomatic hypoglycemia.10,11
After the first approval of CGM devices by the US Food and Drug Administration (FDA) in 1999, it was cautioned that they could not be widely recommended due to certain limitations, such as the need for multiple calibrations per day, high cost, complications at the sensor insertion site, and inaccuracy of measurements with high false-positive and false-negative rates. 12 Although most of these limitations have been overcome by the new devices available, with a 30% increase in use since 2016, 13 there is still uncertainty as to whether CGMs are accurate enough to replace self-monitoring of blood glucose (SMBG), especially in detecting episodes of hypoglycemia. 14 Teo et al., 7 found that CGM had no effect on the number of severe hypoglycemic events (p = 0.13) or diabetic ketoacidosis events (p = 0.88).
Comparison of the various minimally invasive CGM sensors is complicated by the lack of standardized protocols and methodologies for assessing and reporting CGM accuracy and performance, 15 resulting in a lack of consistency in the metrics reported across studies to assess accuracy.16–19 Some report sensitivity and specificity to assess accuracy in detecting episodes of hypoglycemia and hyperglycemia, while others report it through numerical accuracy such as MARD (mean absolute relative difference), MAD (mean absolute difference),20,21 and clinical accuracy measures such as error grids (Clarke, consensus, continuous, surveillance).22–25 The International Organization for Standardization (ISO) 15197:2013 provides guidance on the criteria that devices must meet. The minimum acceptable criteria are that 95% of glucose monitoring system results are within ±15 mg/dL of the values measured by the reference method when glucose concentrations are <100 mg/dL (based on the difference between paired measurements), or within ±15% when glucose concentrations are ⩾100 mg/dL. For measures of clinical accuracy that describe the probability of making a correct treatment decision based on the assessed test result, 99% of pooled results should fall within zones A and B for the consensus error grid 26 or above 95% for the Clarke grid. 22
The aim of this systemic review is to evaluate the numerical and clinical accuracy of the different minimally invasive CGM devices currently commercially available in global glycemia, hypoglycemia, and hyperglycemia ranges, as well as to evaluate the sensitivity and specificity for detecting episodes of hypoglycemia and hyperglycemia when compared to a reference standard of venous or arterial blood glucose in patients with T1DM and T2DM.
Methods
A systematic review of diagnostic test studies was performed. The protocol was registered in PROSPERO (International Prospective Register of Systematic Reviews) ID CRD42023399767.
Data search and sources
The literature search was performed on December 1 2022 and was updated in July 2024 in the Cochrane Library, PubMed (MedLine), EMBASE (Elsevier), and LILACs databases, restricting the search to studies published in English and Spanish and date from January 1, 2018, to July 1, 2024. Search terms can be found in Supplemental Material (Supplement 1).
Study selection
We included prospective studies in adults and/or children with T1DM or T2DM that evaluated the numerical accuracy, clinical accuracy, sensitivity, and specificity of minimally invasive CGM sensors for detecting hypoglycemia or hyperglycemia events compared with the reference standard (venous or arterial blood glucose). Gestational diabetes, cystic fibrosis-related diabetes, studies in exercise, critically ill or hospitalized patients, and those in which the reference test was exclusively capillary glucose were excluded. In vitro studies and those performed in species other than humans also were excluded.
The sensors included were those commercially available in 2024: FreeStyle Libre 2 (Abbott Diabetes Care, Alameda, CA, USA), FreeStyle Libre 3 (Abbott Diabetes Care, Alameda, CA, USA), Eversense (Senseonics, Inc., Germantown, MD, USA), Eversense XL (Senseonics, Inc., Germantown, MD, USA), Guardian Sensor 3 (Medtronic Diabetes, Northridge, CA,USA), Dexcom G4 Platinum (Dexcom Inc., San Diego, CA, USA), Dexcom G6 (Dexcom Inc., San Diego, CA, USA), Dexcom G7 (Dexcom Inc., San Diego, CA, USA), AiDEX (MicroTech Medical (Hangzhou) Co. Ltd., Zhejiang, China), GlucoMen (WaveForm Diabetes, Wilsonville, OR, USA), Glunovo (Infinovo, Suzhou, China), A6 TouchCare (Medtrum Technologies, Inc.,Shangai, China), CareSens Air (I-sens, Inc., Incheon, South Korea), and SiJoy System (Sibionics Shenzhen Technology Co. Ltd., China).
Trials had to report at least one (1) clinical accuracy outcome according to ISO 15197:2013 standards (Clarke, continuous, consensus, or surveillance error grids), (2) numerical accuracy outcomes (MARD, MAD, percentage of index test results within ±15 or ±20 mg/dL of reference method values for glucose concentrations <100, <80, or <70 mg/dL, percentage of results within ±15% or ±20% for glucose concentrations ⩾100, ⩾80, or ⩾70 mg/dL), or (3) evaluation of operational characteristics (sensitivity and specificity) for detection of hypoglycemia ⩽70 mg/dL and hyperglycemia >180 mg/dL. Studies that defined different thresholds for the diagnosis of hypoglycemia or hyperglycemia were also included. When more than one reference standard was reported, only the information from the venous and/or arterial blood reference test was considered.
Definition of the minimum acceptable criteria that must be met by the devices
The ISO 15197:2013 provides guidance on the criteria that devices must meet. The minimum acceptable criteria are that 95% of glucose monitoring system results are within ±15 mg/dL of the values measured by the reference method when glucose concentrations are <100 mg/dL (based on the difference between paired measurements), or within ±15% when glucose concentrations are ⩾100 mg/dL. For measures of clinical accuracy that describe the probability of making a correct treatment decision based on the assessed test result, 99% of pooled results should fall within zones A and B for the consensus error grid 26 or above 95% for the Clarke grid. 22
Data extraction and quality assessment
Two reviewers (VD, LG) selected studies in parallel and independently, first on the basis of the title and abstract and then on the basis of the full text. Disagreements were resolved by consensus or with the participation of a third investigator (OM, NS). Two investigators independently assessed the quality of the included studies (VD, LG) using the QUADAS-2 tool (Quality Assessment Diagnostic Accuracy Studies) 27 and classified each study as “low,” “high,” or “unclear” risk of bias and as “low,” “high,” or “unclear” concerns about applicability.
Data synthesis and analysis
Data extraction was done in a paired way. The data extracted for each of the studies were: design, author, year, country, number of subjects and participating centers, baseline characteristics (age, sex, BMI, HbA1c, type of diabetes, and number of child and adult participants), number of paired samples analyzed, glucose threshold, and characteristics of the reference test (laboratory technique used and time interval between sensor measurements and reference test). MARD and MAD data were obtained for overall glycemia, and individually in ranges of hyperglycemia, euglycemia, and hypoglycemia. When studies evaluated different thresholds, the main analysis was performed using the thresholds for hypoglycemia (⩽70 mg/dL) and hyperglycemia (>180 mg/dL) defined by the American Diabetes Association. 28
The information was summarized in comparative tables for each of the numerical and clinical accuracy outcomes in the areas of overall glycemia, hypoglycemia, and hyperglycemia.
The sensitivity and specificity of each sensor, and the respective 95% confidence intervals were calculated using the Review Manager software (RevMan 5.4®) proposed by The Nordic Cochrane Centre, The Cochrane Collaboration, Copenhagen. 29 The hierarchical summary receiver operating characteristic (SROC) curves were drawn using RevMan 5.4.
Heterogeneity was assessed by visual inspection of the SROC curves and the forest plot, as suggested by the Cochrane Collaboration. 30 I 2 statistic was not used as it does not account for heterogeneity explained by phenomena such as positivity threshold effects. 30
Publication bias
The funnel plot test has low power to detect publication bias in studies of diagnostic tests when there is considerable heterogeneity, so it was not performed in the present study. 31
Results
The PRISMA flow diagram shows the selection process. Of 7984 studies initially identified, 22 were finally included in the analysis32–53 (Figure 1). The reasons for the exclusion of the remaining studies are reported in Supplemental Material (Supplement 2). In total, the selected studies included 2294 patients and 320,216 paired measurements.

PRISMA flow diagram showing selection process.
The characteristics of the included studies are shown in Table 1. Eight studies included pediatric populations33,37,38,40,41,46,50,51 and two did not evaluate adults.40,46 Four studies evaluated only patients with T1DM.36,37,40,49 The reference test in most studies was venous or arterial blood glucose measured by Yellow Spring Instruments (YSI; 2300 STAT Plus Glucose and Lactate Analyzer).32–46,49–53 Nine studies used devices that do not require calibration.33,38,40–42,45,46,51,53 The sensor with the longest duration of use was the Eversense XL at 180 days.37,39
Characteristics of the included studies.

A, adults; C, children; EKF, Entwicklung, Konstruktion und Fertigung, blood glucose/lactate analyzers; NR, not reported; T1DM, type 1 diabetes; T2DM, type 2 diabetes; YSI 2300, STAT Plus Glucose and Lactate Analyzer (YSI, Inc., Yellow Springs, OH, USA), using the glucose-oxidase method.
The quality assessment of the studies is shown in Figure 2. In general, the highest risk of bias was found for flow and timing, because not all patients were included in the analysis without stating the reason, nor was there an adequate interval between the index test and the reference standard.32–34,36,38–40,45,47,51–53 Concerns about applicability in general were low because all studies included patients with T1DM, T2DM, and the reference standard with venous blood, and most measured with Yellow Spring Instruments 2300 (YSI, Inc., Yellow Springs, OH, USA), which is widely accepted by most manufacturers as a method for reference measurements and device calibration, 54 two studies used Entwicklung, Konstruktion und Fertigung (EKF) as the venous blood measurement.47,48
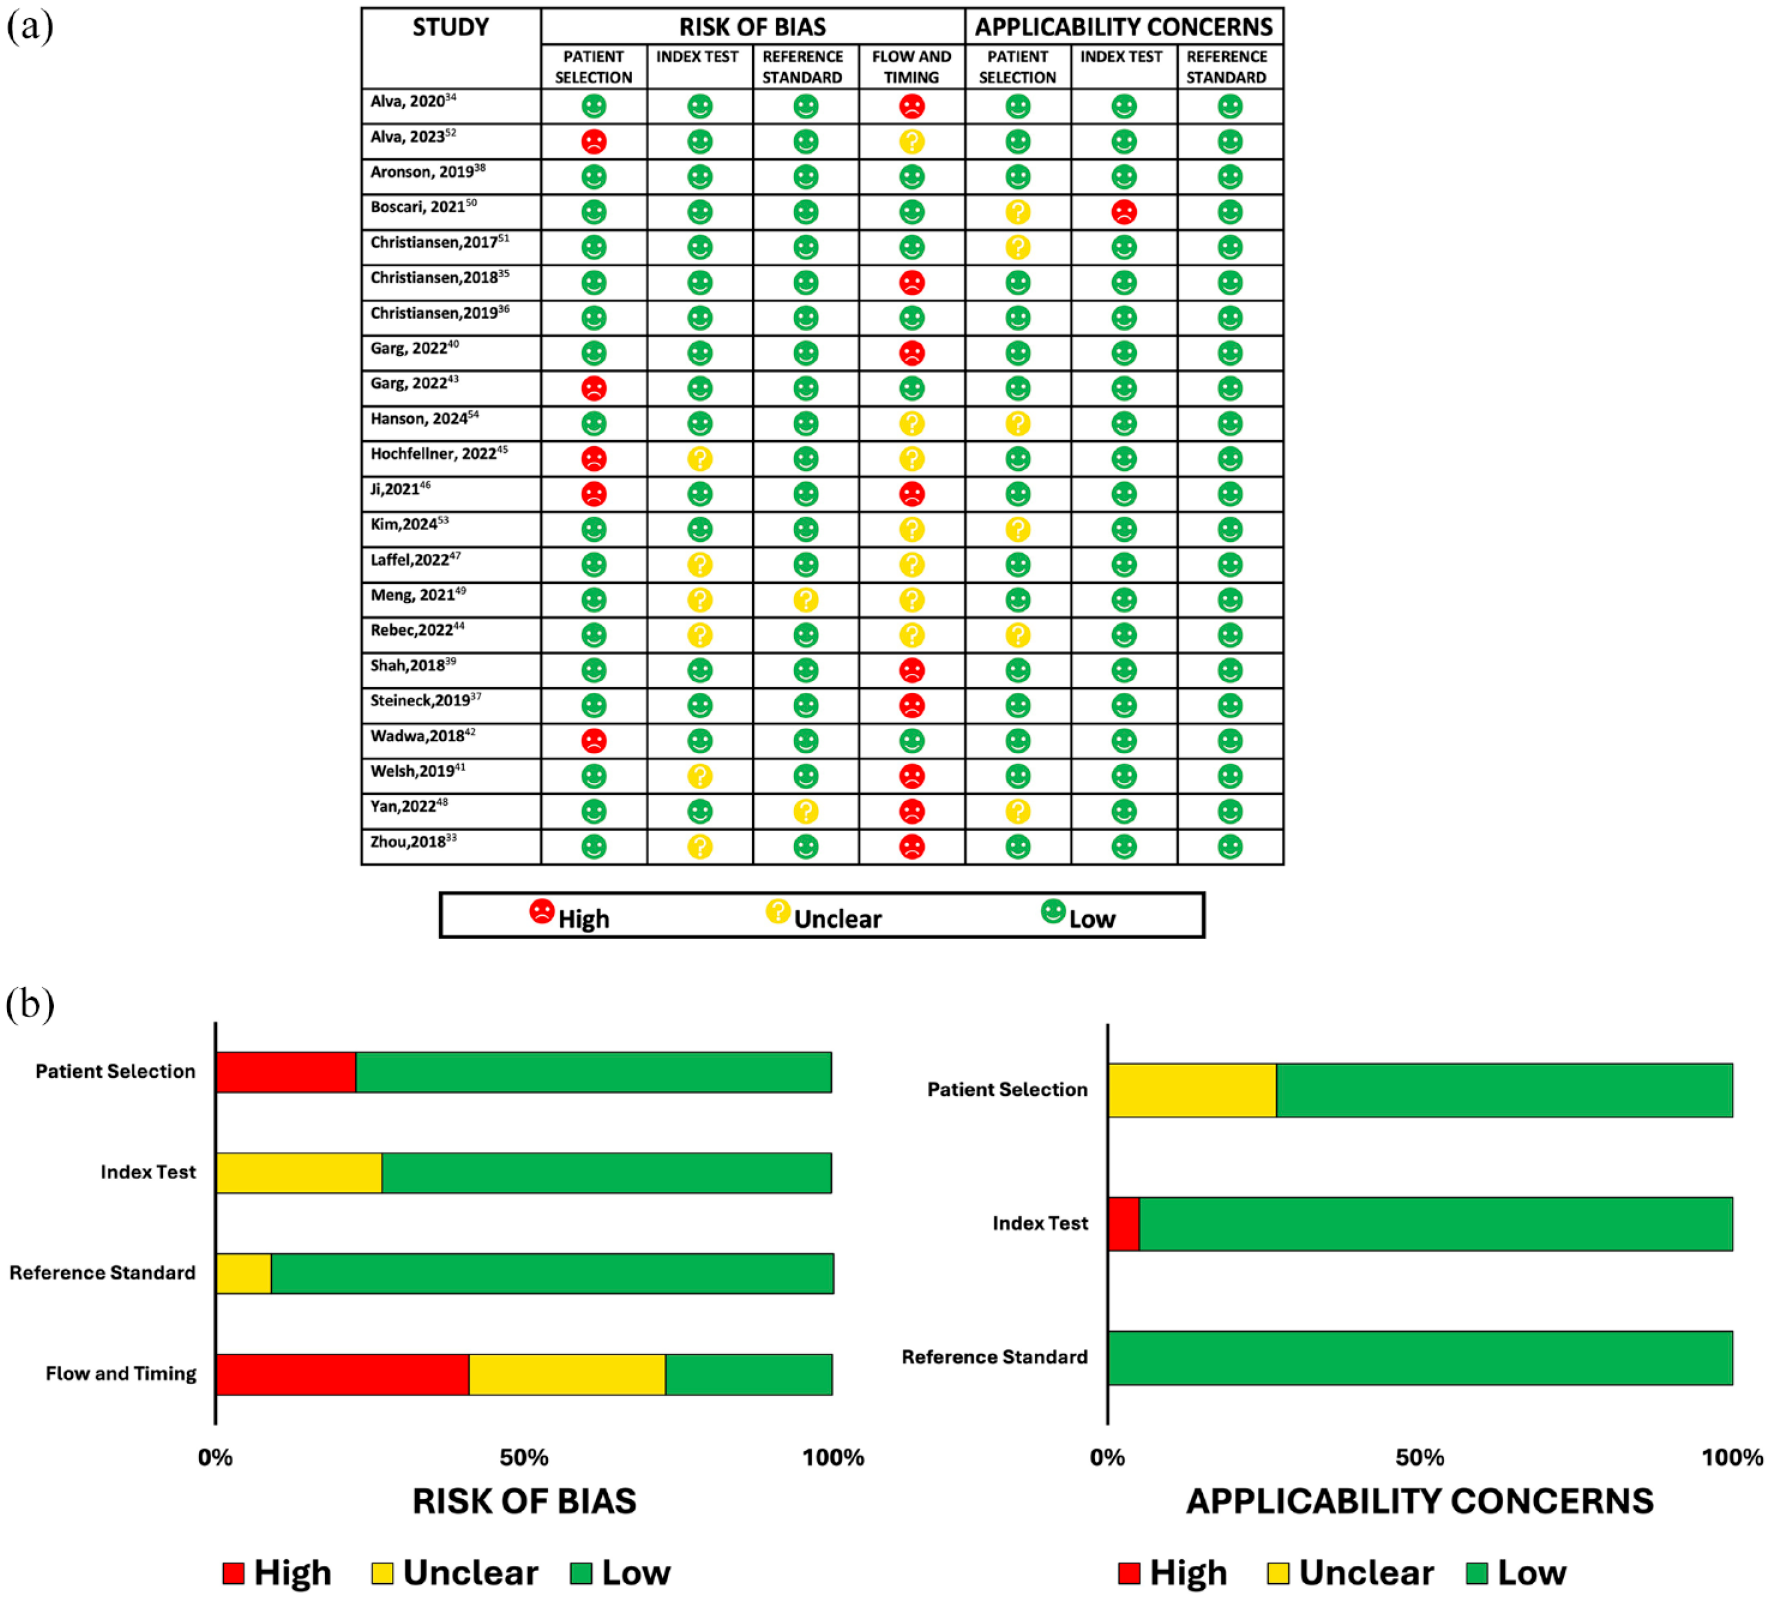
(a) Quality assessment with the QUADAS-2 tool: Risk of bias and applicability concerns. Both were assessed on three key domains: Patient selection, index test, reference standard, and a fourth domain (flow and timing) was assessed only for risk of bias. (b) Risk of bias graph.
Overall diagnostic accuracy
Most studies assessed accuracy in the 40–500 mg/dL range (Table 2). MARD was the most used metric to assess numerical device accuracy across the entire glycemic range. The average MARD was 9.4%, with the best value being 7.7% (Dexcom G6),38,40 followed by 7.8% (FreeStyle Libre 3). 51 Six studies reported MARD > 10%.36,43,48,50,52,53
Overall accuracy of CGM devices.

Minimum calibration two times per day, Additional calibration three to four times per day. Update algorithm application of the updated glucose calculation algorithm to the PRECISE II sensor.
20% or ±20 mg/dL, which was the percentage of sensor values that fell within either ±20 mg/dL of the reference values for glucose concentrations <100 mg/dL or within ±20% for glucose concentrations ⩾100 mg/dL.
15% or ±15 mg/dL, which was the percentage of sensor values that fell within either ±15 mg/dL of the reference values for glucose concentrations <100 mg/dL or within ±15% for glucose concentrations ⩾100 mg/dL.
20% or ±20 mg/dL, which was the percentage of sensor values that fell within either ±20 mg/dL of the reference values for glucose concentrations <80 mg/dL or within ± 20% for glucose concentrations ⩾80 mg/dL.
15% or ±15 mg/dL, which was the percentage of sensor values that fell within either ±15 mg/dL of the reference values for glucose concentrations <80 mg/dL or within ±15% for glucose concentrations ⩾80 mg/dL.
20% or ±20 mg/dL, which was the percentage of sensor values that fell within either ±20 mg/dL of the reference values for glucose concentrations <70 mg/dL or within ±20% for glucose concentrations ⩾70 mg/dL.
15% or ±15 mg/dL, which was the percentage of sensor values that fell within either ±15 mg/dL of the reference values for glucose concentrations <70 mg/dL or within ±15% for glucose concentrations ⩾70 mg/dL.
CGM, continuous glucose monitoring; MARD, mean absolute relative difference; NR, not reported; SBA, sacrificial boronic acid sensor, specific modification to glucose-binding indicator chemistry, improving longevity by reducing oxidation.
Only nine studies32,37,38,40–42,46,49,52 were based on ISO 15197:2013 standards, 26 however, none reached values higher than 95% of the measurements in the stipulated ranges (±15 mg/dL or ±15%). According to this parameter, the device with the highest accuracy was Dexcom G6 with 91.1%,38,40 and the lowest was Eversense (Senseonics) with 65.6% 49 (Table 2).
Eleven studies evaluated consensus or Parkes error grids,32,33,37,43–45,47,48,50–52 10 of which found values in zone A + B greater than 99%.32,33,37,43,45,47,48,50–52 Nine reported Clarke’s error grids.32,34,36,38,45,47–50 Only one reported value below 95% in zones A + B. 49 One study reported Clarke’s measurements of 0.04% in zone E, 48 five studies reported in zone D, four of which were below 1%,32,34,45,47,50 except one which reported percentages of 2.4% 36 (Table 3). Five studies additionally reported error grids that are not part of the ISO 15197:2013 criteria (continuous and surveillance)32,37,38,40,53 (Table 3).
Clinical accuracy error grids for overall glycemia.

Minimum calibration two times per day, Additional calibration three to four times per day.
A, adults; Abd. abdomen insertion; Ar, arm insertion; C, children; NR not reported.
Diagnostic accuracy in hypoglycemia
The included studies used thresholds between 40 and 80 mg/dL (Table 4), with some reporting different thresholds simultaneously34,35,39,41–44,46,48,51–53 Only nine studies evaluated accuracy in terms of MARD for hypoglycemia.32,34,35,37,39,40,47,48,53 The sensor with the best MARD was FreeStyle Libre 3 with 3.6% for the <54 mg/dL range, 53 followed by Eversense (Senseonics) with 7.2% for the 40–60 mg/dL range. 35 The device with the highest MARD was G7 System 53 (53.4% at <54 mg/dL and 27% for the 55–69 mg/dL threshold), followed by Glunovo (35% at <54 mg/dL and 19.7% for the 55–69 mg/dL threshold). 48
Hypoglycemia accuracy of CGM devices.

Minimum calibration two times per day, Additional calibration three to four times per day. Update algorithm application of the updated glucose calculation algorithm to the PRECISE II sensor.
20% or ± 20 mg/dL, which was the percentage of sensor values that fell within either ±20 mg/dL of the reference values for glucose concentrations <100 mg/dL or within ±20% for glucose concentrations ⩾100 mg/dL.
15% or ±15 mg/dL, which was the percentage of sensor values that fell within either ±15 mg/dL of the reference values for glucose concentrations <100 mg/dL or within ±15% for glucose concentrations ⩾100 mg/dL.
20% or ±20 mg/dL, which was the percentage of sensor values that fell within either ±20 mg/dL of the reference values for glucose concentrations <80 mg/dL or within ±20% for glucose concentrations ⩾80 mg/dL.
15% or ±15 mg/dL, which was the percentage of sensor values that fell within either ±15 mg/dL of the reference values for glucose concentrations <80 mg/dL or within ±15% for glucose concentrations ⩾80 mg/dL.
20% or ±20 mg/dL, which was the percentage of sensor values that fell within either ±20 mg/dL of the reference values for glucose concentrations <70 mg/dL or within ±20% for glucose concentrations ⩾70 mg/dL.
15% or ±15 mg/dL, which was the percentage of sensor values that fell within either ±15 mg/dL of the reference values for glucose concentrations <70 mg/dL or within ±15% for glucose concentrations ⩾70 mg/dL.
MARD, mean absolute relative difference; MAD, mean absolute difference in mg/dL; NR, not reported.
No device reached the ISO 15197:2013 recommendations for the percentage of measurements in the recommended range (>95% of measurements in the ±15 mg/dL range), with values below 40% reported for A6 TouchCare 32 (Table 4). Using broader accuracy criteria than those stipulated by ISO (±20 mg/dL for reference values ⩽70–100 mg/dL, or ±20% for reference values >70–100 mg/dL) three devices exceeded 95% for different hypoglycemia thresholds, FreeStyle Libre 3,51,53 FreeStyle Libre 2, 33 Eversense (updated algorithm), 35 and G7 Dexcom.42,46 Nevertheless, the study comparing Freestyle Libre 3 and Dexcom G7 reported values for the Dexcom G7 as low as 0% for the <54 mg/dL threshold and 67.7% for the 55–69 mg/dL threshold, but it should be noted that they used a glucose concentration at 20% or ±20 mg/dL of 70 mg/dL. 53
None of the five studies that evaluated error grids met the risk zone parameter in A and B above 99% for consensus, neither above 95% for Clarke32,36,47–49 (Table 5). Only one study reported the percentage of measurements in other risk zones with the G4 Platinum Device (Dexcom), 36 finding that 0% were in zone E, but between 23% (measurements in the arm) and 27% (measurements in the abdomen) were in zone D.
Summary of studies evaluating clinical accuracy by error grids in hypoglycemia.
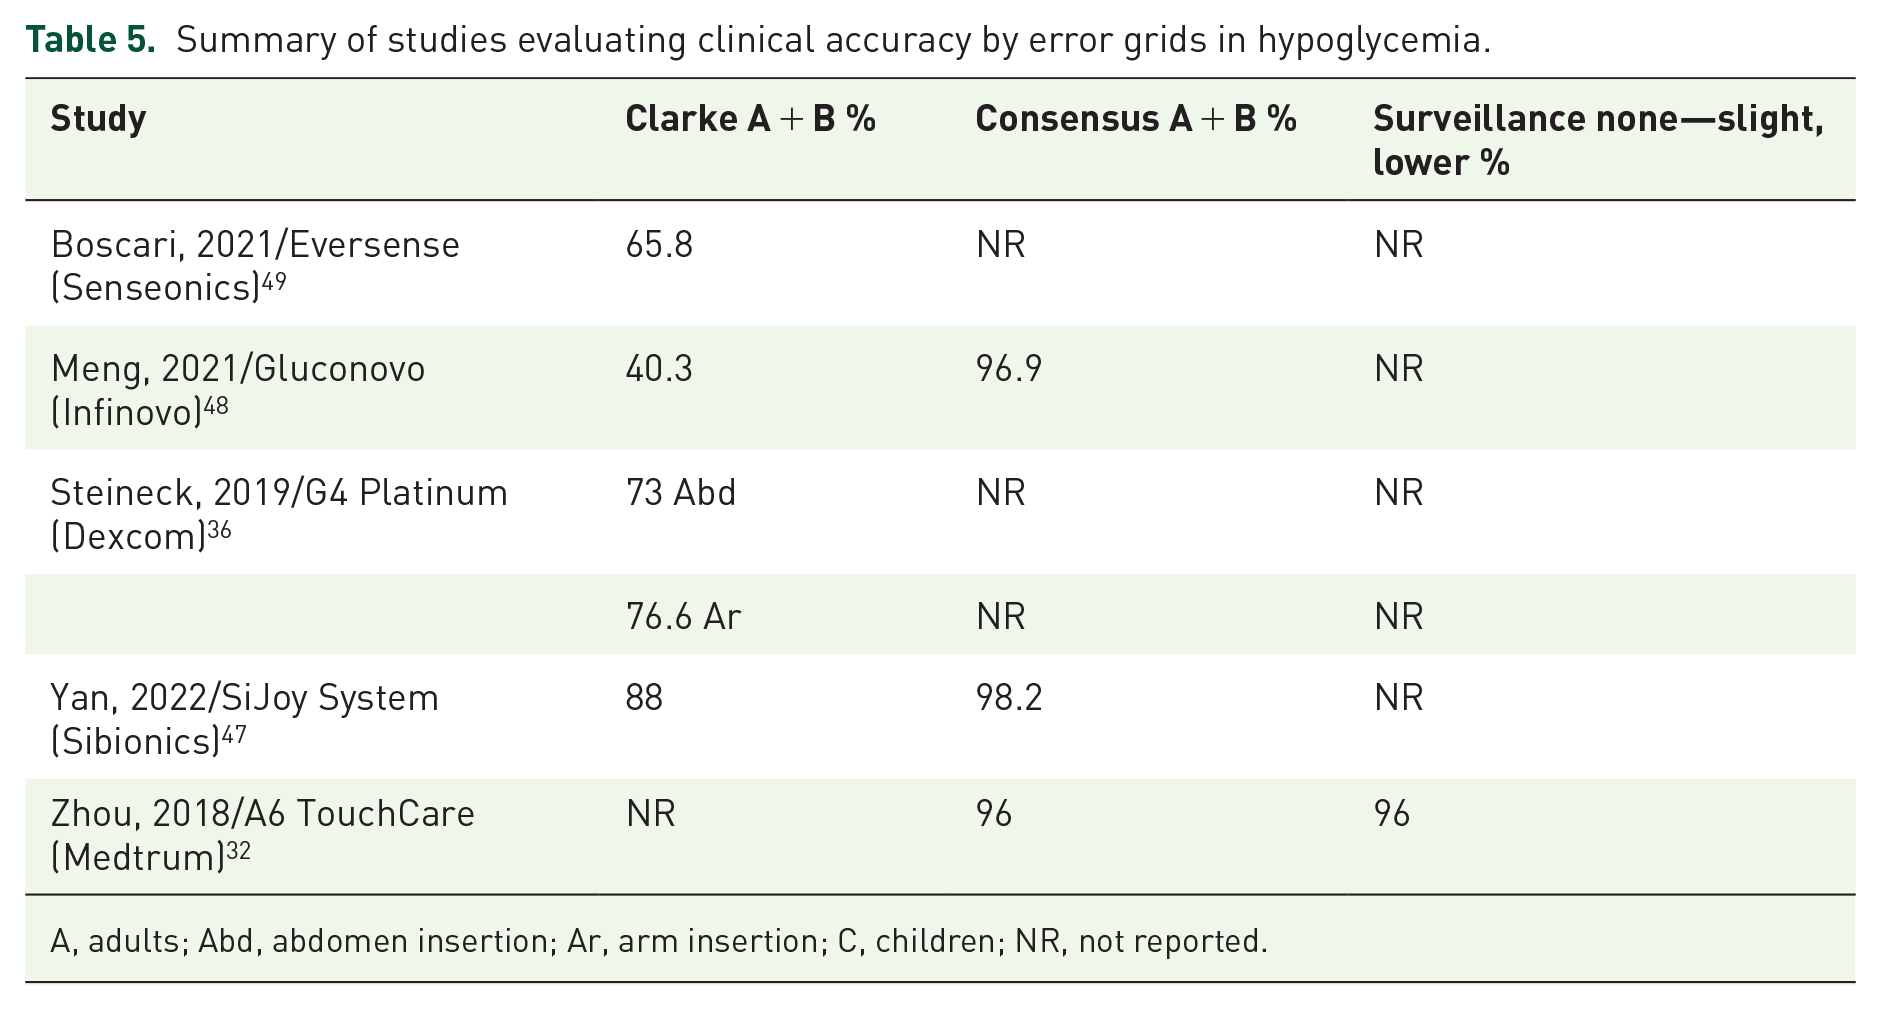
A, adults; Abd, abdomen insertion; Ar, arm insertion; C, children; NR, not reported.
Diagnostic accuracy in hyperglycemia
The accuracy thresholds evaluated were 180–400 mg/dL (Table 6). Sixteen studies evaluated MARD32,34–41,44–47,51–53 with values <10%, except for Glunovo, CareSens Air at the threshold of >250 mg/dL with a MARD of 10.1% and 10.4%, respectively.48,52
Accuracy in hyperglycemia of CGM devices.

Minimum calibration two times per day, Additional calibration three to four times per day. Update algorithm application of the updated glucose calculation algorithm to the PRECISE II sensor.
20% or ± 20 mg/dL, which was the percentage of sensor values that fell within either ±20 mg/dL of the reference values for glucose concentrations <100 mg/dL or within ±20% for glucose concentrations ⩾100 mg/dL.
15% or ±15 mg/dL, which was the percentage of sensor values that fell within either ±15 mg/dL of the reference values for glucose concentrations <100 mg/dL or within ± 15% for glucose concentrations ⩾100 mg/dL.
20% or ±20 mg/dL, which was the percentage of sensor values that fell within either ±20 mg/dL of the reference values for glucose concentrations <80 mg/dL or within ±20% for glucose concentrations ⩾80 mg/dL.
15% or ±15 mg/dL, which was the percentage of sensor values that fell within either ±15 mg/dL of the reference values for glucose concentrations <80 mg/dL or within ±15% for glucose concentrations ⩾80 mg/dL.
20% or ±20 mg/dL, which was the percentage of sensor values that fell within either ±20 mg/dL of the reference values for glucose concentrations <70 mg/dL or within ±20% for glucose concentrations ⩾70 mg/dL.
15% or ±15 mg/dL, which was the percentage of sensor values that fell within either ±15 mg/dL of the reference values for glucose concentrations <70 mg/dL or within ±15% for glucose concentrations ⩾70 mg/dL.
CGM, continuous glucose monitoring; MARD, mean absolute relative difference; NR, not reported.
Only two devices met the ISO 15197:2013 recommended criteria for hyperglycemia (>95% of measurements in the ±15% or 15 mg/dL range), Dexcom G6 at the >250 mg/dL threshold 40 and Dexcom G7 in arm insertion at the 301–400 mg/dL threshold.42,46 Using wider ranges (±20 mg/dL or 20%), two devices were above 95% (Dexcom G7 and Dexcom G6)40,42,46 and two met it only in the >250 mg/dL range38,41 (Table 6).
Five studies evaluated clinical accuracy in terms of error grids32,36,47–49 (Table 7). All the evaluated devices met the expected parameters.
Summary of studies evaluating clinical accuracy by error grids in hyperglycemia.

A, adults; Abd, abdomen insertion; Ar, arm insertion; C, children; NR not reported.
Sensitivity and specificity for hyperglycemia and hypoglycemia events
Nine studies provided sufficient data to estimate sensitivity and specificity for hypoglycemia and hyperglycemia events.33–36,39,41,42,45,47
Figure 3 shows the forest plot of sensitivity and specificity for the detection of hypoglycemic events. For the 70 mg/dL threshold, the mean sensitivity was 85.7% and specificity was 95.33%. For the 60 mg/dL threshold, the values were 84% and 97%, respectively. Sensitivity was lower at lower thresholds. There is significant heterogeneity in sensitivity, but not in specificity.

Sensitivity and specificity for detection of hypoglycemia. (a) Forrest plot; (b) Hierarchical SROC curve.
Figure 4 shows the forest plot of sensitivity and specificity for the detection of hyperglycemic events. For the 180 mg/dL threshold, the average sensitivity was 97.45% and specificity was 96%. For the 200 mg/dL threshold, 93.4% and 89.6%, respectively. For the 240 mg/dL threshold, the mean sensitivity was 94.4% and specificity was 98.4%. Graphically, there is no significant heterogeneity.

Sensitivity and specificity for detection of hyperglycemia. (a) Forrest plot; (b) Hierarchical SROC curve.
Adverse events
Sixteen studies reported adverse events.32,34,35,37–39,42,43,45–48,50–53 Most reported an adverse event rate of less than 15%, and two studies reported no device-related adverse events.43,47 In terms of frequency, the most reported adverse events were dermatologic (erythema, edema, induration, skin irritation associated with the adhesive patch, skin atrophy, and hypopigmentation), followed by hematologic (bruising, bleeding) and pain during device insertion or sensor removal. One study 37 reported presyncope, nausea, and vomiting in six patients associated with device insertion or removal. Four studies reported bleeding,39,45,51,53 which was considered mild. Only one serious event was reported, associated with the inability to remove the sensor on the first attempt, requiring surgical intervention. 34
Discussion
Our systematic review suggests that the accuracy of the various commercially available CGM sensors is adequate in the range of global glycemia and hyperglycemia, both in terms of numerical accuracy and clinical accuracy as measured by error grids. However, accuracy is still limited in hypoglycemia ranges, which could limit clinical decisions based on sensor measurements. The findings are similar in terms of sensitivity and specificity for detecting hypoglycemia events.
MARD is the most widely used numerical accuracy parameter due to its ease of interpretation, with an accepted cut-off point of <10%–12%.20,21,55 We found that most of the sensors reported a MARD < 10%, for both overall and hyperglycemia ranges. However, it was evident that MARD varies according to the characteristics of the assessment, tending to be lower when measurements are made on the arm compared to the abdomen, and in adults relative to children. In addition, the differences between the parameters used to assess precision (e.g., glucose ranges, varying rates of changing glucose, and day of sensor wear), it has been documented that the first day of performance is usually worse than the remaining days. 56 Other potential sources of heterogeneity not evaluated in our study include calibration differences between sensors, calibration errors,16,17,57,58 manufacturing batches, and time of assessment. Discrepancies in reported accuracy statistics are to be expected because of the lack of standardized protocols and methodologies for assessing and reporting CGM accuracy and performance. 15 Therefore, MARD may be influenced by multiple factors beyond sensor performance. 16 This is why ISO 15197:2013 proposes different criteria, such as the proportion of measurements within a specified range relative to a reference method >95%. 26 We found that only a relatively small proportion of studies reported ISO criteria and none of the sensors met this parameter when evaluating the global or hypoglycemia range, but two devices (G6 and G7 Dexcom) did meet it in the range of hyperglycemia >250 mg/dL.40,42,46 These results highlight the importance of complete and standardized reporting for the new devices to avoid reporting bias.
In terms of clinical accuracy criteria, most studies in the global and hyperglycemic ranges reported that the percentage of measurements in risk zones A + B for Clarke and consensus was greater than 95% and 99%, respectively, suggesting that no errors would be made in clinical decisions based on CGM measurements. It is noteworthy, however, that there was very limited reporting of the percentages in the other risk zones, where measurement errors would lead to undesirable clinical outcomes. The limited information available suggests that approximately 1% of sensor readings could lead to misinterpretation, although the risk of adverse clinical outcomes is unclear. In addition, the sensitivity and specificity for assessing hyperglycemia were good for most sensors (97.45% and 96%, respectively). Thus, most sensors have sufficient clinical accuracy and are safe for making treatment decisions in this range.
The data presented in this study demonstrate that current sensors continue to have suboptimal operating characteristics for the diagnosis of hypoglycemic events, with an average sensitivity for glycemia <70 mg/dL of 85.7% and <60 mg/dL of 84%, but with good specificity (95.3% and 97%, respectively). A recent systematic review and meta-analysis that evaluated the diagnostic accuracy of different sensors for detecting hypoglycemia in T1DM and T2DM found an average sensitivity and specificity for detecting hypoglycemia much lower than our study (69.3% and 93.3%, respectively), with a high frequency of false-positive and false-negative alarms. 14 This difference is due to the fact that this meta-analysis included sensors with older technology, some of which are no longer commercially available.
We additionally evaluated other precision parameters in hypoglycemia ranges. MARD was variable with values as high as 53.4%–35% at the glucose threshold of <54 mg/dL48,53 but also with some <10%.34,35,39,53 Nevertheless, it is known that MARD estimates are subject to relatively large errors in the hypoglycemic range, in part due to a markedly nonlinear relationship with glucose level, and also when there are only a small number of observations in the hypoglycemic range, especially at the lower end of the hypoglycemic range, one might expect to obtain a MARD value that is closer to the observed values in the target range, 17 as seen in the study where the MARD for Dexcom G7 was 53. Four percent for the <54 mg/dL range and 27% for the 54–69 mg/dL range, 53 but this may be explained by the fact that the numbers in this hypoglycemic range were only 1 and 27, respectively.
None of the devices met the ISO 15197:2013 recommended parameters for the proportion of measurements in a specific range, but three devices exceeded the 95% threshold for measurements with a higher acceptance range (±20 mg/dL for reference values ⩽80–100 mg/dL or ±20% for reference values >80–100 mg/dL).33,35,42,46 None of the devices achieved a percentage of measurements in risk zones A + B of the error grids greater than 95% in Clarke and more than 99% in consensus, but three studies32,47,48 reported percentages of measurements in these zones greater than 95% for the consensus grid. In addition, one study reported that there were no measurements in zone E, 36 which would represent the highest risk zone for inaccurate measurements, suggesting that the percentage of clinical conduct where errors can be made is low. 59 This demonstrates the progress in technology in hypoglycemia ranges, but there are still limitations in terms of safety.
With more sensitive sensors, different algorithms have been developed to improve the accuracy and reliability of the devices, allowing the development of closed-loop systems or “artificial pancreas” that automatically pump insulin according to the predicted value of the glucose level and avoid dangerous glycemic states.2,60,61 Such devices also have the ability to detect trends, fluctuations, and rapid changes throughout the day, providing hypoglycemia alerts that can be used by the patient to take rapid preventive action. The high number of readings, taken every 1–5 min,3–5 could reduce the number of false positives and false negatives.
With the data available to date, it is recommended that all values be confirmed at hypoglycemic thresholds to avoid false alarms. In addition, it is recommended to obtain capillary recordings in the presence of hypoglycemic symptoms to avoid false negatives. However, the benefits of CGM in terms of reduced HbA1c, fewer severe hypoglycemic events, increased TIR, reduced hospitalizations for severe hypoglycemia, and diabetic ketoacidosis outweigh these limitations.6,8,9,62–67 Several controlled clinical trials have demonstrated the large benefit of hypoglycemia reduction, Haak et al. 62 showing a 43% reduction in hypoglycemia for glycemia <70 mg/dL, 53% for <55 mg/dL, and 64% for events <45 mg/dL, with a significant improvement in patient satisfaction. A recent meta-analysis found that CGM patients spend less time in hypoglycemia than SBGM patients. 68 In addition, SBGM is an invasive and uncomfortable procedure for the patient as it requires a digital puncture, which means that adherence can be as low as 24%–44% for T2DM and T1DM, respectively,69,70 therefore, CGM is being positioned as the standard for glucose monitoring in people with diabetes to achieve better adherence and therefore better glycemic control.11,71,72
The present systematic review shows a low percentage of adverse events, most of which were mild dermatologic reactions. Only one study reported a serious but nonfatal event, 34 which may improve patient compliance, in addition to other advantages of current devices such as longer sensor life in the body, fewer calibrations, and even factory calibration.
Our study has several strengths. We evaluated current and new FDA-approved devices available on the market, which gives an up-to-date view of the state of the technology. Additionally, we evaluated multiple accuracy metrics in addition to sensitivity and specificity, covering not only the hypoglycemia range but also global glycemia and hyperglycemia thresholds. Finally, we compared the devices only to the reference standard of venous or arterial blood.
However, there are limitations that need to be recognized. Accuracy metrics are not fully standardized, leading to heterogeneity in the reporting of primary studies. In addition, only a limited number of studies report results using the criteria proposed by ISO, which introduces a risk of publication bias. Similarly, only a proportion of studies report clinical accuracy metrics, and these data are particularly limited at the hypoglycemic threshold. We, therefore, insist on the need to standardize measurements and reporting of this type of study. Finally, we excluded from the review studies that evaluated patients hospitalized in general wards or intensive care units, so our results are not generalizable to these populations, where conditions such as hypoperfusion, vasoactive and inotropic support, certain medications, and uremia may alter the accuracy and performance of the devices.73–75
Conclusion
Current sensors available for CGM have adequate accuracy in the overall and hyperglycemia range. For hypoglycemia, the accuracy of the latest sensors on the market has improved but is still low. Until a sufficiently high accuracy is achieved according to standardized requirements, it is still necessary to confirm hypoglycemia levels with capillary blood.
Supplemental Material
sj-docx-1-tae-10.1177_20420188241304459 – Supplemental material for Evaluating the precision and reliability of real-time continuous glucose monitoring systems in ambulatory settings: a systematic review
Supplemental material, sj-docx-1-tae-10.1177_20420188241304459 for Evaluating the precision and reliability of real-time continuous glucose monitoring systems in ambulatory settings: a systematic review by Valentina Dávila-Ruales, Laura F. Gilón, Ana M. Gómez, Oscar M. Muñoz, María N. Serrano and Diana C. Henao in Therapeutic Advances in Endocrinology and Metabolism
Supplemental Material
sj-docx-2-tae-10.1177_20420188241304459 – Supplemental material for Evaluating the precision and reliability of real-time continuous glucose monitoring systems in ambulatory settings: a systematic review
Supplemental material, sj-docx-2-tae-10.1177_20420188241304459 for Evaluating the precision and reliability of real-time continuous glucose monitoring systems in ambulatory settings: a systematic review by Valentina Dávila-Ruales, Laura F. Gilón, Ana M. Gómez, Oscar M. Muñoz, María N. Serrano and Diana C. Henao in Therapeutic Advances in Endocrinology and Metabolism
Footnotes
References
Supplementary Material
Please find the following supplemental material available below.
For Open Access articles published under a Creative Commons License, all supplemental material carries the same license as the article it is associated with.
For non-Open Access articles published, all supplemental material carries a non-exclusive license, and permission requests for re-use of supplemental material or any part of supplemental material shall be sent directly to the copyright owner as specified in the copyright notice associated with the article.