
Abstract
Background:
Saliva could be an attractive alternative to blood for assessing thyroid hormonal function.
Objectives:
Our goal was to determine if the levels of thyroid hormones in saliva can accurately reflect a person’s thyroid status and if they consistently correlate with the levels of the same hormones in the blood.
Design:
We conducted a cross-sectional study.
Methods:
We enrolled a total of 109 participants with different thyroid conditions. We measured TSH (Thyroid-Stimulating Hormone), free T3 (fT3), and free T4 (fT4) in the blood using two different immunoassay methods: electrochemiluminescence immunoassay (ECLIA) and chemiluminescence immunoassay (CLIA). Saliva samples were collected using Salivette® tubes, and then we analyzed the levels of thyroid hormones in the saliva using liquid chromatography with tandem mass spectrometry (LC-MS/MS).
Results:
Comparing salivary and serum levels of thyroid hormones, we observed significantly lower fT4 and higher fT3 levels in saliva (p < 0.001), regardless of the measurement method. We also found that salivary fT3 and fT4 levels were positively correlated in the entire group of participants (p < 0.001, R 0.575), as well as in those with TSH values within the normal reference range (p < 0.001, R 0.570). We further divided participants based on their TSH reference intervals and assessed the correlations between serum and salivary thyroid hormones within these groups. We also discovered that taking exogenous levothyroxine influenced the correlations between serum and salivary thyroid hormones. Thyroid antibodies did not have a significant impact on the levels of thyroid hormones in both serum and saliva.
Conclusion:
This study demonstrates that salivary thyroid hormones can partially reflect the levels of these hormones in the blood. Saliva may be a useful tool in a clinical setting for patients with thyroid antibodies, but it may not be as effective for those who are taking levothyroxine as a treatment.
Introduction
Saliva has recently drawn attention as a tool for the clinical evaluation of endocrine function. Saliva collection has a few advantages over more conventional blood sampling. It is a noninvasive and easy-to-perform procedure. Furthermore, many analytes are stable in saliva at ambient temperature, requiring no special storage precautions. These assets have accelerated research on saliva as an alternative body fluid to blood 1 in endocrine diagnostics.
Saliva has been tested as a monitoring tool in many endocrine and autoimmune 2 disorders, including hyperaldosteronism,3,4 Addison’s disease,5,6 testicular dysfunctions,7,8 and Cushing’s disease. 9 In addition, its utility to assess estradiol, 10 dehydroepiandrosterone, 11 and insulin12,13 has been analyzed.
Thyroid hormones play a vital function in the human body. Their task is to control growth and metabolism.14,15 Thyroid disorders are among the most common endocrine diseases, so their socioeconomic impact should not be ignored. 16 Measurement of free T4 (fT4; thyroxine), free T3 (fT3; triiodothyronine), and TSH (TSH; thyroid stimulating hormone) reflects thyroid function. According to the free hormone hypothesis, the physiological effects of hormones rely on free hormone concentration. 17 It has been suggested that salivary hormone levels reflect serum-free fraction. 18 In the bloodstream, only a minute part of lipophilic total thyroxine (T4) and total triiodothyronine (T3) is free (0.02% and 0.5%, respectively). 19 Most T4 and T3 (70% and 80%, respectively) are bound to thyroid-binding globulin (TBG). 19 The other major thyroid hormone–binding proteins are transthyretin and albumin. Transthyretin binds 20% of serum T4, whereas albumin binds only 5%. 20 In previous studies, thyroid hormones were found in saliva,21,22 but their usefulness for thyroid function assessment was debatable. Little do we know about a possible correlation between salivary and serum levels of thyroid hormones, while available results are contradictory. Naresh et al. compared free and total thyroid hormones and TSH concentrations in saliva and serum. They concluded that saliva cannot be an alternative to serum in assessing thyroid function. 23 On the other hand, Higashi et al. investigated salivary and serum T4 using liquid chromatography with tandem mass spectrometry (LC-MS/MS). They found higher levels of T4 in patients with hyperthyroidism compared to euthyroid subjects. 18 Patients with Hashimoto’s thyroiditis might suffer from reduced salivary secretion. Therefore, the potential utility of salivary markers in this group has been questioned. 2
Regarding the information mentioned above, we aimed to evaluate whether thyroid hormone levels in saliva reflect serum concentrations and if there is a constant correlation between them. Previous studies have demonstrated that the LC-MS/MS technique accurately assesses thyroid hormones in serum or plasma,24,25 but little is known about saliva. The study aimed to assess the usefulness of determining levels of thyroid hormones in saliva using LC-MS/MS.
Material and methods
Study design and patients’ enrollment
This was a cross-sectional study. We recruited consecutive patients routinely referred for the assessment of thyroid hormones. A prospective enrollment was done for 12 months (from February 2021 to February 2022) at the Department of Endocrinology, Metabolism and Internal Medicine, Poznan University of Medical Science in Poland.
Exclusion criteria included pregnancy, use of medications influencing free thyroid hormones or TSH concentrations (i.e., heparin, furosemide, amiodarone, metformin, steroids, somatostatin analogues, oral contraception, antiepileptic medications, and salicylates), severe chronic diseases, infections, and active malignancy.
After an overnight fast, venous blood samples were drawn into a tube with a cloth activator (for serum samples) in the morning (7–10 a.m.), the samples were centrifuged (10 min, 3500 rpm), and then serum was separated and stored at −80°C until assayed (<1 month). All patients’ serum TSH, fT3, and fT4 concentrations were determined using CLIA and ECLIA immunoassay.
Saliva was collected using a commercially available unstimulated saliva collection kit, Salivette® (SARSTEDT, Nuembrecht, Germany), containing a tube and a special swab. To reduce the potential affinity of the tested substances to the swab and improve saliva recovery, a synthetic polymer swab was used (Salivette).The manufacturer’s instructions were followed when collecting saliva samples. The saliva collection process was initiated in the morning, on an empty stomach, prior to brushing the teeth. The swab was inserted into the oral cavity (ideally between the gums and cheeks), where it was left for at least 5 min without chewing. The swab was spit directly into the tube after the specified amount of time had passed. The tubes were centrifuged (10 min, 3500 rpm), and clear liquid saliva was stored in original Salivette tubes at −80°C before the analysis (<1 month). In all patients, saliva fT3 and fT4 concentrations were determined using the LC-MS/MS analytical technique.
Laboratory analyses
Immunoassays
The concentration of TSH and free thyroid hormones (fT3 and fT4) were determined in serum using two methods: ECLIA-Cobas, electrochemiluminescence (ECLIA) immunoassays Elecsys® Cobas e801 (Roche, Switzerland), and CLIA-LIAISON, chemiluminescence immunoassay (CLIA) LIAISON XL® (DiaSorin, Italy). The antibody levels were determined using the electrochemiluminescence (ECLIA) immunoassays Elecsys® Cobas e801.
Electrochemiluminescence (ECLIA) immunoassays Elecsys® Cobas e801
TSH
Analytical sensitivity was 0.005 µIU/mL. A reference value for the serum sample was 0.270–4.20 µIU/mL.
fT4
Analytical sensitivity was 0.5 pmol/L. A reference value for the serum sample was 12–22 pmol/L
fT3
Analytical sensitivity was 0.98 pg/mL. A reference value for the serum sample was 2.0–4.4 pg/mL.
Anti-Tg (TgAb)
Analytical sensitivity was 15 IU/mL. A reference value for the serum sample (positive result) >115 IU/mL.
Anti-TPO (TPOAb)
Analytical sensitivity was 15 IU/mL. A reference value for the serum sample (positive result) >34 IU/mL.
Anti-TSH-R (TRAb)
Analytical sensitivity was 0.9 IU/mL. A reference value for the serum sample (positive result) ⩾2 IU/mL.
Chemiluminescence immunoassay (CLIA) LIAISON XL®
TSH
Analytical sensitivity was 0.004 µIU/mL. A reference value for the serum sample is 0.35–4.00 µIU/mL.
fT4
Analytical sensitivity was 1.29 pmol/L. A reference value for the serum sample is 10.29–21.88 pmol/L.
fT3
Analytical sensitivity was 0.3 pg/mL. A reference value for the serum sample is 2.2–4.2 pg/mL.
LC-MS/MS
The concentration of thyroid hormones (fT3 and fT4) in saliva was determined using the LC-MS/MS analytical technique.
Chemicals and reagents
The commercial thyroid hormones and their corresponding mass labeled isotopes 3,3′,5-Triiodo-
The well plate used for saliva sample elution was Masterblock® 96 well, 1 mL, PP, U-bottom (Greiner Bio-One GmbH, Kremsmünster, Austria).
LC-MS/MS analysis
LC-MS/MS analysis was performed using an ultra-performance liquid chromatography (UPLC) system (Shimadzu, Japan) coupled to a QTRAP 5500+ triple quadrupole mass spectrometer equipped with Turbo V electrospray ion source (AB Sciex, Framingham, USA). The UPLC system was equipped with two binary pumps (LC30AD), a degasser, an autosampler (SIL-30ACMP), and a column oven (CTO-30A). The Kinetex® C18 column (3 mm × 50 mm; 2.6 μm) was used to separate the analytes. The separation was carried out at 40°C. The samples were injected into the UPLC column at a flow of 0.6 mL/min using a gradient of mobile phase A (2 mM ammonium fluoride in water and B (methanol:acetonitrile (1:1)). The injection volume was 10 µL. The gradient elution program was as follows: 0 min–50%B, 0.2 min–55%B, 2.5 min–85%B, 2.8 min–95%B, 3.8 min–95%B, 3.9 min–50%B, 5.0 min–50%B, and 6.0 min–50%B. The total run time was 7 min. Injections were carried out with an autosampler maintained at 8°C. The electrospray ionization (ESI) conditions were as follows: positive ionization mode source voltage 5000 V, capillary temperature 450°C, curtain gas pressure 40 psi, nebulizing gas 35 pis, drying gas 30 psi. The ESI parameters were optimized using the instrument-integrated syringe pump analyses provided by the Analyst software package (Analyst 1.6.2). Analytes were measured using the triple quadrupole mass spectrometry in Single Reaction Monitoring (SRM) modes using positive ionization (ESI). For each compound, the following parameters were optimized for MS/MS determination: entrance potential (EP), declustering potential (DP), collision cell entrance potential (CEP), collision energy (CE), and collision cell exit potential (CXP). Quantification of buthylated compounds was done using the selected reaction monitoring mode (SRM). For each analyte, the optimum conditions in SRM mode were determined in infusion mode, and two SRM pairs were chosen as representatives (SRM1 and SRM2). Due to the higher intensity of peak obtained using the SRM1 pairs, they were chosen for quantitative analyses. SRM2 pairs were used as qualifier transitions for additional confirmation of the compounds. The calibration curves ranged from 0.5 to 40 pg/mL for fT3 and rT3 and 0.5 to 200 pg/mL for fT4. A calibration curve was generated based on the following concentrations of analytes: 0.5, 1, 5, 10, 20, 40 pg/mL. There was an addition of one calibration point for fT4: 200 pg/mL. Coefficients of linearity (R2) for the calibration curves were ⩾0.996. A linear regression with 1/× regression weighting was used to assess the linearity of the assay. The accuracy for T3 (free), T4 (free), and rT3 (free) at the lowest calibration level and their signal-to-noise ratios (S/Ns) were 86.1%, S/N = 66; 108.3%, S/N = 249,7; and 88.3%, S/N = 21, respectively.
Saliva samples preparation
After thawing, the saliva sample was vortexed and centrifuged again (10 min, 3500 rpm) to get rid of potential precipitates. The 400-µL clear saliva sample was then transferred to a new Eppendorf-type tube (1.5 mL) and precipitated using an equal volume (400 µL) of a mixture of internal standards in acetonitrile. Precipitation was carried out on a vortex shaker for 10 s at room temperature. The protein-free supernatant was obtained by centrifugation (10 min, 1207 rcf, RT), separated from the precipitate and subjected to liquid-liquid extraction (LLE) using ethyl acetate (600 µL). LLE was carried on a vortex shaker for 60 s at room temperature (1207 rcf) and centrifuged for 10 min at room temperature (18,188 rcf). After this time, around 1000 µL of the supernatant was transferred to the new 96-well micro test plates U-bottom and dried for approximately 12 min at 50°C under a stream of nitrogen. The dried residue was then treated with 50 µL of derivatization reagent (3M hydrogen chloride in 1-butanol; Sigma-Aldrich, Poland). The reaction was carried out at 65°C for 20 min. The solution was then evaporated at 50°C under a stream of nitrogen. The dry residue was dissolved in 100 µL of a mobile phase mixture (60%A:40%B).
Method validation
Saliva curves were prepared using nonblank saliva samples, but samples with well-known concentrations of thyroid hormones were also spiked at suitable concentrations (standard addition method). Quantitative analysis was based on the ratio of the area of a given analyte peak to the area of the proper internal standard peak. The obtained values were compared with those from calibration curves.
The study adheres to the STROBE guidelines.
Statistical analysis
Compliance with the normal distribution was assessed with the Shapiro–Wilk test. Due to the noncompliance, descriptive statistics of concentrations were presented in medians and quartile ranges. The salivary thyroid hormone levels were compared between the three groups using the nonparametric Kruskal–Wallis test with Dunn’s post hoc test. We compared salivary and serum levels of thyroid hormonessaliva using the Wilcoxon test. Also, Spearman’s correlation coefficients were determined for the concentrations of thyroid hormones in serum and saliva. The receiver operating characteristics (ROC) analysis proposed the potential reference ranges for thyroid hormones in saliva (based on Youden’s index). For the potential cutoffs, the parameters of sensitivity and specificity were calculated. To compare serum levels of thyroid hormones depending on the measurement method, the Bland–Altman plots were demonstrated. The significance level was set at α = 0.05 for all analyses. The statistical analysis was performed with Statistica 13.3 (StatSoft, Cracow, Poland).
Bioethics
The Bioethical Committee of Poznan University of Medical Sciences approved this study (Decision No 357/20). All methods were performed under the relevant guidelines and regulations. 26 Each patient signed an informed consent.
Results
Characteristics of study participants
One hundred nine Caucasian patients (56% women, median age 48 years) were recruited. Fifty patients (45.9%) had no history of thyroid disease. Forty-two patients (38.5%) were previously diagnosed with hypothyroidism, among them thirty-two patients (76.2%) were supplemented with levothyroxine (LT4). Among hypothyroid patients, thirty-two patients (76.2%) had Hashimoto thyroiditis and ten patients (23.8%) were after thyroidectomy. Seventeen patients (15.5%) had Graves’ disease, and among them, seven patients (6.4%) were hyperthyroid. For statistical analysis, patients were divided according to TSH, and thyroid hormone concentrations were measured using ECLIA immunoassay. Table 1 presents a study group.
Characteristics of study participants.

TSH, fT3, and fT4 concentrations and antibody levels were performed using ECLIA-Cobas.
fT4, thyroxine; fT3, tri-iodothyronine; M (Q1–Q3), median with quartile range; LT4 levothyroxine; TgAb, thyroglobulin antibody; TPOAb, thyroid peroxidase antibody; TRAb, TSH-receptor antibody; TSH, thyroid stimulating hormone.
Correlations between serum levels of TSH, fT4, and fT3
First, the consistency of the results between the two methods for the determination of serum hormones was assessed (Table 2). Significant positive correlations for the marked hormones (TSH, fT3, and fT4) were found for both the whole group and the subgroups concerning the TSH reference values. The highest accordance between the tested methods was observed for the fT4 values. In contrast, the lowest accordance was found for TSH in intervals outside the reference range.
Correlations of serum levels of hormones between the two measurement methods for all patients and grouped by TSH levels.

p-Value < 0.05.
TSH was performed using ECLIA-Cobas.
1WNL, values within whole normal limits; 2LRL, values within the lower reference limits; 3WRR, values within the reference range; 4URL, values upper the reference limits; ECLIA-Cobas, Electrochemiluminescence (ECLIA) immunoassays Elecsys® Cobas e801, Roche; CLIA-LIAISON, Chemiluminescence immunoassay (CLIA) LIAISON XL®, DiaSorin; Rs, Spearman’s correlation coefficients.
fT4, thyroxine; fT3, tri-iodothyronine; TSH, thyroid stimulating hormone.
Based on the Bland–Altman plots (Figures 1–3), for the entire range, the two measurement methods did not differ significantly for serum TSH levels (p = 0.708). In contrast, both serum fT4 and fT3 levels were significantly lower for CLIA-LIAISON (p < 0.001), and these differences were higher with increasing mean levels of thyroid hormones.

Bland–Altman plot comparing serum levels of TSH depending on the measurement method.

Bland–Altman plot comparing serum levels of fT4 depending on the measurement method.

Bland–Altman plot comparing serum levels of fT3 depending on the measurement method.
Correlations between salivary and serum levels of thyroid hormones (fT4 and fT3)
Comparing the salivary and serum levels of thyroid hormones, we observed significantly lower fT4 and higher fT3 levels in saliva (p < 0.001), regardless of the measurement method. However, salivary levels of these thyroid hormones showed a significant positive correlation within the reference interval in the whole group (Table 3).
Correlations between salivary levels of thyroid hormones for all patients and grouped by TSH levels.
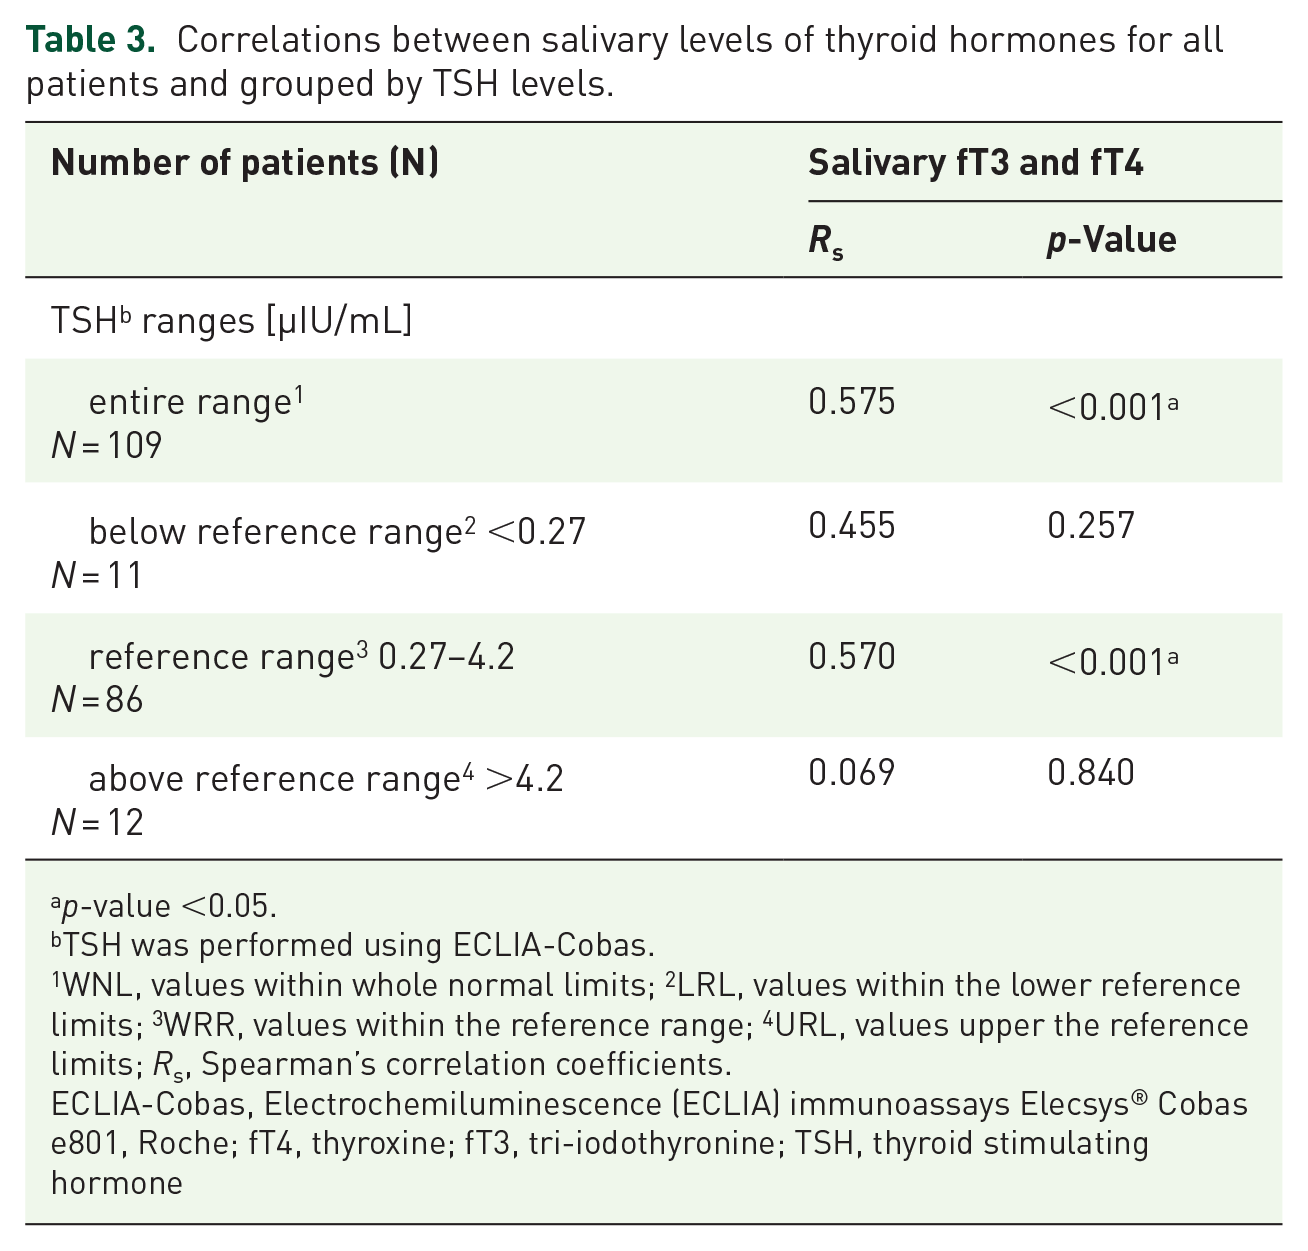
p-value <0.05.
TSH was performed using ECLIA-Cobas.
1WNL, values within whole normal limits; 2LRL, values within the lower reference limits; 3WRR, values within the reference range; 4URL, values upper the reference limits; Rs, Spearman’s correlation coefficients.
ECLIA-Cobas, Electrochemiluminescence (ECLIA) immunoassays Elecsys® Cobas e801, Roche; fT4, thyroxine; fT3, tri-iodothyronine; TSH, thyroid stimulating hormone
Subsequently, correlations between salivary and serum levels were investigated considering the established reference ranges for TSH (Table 4). Salivary fT4 levels were significantly positively correlated with serum fT4 levels measured using both methods. After subdividing by TSH levels, only fair correlations between salivary and serum fT4 for both methods in the reference range and a strong correlation for CLIA-LIAISON above the reference range were found. In turn, significant correlations between salivary and serum fT3 levels were observed for both methods only in the subgroup with TSH below the reference interval.
Correlations between salivary and serum levels of hormones for all patients and grouped by TSH levels.

p-Value < 0.05.
TSH was performed using ECLIA-Cobas.
1WNL, values within whole normal limits; 2LRL, values within the lower reference limits; 3WRR, values within the reference range; 4URL, values upper the reference limits; ECLIA-Cobas, electrochemiluminescence (ECLIA) immunoassays Elecsys® Cobas e801, Roche; CLIA-LIAISON, chemiluminescence immunoassay (CLIA) LIAISON XL®, DiaSorin; Rs, Spearman’s correlation coefficients.
TSH, thyroid stimulating hormone; fT4, thyroxine; fT3, tri-iodothyronine.
Levothyroxine therapy and thyroid hormone measurement
Interestingly, only patients with hypothyroidism who were not treated with LT4 had salivary fT4 and fT3 levels significantly correlated with serum levels in both methods (Table 5).
Correlations between salivary and serum levels of hormones for subgroups of patients with hypothyroidism, dependent on LT4 therapy.

p-value < 0.05.
TSH, thyroid stimulating hormone; fT4, thyroxine; fT3, tri-iodothyronine; LT4 levothyroxine; ECLIA-Cobas, electrochemiluminescence (ECLIA) immunoassays Elecsys® Cobas e801, Roche; CLIA-LIAISON, chemiluminescence immunoassay (CLIA) LIAISON XL®, DiaSorin; Rs, Spearman’s correlation coefficients.
Thyroid autoantibodies and thyroid hormones measurement
Salivary fT4 levels significantly positively correlated with serum fT4 levels for both methods in patients with increased TPOAb or TgAb and for only ECLIA-Cobas in patients with increased TRAb (Table 6). In contrast, salivary fT3 levels did not correlate significantly with serum fT3 in this group.
Correlations between salivary and serum levels of hormones for subgroups of patients with altered levels of thyroid autoantibodies.

p-Value < 0.05.
fT4, thyroxine; fT3, tri-iodothyronine; TRAb, TSH-receptor antibody; TPOAb, thyroid peroxidase antibody; TgAb, thyroglobulin antibody; ECLIA-Cobas, electrochemiluminescence (ECLIA) immunoassays Elecsys® Cobas e801, Roche; CLIA-LIAISON, chemiluminescence immunoassay (CLIA) LIAISON XL®, DiaSorin; Rs, Spearman’s correlation coefficients.
Comparison of salivary levels of fT3 and fT4 depending on serum level of TSH
Salivary fT4 levels were significantly lower in the subgroup with TSH above 4.2 µU/mL compared to the patients with TSH in the reference range and below it (for the Dunn’s post hoc test: p = 0.008 and p = 0.001, respectively; Figure 4). In contrast, salivary fT3 levels were significantly higher in the patients with TSH below 0.27 µU/mL than in those with normal TSH and above the reference interval (for the Dunn’s post hoc test: p = 0.039 and p = 0.003, respectively; Figure 5).

Receiver operating characteristics curve determining the potential of salivary fT3 to discriminate the patients with serum TSH below 0.27 µU/mL (with presented proposed cut-off based on the Youden’s index).

Comparison of salivary levels of fT3 depending on the serum level of TSH.
Therefore, ROC analysis was performed for salivary fT4 discriminating the group with serum TSH above 4.2 µU/mL (Figure 6) and for salivary fT3 discriminating the group with serum TSH below 0.27 µU/mL (Figure 7). Both potential predictors showed statistical significance, and in the ROC curves, the proposed cut-off points (according to the Youden’s index) were suggested. So, the lower reference limit for salivary fT4 could be 6.3 pg/mL (with 81.8% of sensitivity and 71.8% of specificity) and the upper reference limit for salivary fT3 154.9 pg/mL (with 62.5% of sensitivity and 89.8% of specificity). However, it would be advisable to determine the potential reference ranges for these two thyroid hormones in saliva in a larger population.

Receiver operating characteristics (ROC) curve determining the potential of salivary fT4 to discriminate the patients with serum TSH above 4.2 µU/mL (with presented proposed cut-off based on the Youden’s index). free thyroxine (fT4); area under curve (AUC); confidence interval (CI).
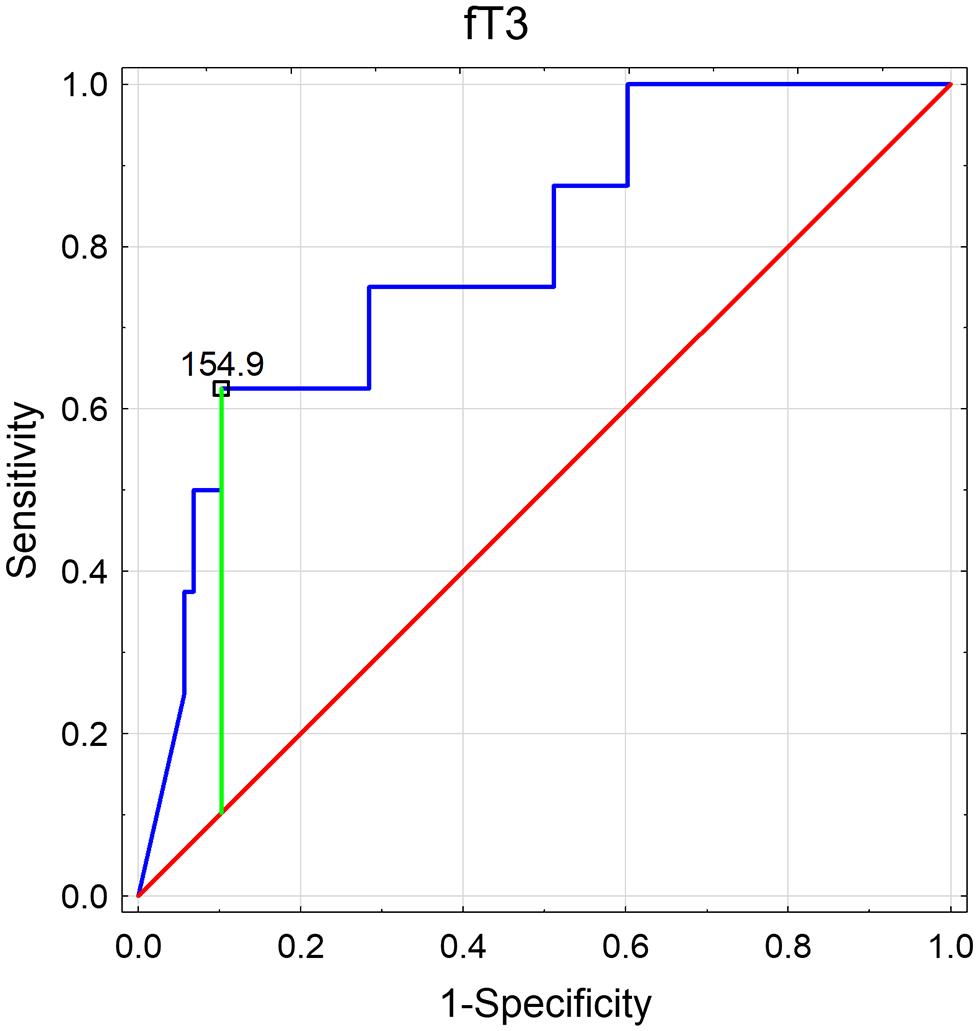
Receiver operating characteristics (ROC) curve determining the potential of salivary fT3 to discriminate the patients with serum TSH below 0.27 µU/mL (with presented proposed cut-off based on the Youden’s index). free triiodothyronine (fT3); area under curve (AUC); confidence interval (CI).
Discussion
Based on the data obtained in our study, we postulate that there are substantial reasons to continue research studies on saliva as an alternative fluid to blood for estimating thyroid function. Saliva presents great potential when it comes to clinical utility. Saliva may be vital when blood sampling is difficult or undesirable. Saliva can be collected with simple equipment by patients at home and stored for significantly longer than blood. Thus, it is cost-effective and less burdening for the healthcare system. Saliva collection is also safer for medical personnel as it reduces the risk of transmission of blood-borne diseases. 27 To our knowledge, there are no comprehensive studies on saliva encompassing patients with various thyroid disorders. We analyzed the consistency between saliva and blood in hyper-, hypo- and euthyroid patients. Additionally, we assessed salivary hormone levels in subjects with hypothyroidism, both those on levothyroxine and those without treatment, and in patients with circulating antithyroid antibodies.
First, we compared salivary and serum levels of thyroid hormones. Contrary to the typical fT3/fT4 serum ratio, we observed significantly lower fT4 and higher fT3 levels in saliva (p < 0.001), regardless of the measurement method. Adversely, in a study by Naresh et al. fT4 levels were higher in serum than in saliva, but fT3 concentrations were similar in both fluids. 23 There are experimental studies suggesting that sublingual glands express 5′-deiodinase. Its activity represents approximately 80% of the same enzyme in the liver. fT4 present in saliva may be metabolized to fT3, thus altering fT4 and fT3 salivary concentrations. 28 Another vital factor possibly influencing the ft3/ft4 ratio is a system of transportation of thyroid hormones to saliva. 27 Those mechanisms may reduce the utility of thyroid salivary hormone measurement in a clinical setting.
In the whole examined group, salivary fT3 and fT4 were well correlated. Salivary fT4 was not related to other serum hormones in patients with hyperthyroidism, while in euthyroid cases, it is correlated with serum fT4. Salivary fT3 did not correlate with any assessed hormone in euthyroid and hypothyroid patients. However, in the whole group, it was associated with fT4. Still, those results might be partially attributed to the low sensitivity and specificity of the serum test in comparison to LC-MS/MS. Liquid chromatography with tandem mass spectrometry analytical technique is more accurate and may detect even a small amount of tested substance. 29 In the case of thyroid hormones, LC-MS/MS may eliminate inherent problems of widely available immunoassays (e.g., interferences), which are dependent on the binding protein. 24 Furthermore, we found a potency of salivary levels of fT3 and fT4 to discriminate between hyper-and hypothyroid patients (defined as TSH below 0.27 µU/mL (for fT3) and TSH above 4.2 µU/mL (for fT4)). However, our results should be validated on a larger population. Interestingly, salivary fT4 correlated with serum hormones only in a subject without hormonal substitution. Adversely, in patients on levothyroxine therapy, salivary fT3 was associated with serum TSH but neither with fT3 nor fT4. It can be postulated that exogenous levothyroxine influences salivary fT4 and partially fT3 concentration.
Data on the value of salivary thyroid hormones are limited. The first reports are dated back to 80. Twentieth century, when Elson et al. suggested that thyroid hormones might be transported to the saliva bound to plasma proteins. 21 Putz et al. reported that salivary T4 reflects serum levels. They indicated that T4 might be actively transported from extracellular fluid to saliva and concentrated by the salivary gland. In their study, salivary T4 levels were independent of serum TBG fluctuations. So they suggested that salivary T4 could represent serum fT4. 22 More recently, Higashi et al. evaluated stable isotope-dilution liquid chromatography with tandem mass spectrometry to estimate T4 salivary levels. They compared T4 salivary concentration in patients with hyperthyroidism and euthyroidism. There was a significant difference between levels of T4 in the tested groups. The authors concluded that salivary T4 measured using LC-MS/MS might be helpful in a clinical setting. 18
On the other hand, the utility of salivary thyroid hormones has been questioned. First, the pathway of transport to saliva is dubious. It has been hypothesized that thyroid hormones enter saliva by active transport, 22 ultrafiltration route, contamination of the saliva by plasma or gingival fluid, 30 or even passive diffusion. 22 Hoffman et al. indicated that the concentration of polar hormones like thyroxine is determined by the variation of saliva flow rate and thus is unreliable. 31 Naresh et al. compared free and total thyroid hormones and TSH in saliva and serum. fT4 was significantly higher in serum than saliva but lower than T4 in saliva. Levels of serum hormones, excluding fT3, were higher than salivary. However, a correlation exists only between salivary and serum TSH. There was a lack of agreement on Bland–Altman and mountain plots. They concluded that saliva could not be an alternative to serum in assessing thyroid function. 23 Their results are in agreement with a theory that TSH and other peptide hormones are too large to pass to saliva. 27 But, this study has significant disadvantages, like small group and assessment of thyroid hormones in saliva using commercially available immunoassays. 22
The main limitation of the study is the relatively small sample size and lack of sample size calculation, but the exclusion criteria and laboratory methods applied allowed us to select a group without confounding factors.
In conclusion, we have demonstrated that salivary hormone levels at least partially reflect the concentration of their serum equivalents. It indicates that salivary thyroid hormone evaluation might be clinically significant even in patients with elevated antithyroid antibodies. However, salivary thyroid hormones might not reflect their serum levels in patients treated with levothyroxine. Our study provided data supporting further research on saliva as a diagnostic tool to assess thyroid function.
Supplemental Material
sj-docx-2-tae-10.1177_20420188241277414 – Supplemental material for Measurement of salivary thyroid hormones using the LC-MS/MS technique in a clinical setting
Supplemental material, sj-docx-2-tae-10.1177_20420188241277414 for Measurement of salivary thyroid hormones using the LC-MS/MS technique in a clinical setting by Nadia Sawicka-Gutaj, Piotr Glinicki, Kacper Nijakowski, Barbara Bromińska, Magdalena Ostrowska, Alicja Szatko, Zuzanna Sobol, Konrad Kowalski, Paweł Wilk, Wojciech Zgliczyński and Marek Ruchała in Therapeutic Advances in Endocrinology and Metabolism
Supplemental Material
sj-pptx-1-tae-10.1177_20420188241277414 – Supplemental material for Measurement of salivary thyroid hormones using the LC-MS/MS technique in a clinical setting
Supplemental material, sj-pptx-1-tae-10.1177_20420188241277414 for Measurement of salivary thyroid hormones using the LC-MS/MS technique in a clinical setting by Nadia Sawicka-Gutaj, Piotr Glinicki, Kacper Nijakowski, Barbara Bromińska, Magdalena Ostrowska, Alicja Szatko, Zuzanna Sobol, Konrad Kowalski, Paweł Wilk, Wojciech Zgliczyński and Marek Ruchała in Therapeutic Advances in Endocrinology and Metabolism
Footnotes
References
Supplementary Material
Please find the following supplemental material available below.
For Open Access articles published under a Creative Commons License, all supplemental material carries the same license as the article it is associated with.
For non-Open Access articles published, all supplemental material carries a non-exclusive license, and permission requests for re-use of supplemental material or any part of supplemental material shall be sent directly to the copyright owner as specified in the copyright notice associated with the article.