
Abstract
Background:
Non-alcoholic fatty liver disease (NAFLD) is a common liver condition affecting 25%–40% of the worldwide population. NAFLD is traditionally related to obesity and metabolic disorders. NAFLD can also affect non-obese individuals, termed “lean NAFLD” (LN), who exhibit a paradoxical combination of physical leanness and metabolic obesity. Factors contributing to LN remain unclear, necessitating further research. This analysis aims to understand LN’s prevalence and metabolic characteristics compared to obese NAFLD (ON) populations.
Methods:
This meta-analysis searched various databases until August 1, 2023. Inclusion criteria involved observational studies comparing LN with overweight/obese NAFLD. Data extraction included baseline characteristics, disease occurrence, metabolic profile, and clinical parameters—statistical analysis employed calculating risk ratios (RR) and standard mean differences.
Results:
Twenty-five studies were analyzed. LN is associated with lower prevalence in both NAFLD (RR 0.27, 95% confidence interval (CI) 0.14–0.52, p = <0.0001) and total (RR 0.27, 95% CI 0.15–0.51, p < 0.0001) population. LN had lower diabetes mellitus (RR 0.78, 95% CI 0.71–0.87, p < 0.00001), dyslipidemia (RR 0.87, 95% CI 0.79–0.95, p = 0.002), hypertension (RR 0.80, 95% CI 0.74–0.87, p < 0.00001), and metabolic syndrome (RR 0.45, 95% CI 0.31–0.64, p < 0.00001) compared to those with ON. The LN group’s lipid profile, blood pressure, and other clinical parameters were favorable compared to ON.
Conclusion:
The prevalence of NAFLD among lean and non-lean individuals varies by region. Our analysis revealed that LN is associated with lower metabolic diseases, fasting blood sugar, blood pressure, and a more favorable lipid profile compared to ON.
Plain language summary
Non-alcoholic fatty Liver Disease (NAFLD) is a prevalent liver condition affecting a substantial portion of the global population, commonly linked to obesity and metabolic disorders. However, a subset of individuals with NAFLD, termed “lean NAFLD” (LN), challenges the conventional association by presenting with physical leanness despite metabolic obesity. The factors contributing to this condition are not well understood, prompting this meta-analysis to explore the prevalence and metabolic characteristics of LN compared to obese NAFLD (ON) populations. The study, conducted through August 1st, 2023, analyzed 25 studies meeting inclusion criteria, which involved observational studies comparing LN with Overweight/Obese NAFLD. Data extraction included baseline characteristics, disease occurrence, metabolic profiles, and clinical parameters. Statistical analysis utilized risk ratios (RR) and standard mean differences. The results indicated that LN is associated with a significantly lower prevalence in both the NAFLD and general populations. LN demonstrated lower occurrences of diabetes (DM), dyslipidemia, hypertension, and metabolic syndrome compared to ON. Additionally, the LN group exhibited a more favorable lipid profile, blood pressure, and other clinical parameters in comparison to the ON group. In conclusion, the prevalence of NAFLD varies among lean and non-lean individuals across different regions. The meta-analysis revealed that LN is linked to a lower occurrence of metabolic diseases, lower fasting blood sugar levels, lower blood pressure, and a more favorable lipid profile compared to those with ON. These findings contribute valuable insights into the distinct metabolic characteristics of LN, shedding light on potential avenues for further research and clinical considerations in the understanding and management of NAFLD.
Introduction
Non-alcoholic fatty liver disease (NAFLD) arises from fat accumulation in the liver. It is one of the most prevalent liver-related pathologies, impacting 25%–40% of the global population. 1 NAFLD encompasses a broad spectrum of liver-related conditions, including steatosis, which can progress to steatohepatitis and advanced fibrosis, potentially culminating in cirrhosis. 2 It is a prevalent condition affecting a significant portion of the general population, elevating the risk of individuals developing a range of systemic complications. These complications encompass diabetes mellitus (DM), chronic kidney disease, extra-hepatic and hepatic malignancies, and cardiovascular diseases.3,4 NAFLD has been intricately associated with obesity, which is closely intertwined with many metabolic disorders. These disorders include abnormal lipid profiles, fatty acid cytotoxicity, and insulin resistance (IR). 5 NAFLD disturbs lipid and glucose homeostasis, primarily through IR. De novo lipogenesis and IR play a major role in fat accumulation in the liver. 6 Approximately 70%–75% of NAFLD patients are diagnosed with type 2 DM, and around 60% also meet the criteria for metabolic syndrome (MS). Notably, 90% of obese individuals are affected by NAFLD. 7 Recently, there has been a significant revision in the definition of NAFLD, now called metabolic-associated fatty liver disease (MAFLD). This updated terminology underscores the importance of metabolic dysfunction in conjunction with the presence of fatty liver. 8
NAFLD can manifest in individuals who are not classified as obese, typically with a body mass index (BMI) less than 30 kg/m2 in non-Asians or less than 27.5 kg/m2 in Asians, and even in those who fall within the normal-weight range, with a BMI less than 25 kg/m2 in non-Asians or less than 23 kg/m2 in Asians. 9 It has been revealed that non-obese patients with NAFLD exhibit an abnormal metabolic profile compared to those without the condition, placing them at an increased risk of cardiovascular morbidity and mortality. Physicians often refer to this group as “physically lean but metabolically obese” due to this paradoxical combination of their physical appearance and metabolic health. 9 This lean phenotype is observed in about 25% of the NAFLD population. While it was initially presumed that this lean variant might be less severe than its obese counterpart, emerging evidence indicates that individuals with lean NAFLD (LN) face a more challenging clinical course, including a higher risk of severe liver disease, reduced survival rates, advanced fibrosis, and an overall poorer prognosis. 10
There is a notable lack of consensus regarding the factors associated with lean and obese NAFLD (ON) populations. Some factors that have been identified include differences in age, genetic predisposition, and the stage of fibrosis. However, it is important to underscore that more extensive research is required to fully understand the factors contributing to LN, particularly given that risk factors and prognosis can vary among racial or ethnic groups. Further investigations are essential to unravel the complexities of this condition and its diverse manifestations. 7 In this research, we performed an extensive meta-analysis of the available literature to assess the overall occurrence and metabolic attributes of LN in comparison to ON.
Methods
Data sources and search strategy
This meta-analysis adhered to the Preferred Reporting Items for Systematic Reviews and Meta-Analyses (PRISMA) guidelines to ensure a rigorous and standardized approach. 11 In pursuit of a comprehensive and unbiased search, PubMed and Cochrane Library databases were searched, spanning publications till August 1, 2023. The dual-database search was designed to mitigate the potential for publication bias. Our search strategy was meticulously crafted, employing a well-constructed search string to identify studies relevant to our research. This search string encompassed a myriad of MeSH terms, including but not limited to “Diabetes Mellitus,” “Dyslipidemias,” “Hypertension,” “Metabolic Syndrome,” “Non-alcoholic Fatty Liver Disease,” and “Obesity.” Subsequently, articles were manually retrieved and assessed for further evaluation.
Inclusion criteria
The study selection criteria were as follows: (a) inclusion of only observational studies, (b) comparison of LN with overweight/obese NAFLD in the selected studies, (c) lean was defined within the parameters of the shortlisted article as individuals with a BMI of ⩽25 kg/m2, and for the Asian population, a BMI of ⩽23 kg/m2, (d) overweight/obese individuals were those with a BMI of ⩾25.0 kg/m2, and for the Asian population, a BMI ⩾23 kg/m2, and (e) inclusion of studies that reported outcomes of interest. Articles in Languages apart from English and non-observational studies were excluded from the analysis. These criteria were applied to ensure the relevance and consistency.
Data extraction and quality assessment
We meticulously reviewed relevant studies in the initial screening phase to filter out those failing to meet our predefined eligibility criteria. In order to prevent the inclusion of duplicate articles, we employed the EndNote Reference Library program. Subsequently, we obtained the full-text versions of shortlisted articles and subjected them to a thorough examination to determine their suitability for inclusion in our meta-analysis. Four authors collaborated to extract pertinent information from each included study to maintain consistency and accuracy in the data extraction process. These data encompassed baseline characteristics and all outcomes of interest. The primary outcomes were to explore the prevalence of LN compared to ON in both the entire NAFLD cohort and the general population.
Additionally, we sought to examine the occurrence of systemic diseases and the presence of MS in lean versus ON patients. Our secondary outcomes of interest encompassed a comparative analysis of critical clinical parameters, including high-density lipoprotein (HDL) and low-density lipoprotein (LDL) cholesterol levels, triglycerides, systolic and diastolic blood pressures (BPs), waist circumference (WC), and fasting blood sugar (FBS) levels between lean and ON patients. Any discrepancies or uncertainties arising during the data extraction process were addressed through collaborative discussions among the authors to ensure the integrity of the data. One of our authors employed the Newcastle Ottawa Scale (NOS) for the quality assessment of the included studies. 12
Statistical analysis
For the statistical analysis in our study, we utilized Revman Version 5.4.1. To assess the significance of differences between LN and ON groups, we calculated the risk ratio (RR) and standard mean difference (SMD) outcomes, along with their respective 95% confidence intervals (CIs). In cases where studies exhibited substantial heterogeneity, we employed the I 2 statistic, considering values less than 50% indicative of mild heterogeneity. Sensitivity analysis using the leave-one-out method was performed for studies with high heterogeneity. We regarded a p value below 0.05 as having statistical significance, signifying the presence of a meaningful difference between the groups.
Results
Studies selection
A comprehensive literature search in databases such as PubMed, Medline, and Cochrane identified an initial total of 3025 papers. After eliminating duplicates, 1293 unique records remained for further screening, and subsequent evaluation of titles and abstracts led to the selection of 64 articles for detailed examination. After a meticulous review, 25 articles were shortlisted13–33 (Figure 1).
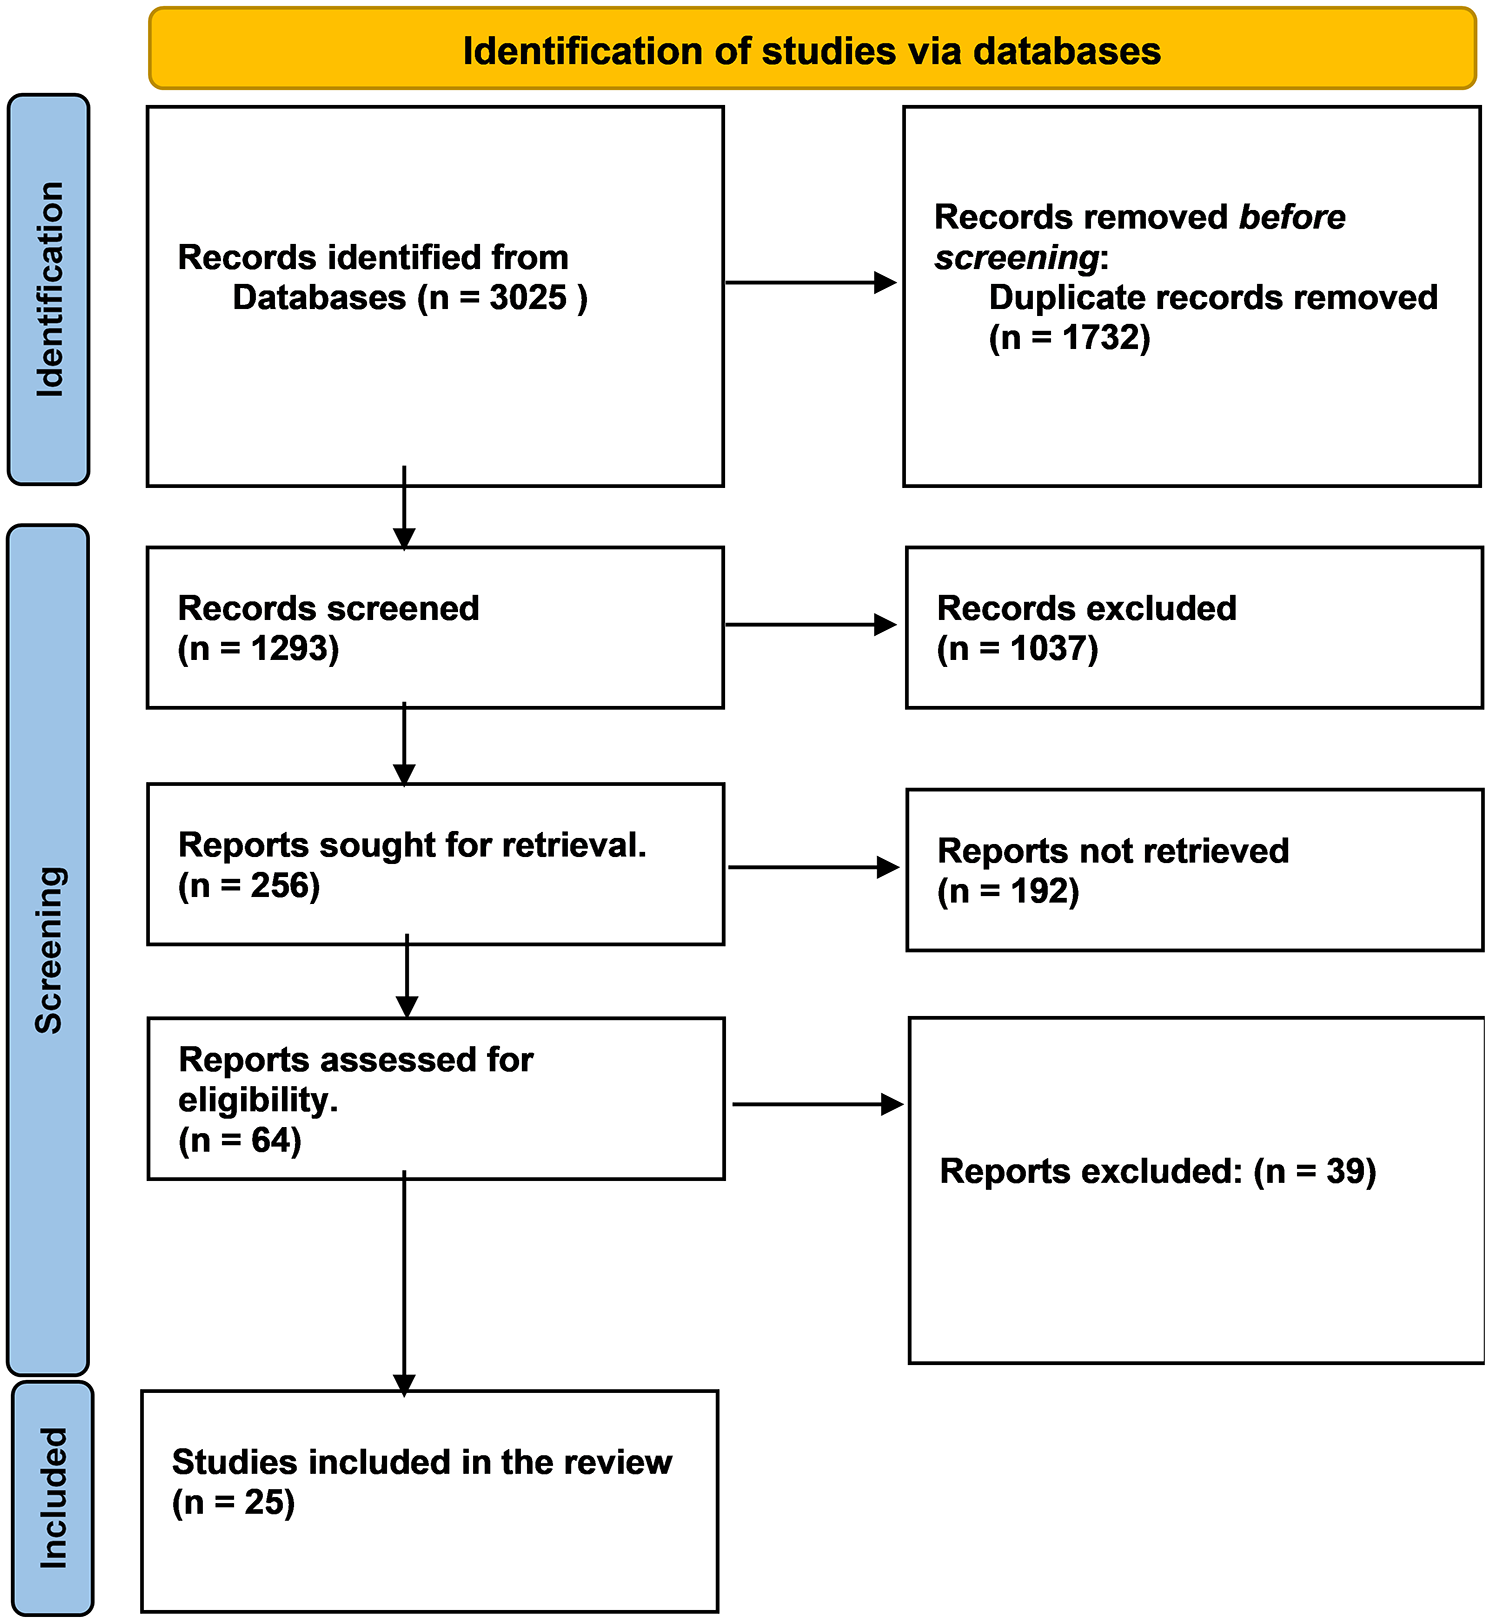
PRISMA flowchart.
Characteristics of the included studies
Twenty-five meticulously chosen observational studies, 14 cohorts, and 11 cross-sectional studies were analyzed. They were conducted across a diverse array of geographic regions, including the United States of America, India, China, Italy, Spain, South Korea, Japan, Singapore, Bangladesh, Austria, Thailand, and Saudi Arabia. These studies were designed to address a wide spectrum of population characteristics. The sample sizes in these studies were quite variable, with participant numbers ranging from as low as 113 to a substantial 194,787, totaling 263,756 individuals diagnosed with NAFLD. The follow-up durations in these studies spanned a broad range, from as short as 1 year to as long as 37 years, with the combined average follow-up period across all the studies amounting to 9.4 years. The average mean age of participants hovered around 57.119 (4.1203) years for lean individuals and 51.412 (9.0101) for obese (Table 1).
Baseline characteristics.

NAFLD, non-alcoholic fatty liver disease.
Quality assessment
We employed the NOS to evaluate the study quality, with a * being awarded for each category, results in Supplemental Table S1. Majority of our studies were deemed to exhibit minimal risk of bias, affirming their high level of reliability.
Prevalence
Prevalence data comparing LN to overweight or ON patients among the total NAFLD and general population indicate that LN is significantly less common. In the analysis of total NAFLD patients, the prevalence of LN was notably lower in Asia (RR 0.24, 95% CI 0.16–0.38, p < 0.0001), Europe (RR 0.36, 95% CI 0.23–0.56, p < 0.00001), North America (RR 0.33, 95% CI 0.09–1.30, p < 0.11), and total (RR 0.27, 95% CI 0.14–0.52, p < 0.0001). Among the Asian population, 11.7% of NAFLD cases were found in the lean population, while 88.0% were among the non-lean, indicating a slightly higher prevalence in this group. In the European population, 20% were lean, and 79% were non-lean. Among the North American countries, 55.2% were non-lean, and 44.8% were lean. In total, 48.6% of the diagnosed NAFLD cases were in the lean population, and 51.4% were in the non-lean population, showing a nearly equal distribution (Figure 2).

Forest plot for lean NAFLD versus obese NAFLD for prevalence in total NAFLD population: (3.1.1) Asia; (1.1.2) Europe; (3.1.3) North America.
Similar trends were observed in the prevalence of LN within the general population, with (RR 0.24, 95% CI 0.16–0.37, p < 0.00001) in Asia, (RR 0.34, 95% CI 0.23–0.51, p < 0.00001) in Europe (RR 0.33, 95% CI 0.08–1.31, p = 0.12) in North America, and (RR 0.27, 95% CI 0.15–0.51, p = <0.0001) in total. The prevalence of NAFLD was 2.8% among the lean Asian population, with 21.1% occurring in non-lean individuals. Among the European population, 8.1% of lean individuals had NAFLD, and 32.4% of non-lean individuals had the condition. In the North American population, the prevalence was 0.33% among the lean population and 0.27% among the non-lean population. In the total population, the prevalence was 0.34% among lean individuals and 0.36% among those who were either obese or non-lean and had NAFLD (Figure 3).
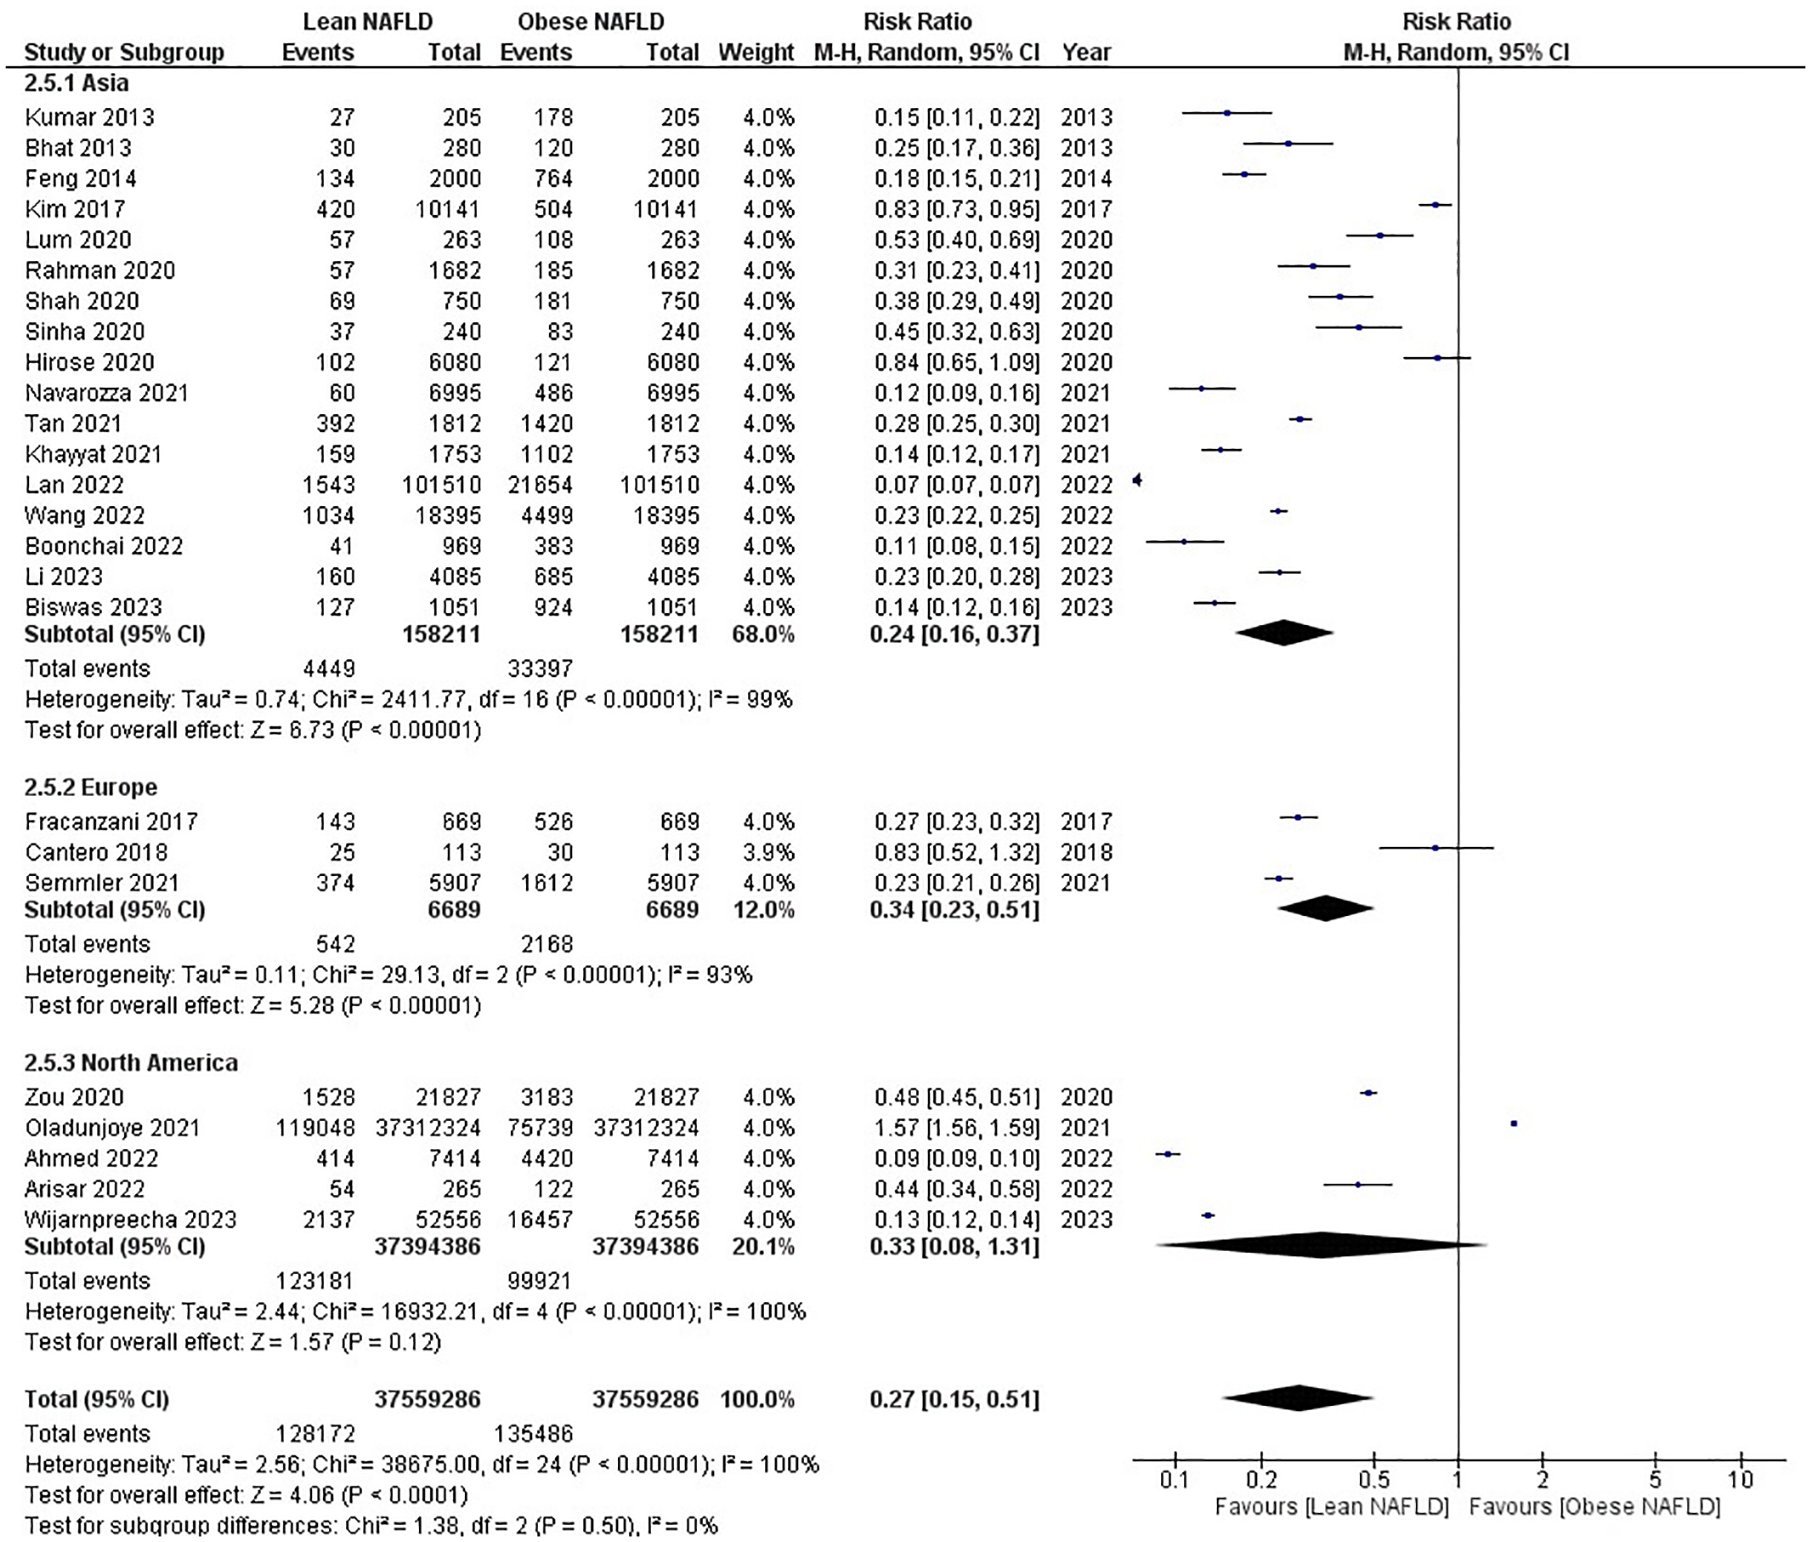
Forest plot for lean NAFLD versus obese NAFLD for prevalence in total population: (2.5.1) Asia; (2.5.2) Europe; (2.5.3) North America.
These prevalence figures underscore the global distribution of lean and ON and provide context for interpreting the impact of body composition on the metabolic outcomes observed in the meta-analysis.
Systemic diseases
Regarding metabolic health outcomes, the meta-analysis revealed that individuals with LN have more favorable results than those with ON. LN individuals showed a 22% lower risk of developing DM (RR 0.78, 95% CI 0.71–0.87, p < 0.00001), a 13% lower risk of dyslipidemia (RR 0.87, 95% CI 0.79–0.95, p < 0.002), a 20% lower risk of hypertension (HTN) (RR 0.80, 95% CI 0.74–0.87, p < 0.00001), and a remarkable 55% lower risk of MS (RR 0.45, 95% CI 0.31–0.64, p < 0.00001) compared to those with ON. Heterogeneity was high in all outcomes for which sensitivity analysis was performed. These findings indicate that individuals with LN are less prone to these metabolic disorders than those with ON (Figure 4).
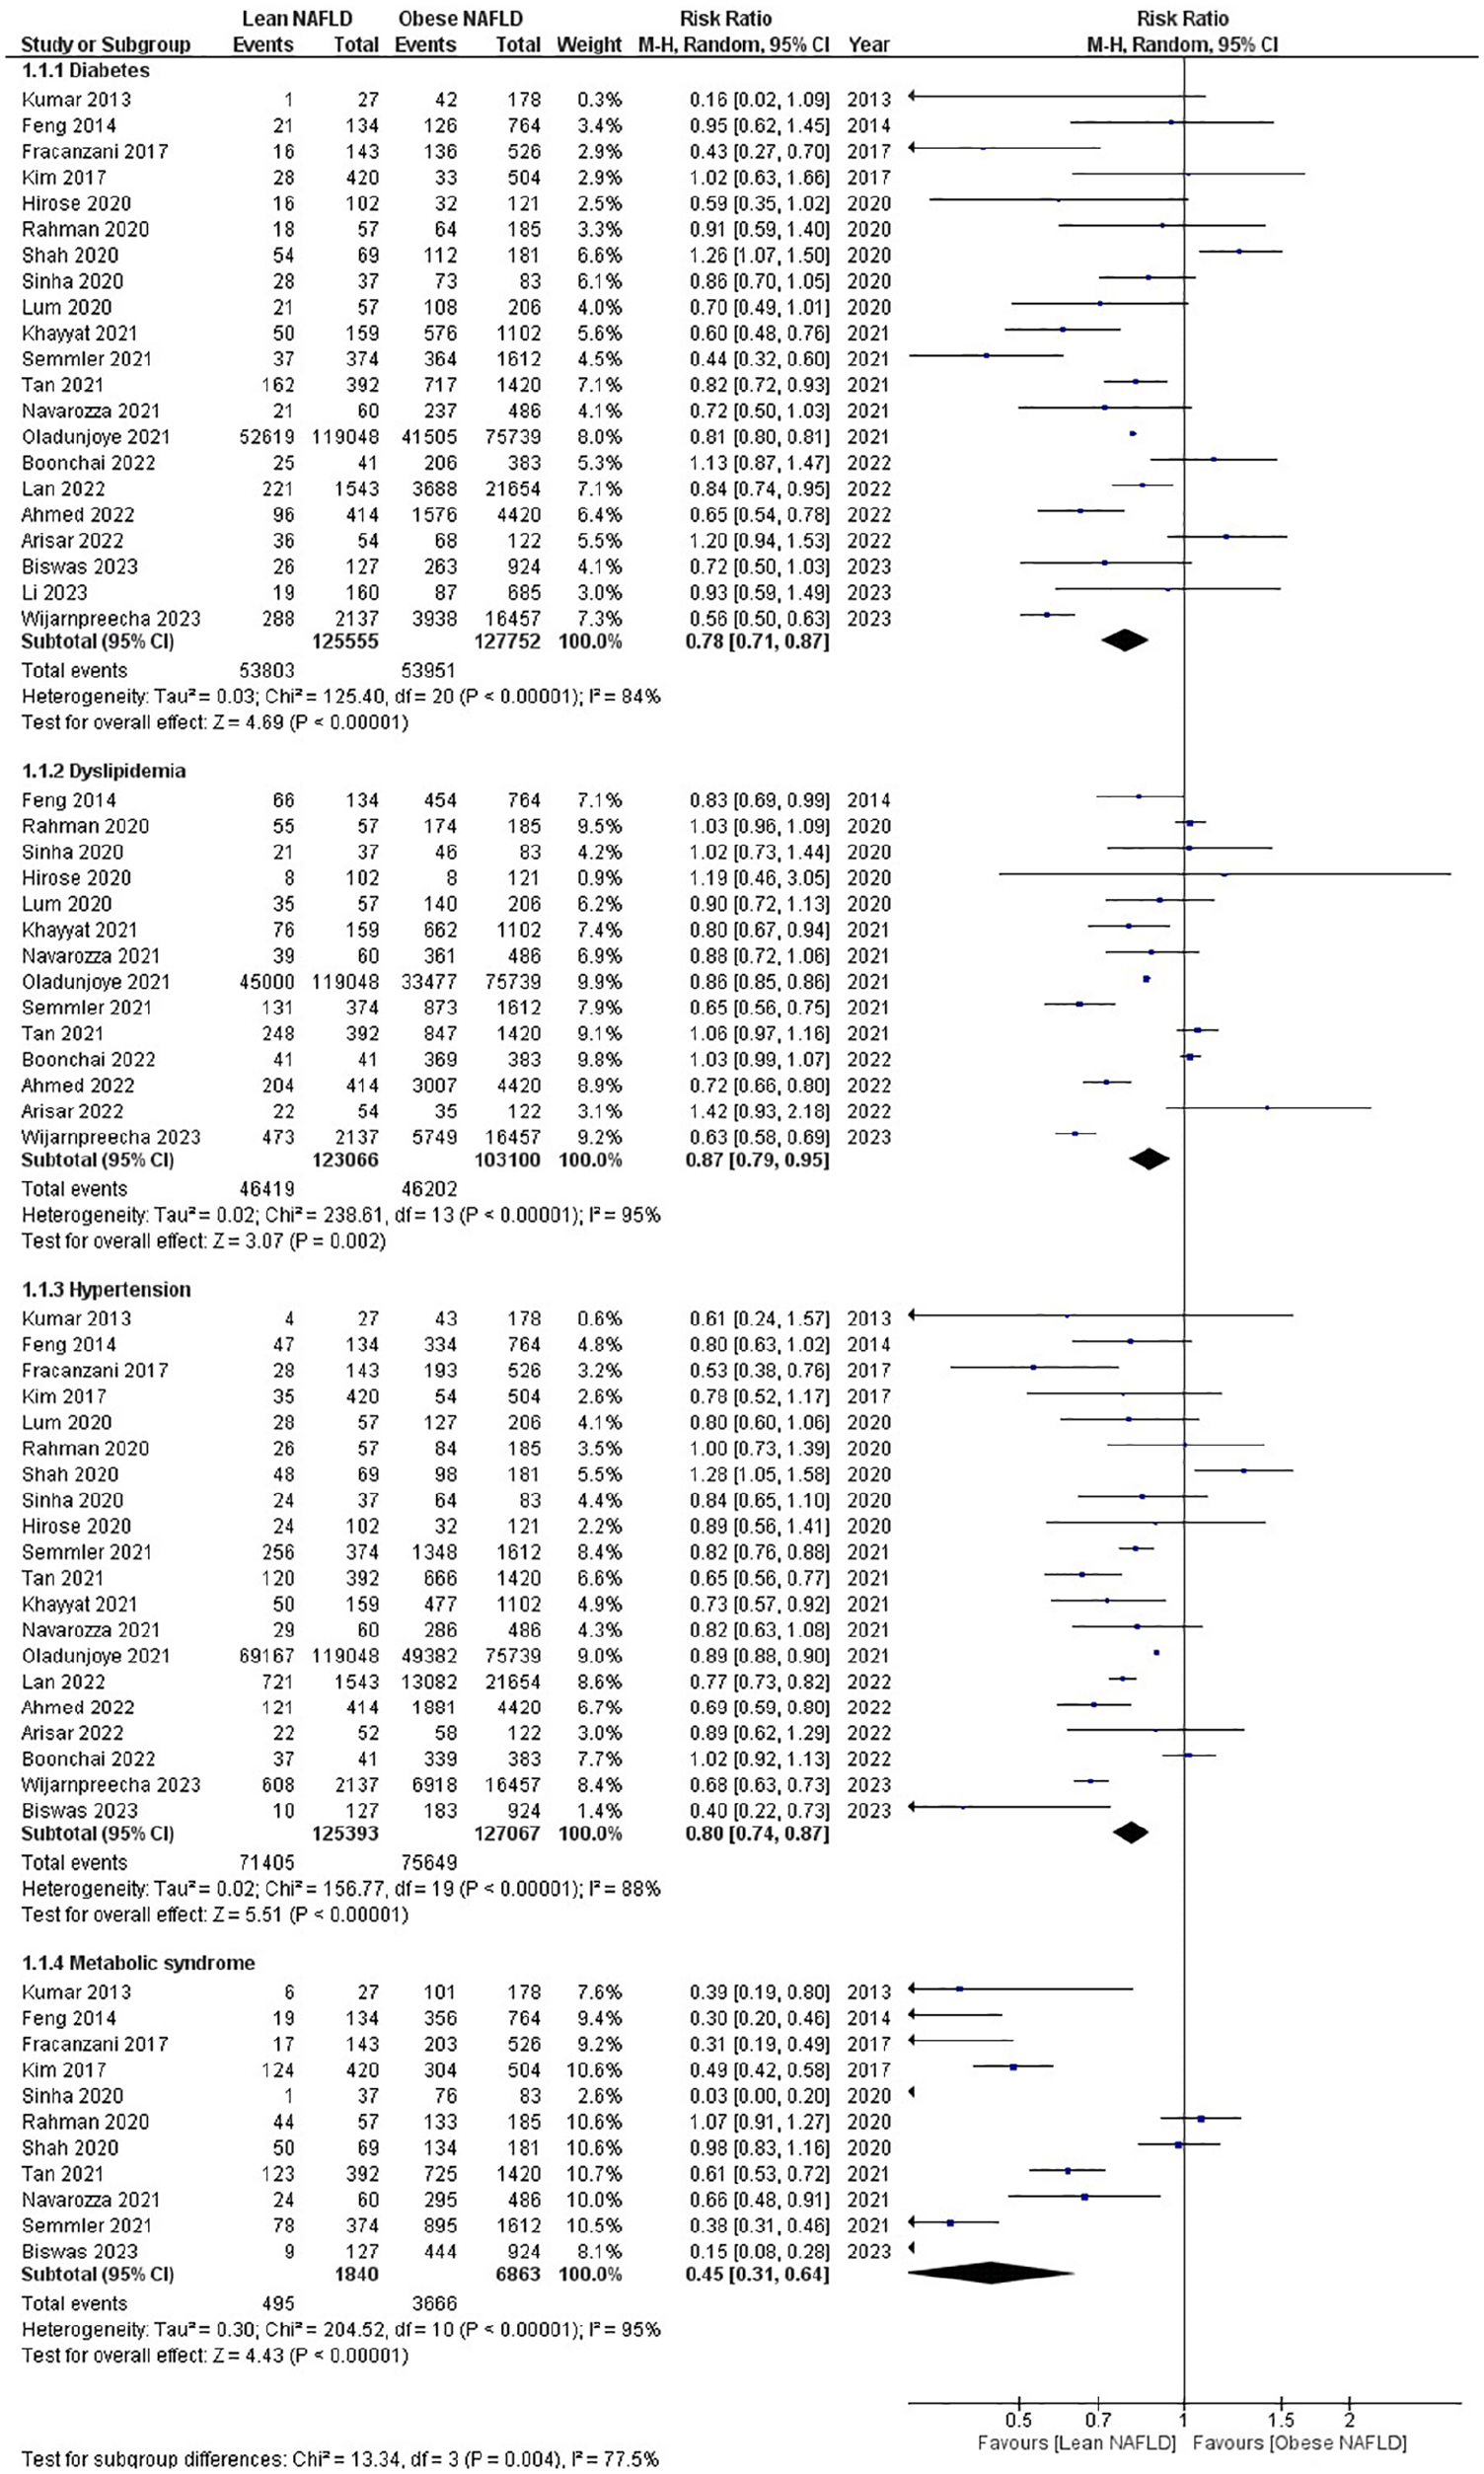
Forest plot for lean NAFLD versus obese NAFLD for systemic diseases: (1.1.1) Diabetes; (1.1.2) Dyslipidemia; (1.1.3) Hypertension; (1.1.4) Metabolic Syndrome.
Lipid profile
Regarding lipid profiles, LN individuals exhibited more favorable outcomes than their ON counterparts. Specifically, they had higher levels of HDL (SMD 0.29, 95% CI 0.17–0.41, p < 0.00001) and lower levels of triglycerides (SMD −0.21, 95% CI −0.30 to −0.11, p < 0.0001) and LDL (SMD −0.09, 95% CI −0.16 to −0.02, p = 0.01). Heterogeneity was high in all outcomes for which sensitivity analysis was performed. These differences in lipid levels suggest that LN may have a lower cardiovascular risk than those with ON (Figure 5).

Forest plot for lean NAFLD versus obese NAFLD for lipid profile: (2.1.2) HDL; (2.1.3) LDL; (2.1.4) Triglycerides.
Blood pressure
When considering BP measurements, LN individuals showed slightly lower levels of both systolic (SMD −0.23, 95% CI −0.36 to −0.11, p < 0.0003) and diastolic (SMD −0.27, 95% CI −0.37 to −0.16, p < 0.00001) BP compared to individuals with ON. Heterogeneity was high in all outcomes for which sensitivity analysis was performed. These findings imply that individuals with LN may have better cardiovascular health regarding BP regulation than those with ON (Figure 6).
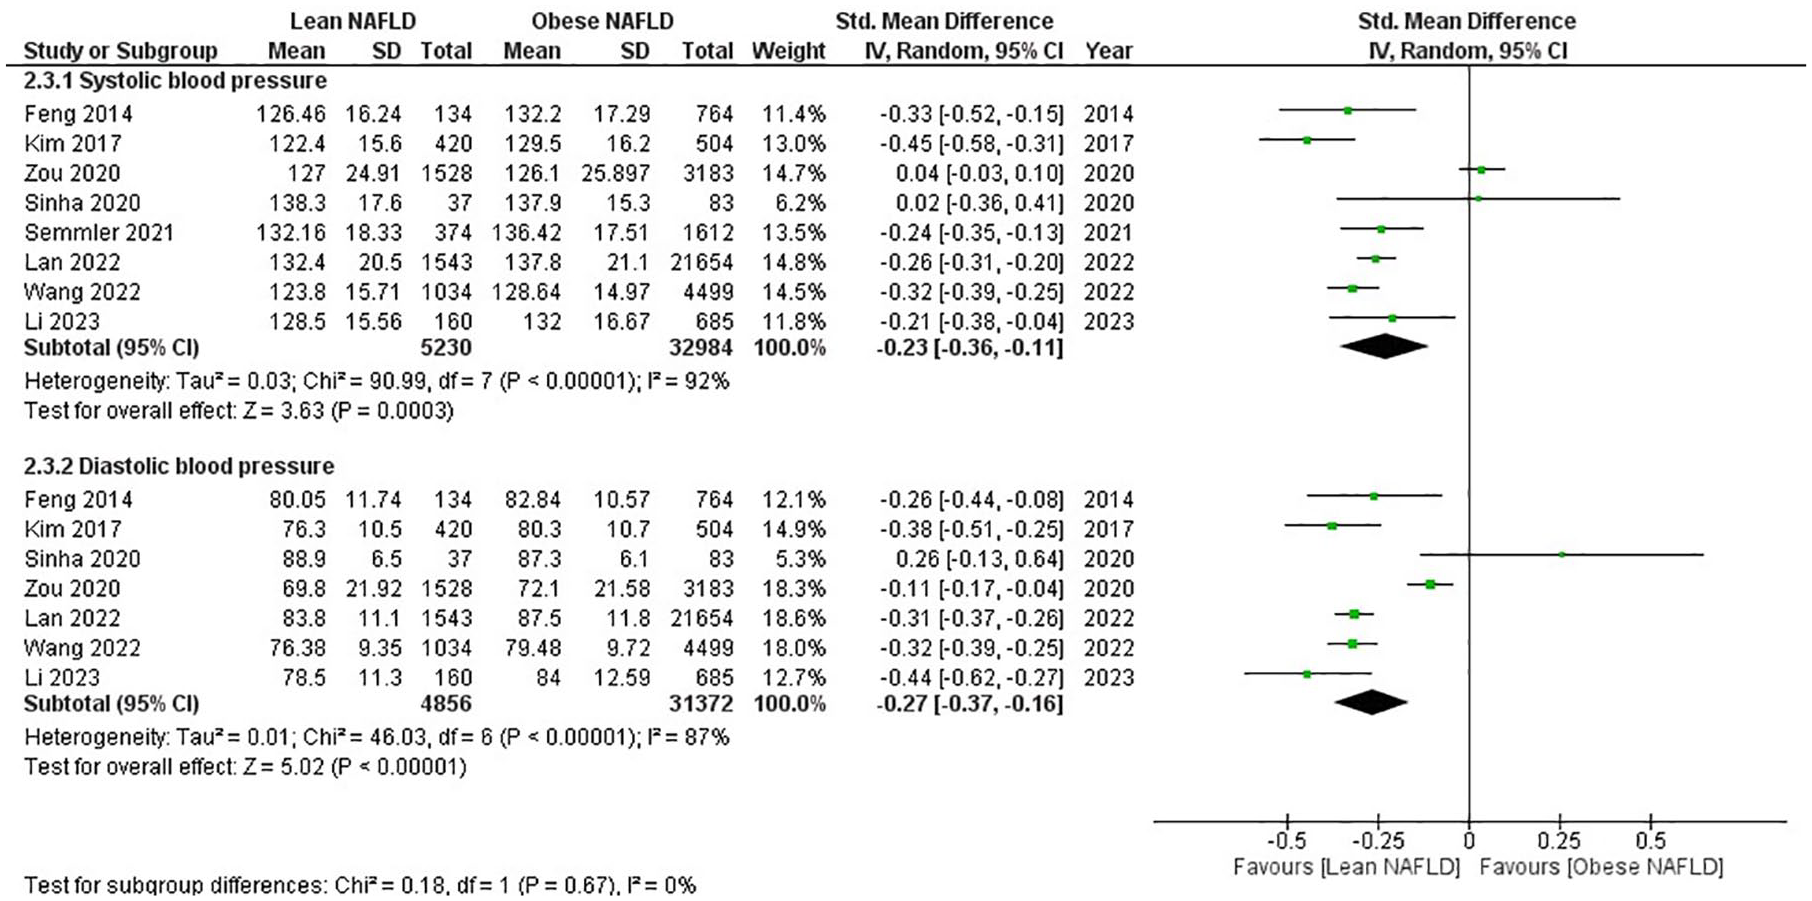
Forest plot for lean NAFLD versus obese NAFLD for BP: (2.3.1) Systolic BP; (2.3.2) Diastolic BP.
Anthropometric measures
Anthropometric measures were significantly different between the two groups. LN individuals had substantially lower WCs (SMD −1.39, 95% CI −1.49 to −1.28, p < 0.00001) than those with ON. Heterogeneity was high in all outcomes for which sensitivity analysis was performed. This suggests that individuals with LN may have less abdominal adiposity than individuals with ON (Figure 7).
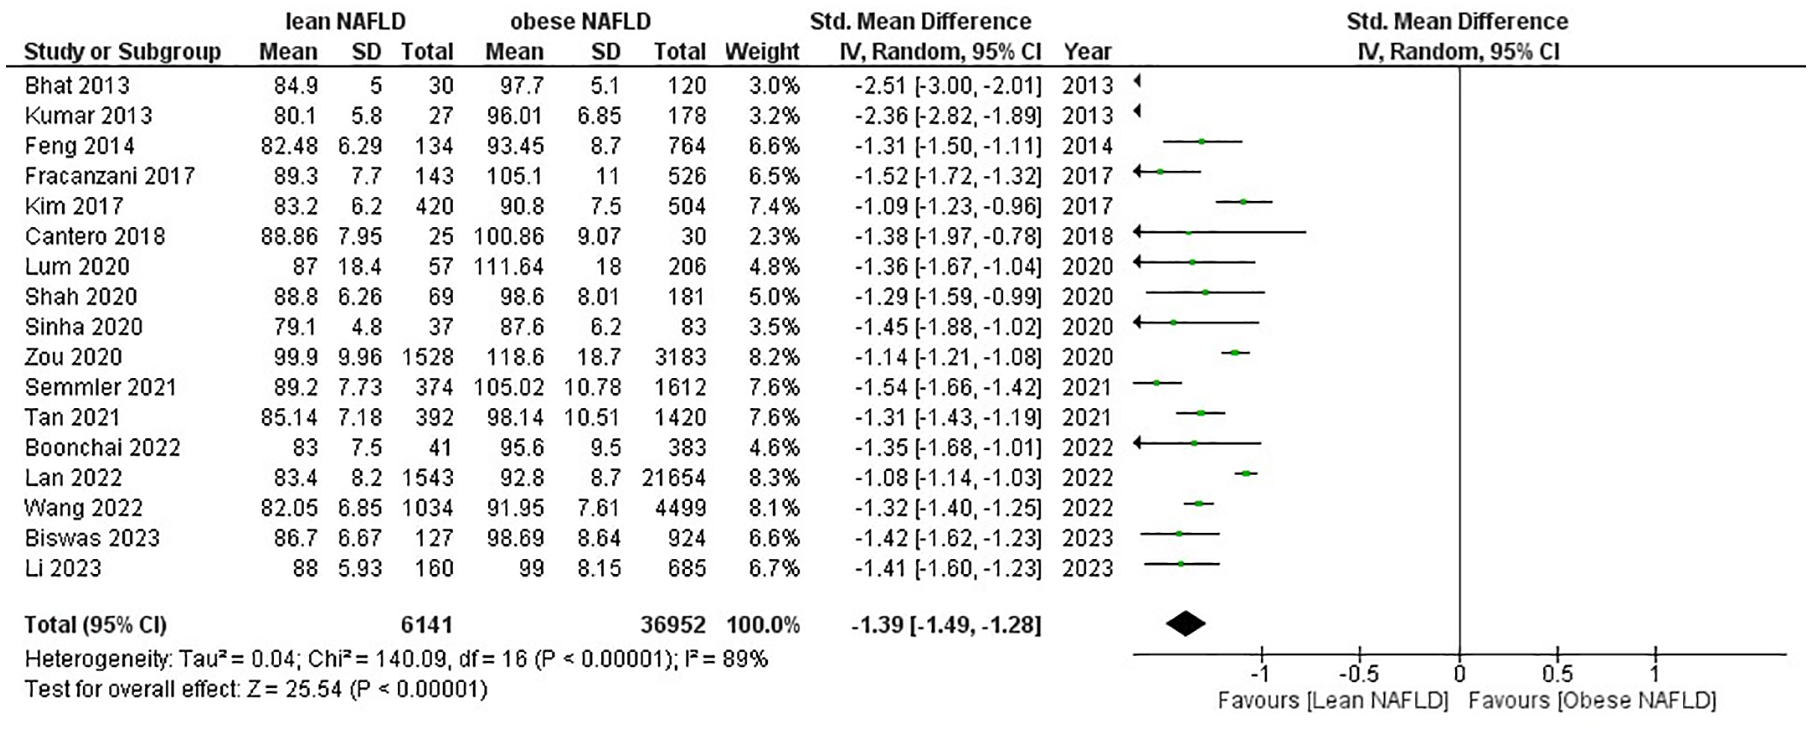
Forest plot for lean NAFLD versus obese NAFLD for waist circumference.
Fasting blood sugar
FBS levels were slightly lower in individuals with LN than those with ON, although this difference was not statistically significant (SMD −0.05, 95% CI −0.12–0.02, p = 0.18) (Figure 8).

Forest plot for lean NAFLD versus obese NAFLD for fasting blood sugar.
Sensitivity analysis
Sensitivity analysis further strengthened the initial findings by reducing heterogeneity in all outcomes. The results remained consistent and robust, confirming the lower risk of DM (RR 0.80, 95% CI 0.74–0.86, p < 0.00001), dyslipidemia (RR 0.86, 95% CI 0.82–0.91, p < 0.00001), HTN (RR 0.86, 95% CI 0.81–0.92, p < 0.00001), and MS (RR 0.36, 95% CI 0.30–0.42, p < 0.00001) in LN individuals compared to ON individuals. The sensitivity analysis also reiterated the more favorable lipid profiles and anthropometric measures in the LN group, with higher HDL levels (SMD 0.27, 95% CI 0.18–0.35, p < 0.00001) and lower triglycerides (SMD −0.19, 95% CI −0.26 to −0.12, p < 0.00001), LDL (SMD −0.13, 95% CI −0.19 to −0.06, p < 0.0001), and WC (SMD −1.33, 95% CI −1.40–1.26, p < 0.00001). The systolic (SMD −0.29, 95% CI −0.35 to −0.23, p < 0.00001) and diastolic (SMD −0.33, 95% CI −0.36 to −0.29, p < 0.00001) BP and FBS (SMD −0.06, 95% CI −0.13–0.02, p = 0.13) remained almost similar as well (Supplemental Figures S1–S5).
Publication bias
The presence of publication bias for prevalence, DM, HTN, dyslipidemia, MS, lipid profiles, WC, systolic and diastolic BPs, and FBS was assessed using a funnel plot, revealing an asymmetric distribution on visualization and suggesting evidence of publication bias (Supplemental Figures S6–S16).
Discussion
Lean NAFLD represents a unique subtype of NAFLD, distinguishing itself from conventional NAFLD primarily seen in overweight or obese individuals or those with features resembling MS. This study seeks to provide a comprehensive global overview of NAFLD prevalence in lean individuals and explores the extent of associated metabolic dysfunction. Unlike prior research, this analysis stands out by its specific emphasis on investigating the correlation between different ethnic groups and the occurrence of NAFLD in lean people. It is worth noting that while LN constitutes a small percentage of the population in Western regions, it comprises a significant one-third of all NAFLD cases in the Eastern regions, where roughly 14% of the overall population is impacted by this condition. 1
In our analysis, the prevalence of NAFLD varies among lean and non-lean populations in different regions. In already diagnosed NAFLD cases, Asian populations show a higher prevalence among non-lean individuals (88%), while in Europe and North America, NAFLD is more evenly distributed between lean and non-lean individuals. In the general population, the prevalence of NAFLD is generally higher among non-lean individuals, with the highest rates in Europe, followed by Asia and the lowest in North America. These findings underscore the importance of understanding regional and population-specific factors in NAFLD prevalence, with lifestyle, diet, and healthcare access playing significant roles. However, when examining the results by region, significant variations emerge. The criteria for classifying someone as obese or lean may differ across populations. It is crucial to consider that this outcome may be partly due to chance, as the American population had a much larger sample size than the others, and the healthcare facilities among the Asian population might not be state-of-the-art and accessible to all. Therefore, it is reasonable to assume that a significant portion of the population may have NAFLD but remains undiagnosed.34–37
The current analysis revealed that lean individuals with NAFLD have a notably lower metabolic burden compared to overweight and obese individuals. While metabolic dysregulation plays a decisive role in the development of NAFLD, it represents just one facet of the complex picture. Our findings indicate that metabolic dysfunction in NAFLD is influenced by body weight, with conditions such as DM, HTN, and dyslipidemia exhibiting a more pronounced impact on individuals with ON than those with a leaner form of the disease. Furthermore, our data show that fasting blood glucose levels are generally lower in lean people with NAFLD than in their overweight or obese counterparts. Additionally, in our analysis, lean individuals diagnosed with NAFLD typically exhibit lower BP levels in contrast to ON, and it is noteworthy that BMI serves as a substantial indicator for predicting the presence of HTN. 38 Recent research has pinpointed specific genetic factors, notably PNPLA3 and TM6SF2, as pivotal contributors to the evolution and course of NAFLD. These genetic elements are instrumental in understanding the close associations between NAFLD, MS, DM, and cardiovascular diseases. 39 Moreover, IR plays a critical role in this intricate web. It enhances the production of lipids in the liver while impeding the body’s ability to control the breakdown of fats stored in adipose tissue. This dual effect results in the disproportionate deposit of fat in the liver, a hallmark of NAFLD. In essence, these genetic and metabolic factors intersect to shape the pathophysiology of NAFLD and its intricate relationships with MS, DM, and cardiovascular diseases, providing crucial insights into these interconnected health issues.39,40
According to a study conducted in Hong Kong, two primary factors were significantly associated with LN: modifications in waist size and the concentration of triglycerides in the blood. 41 In our analysis, in comparison to the LN group, the ON group displayed significantly more pronounced deviations in lipid profile components. Lipid profile abnormalities are integral to MS, with NAFLD being closely associated. Factors contributing to these abnormalities include sedentary lifestyles, genetic polymorphisms, de novo synthesis of triglycerides and free fatty acids, and dietary habits. Notably, lean individuals with NAFLD often exhibit better lipid profiles than their obese counterparts. This is primarily due to differences in fat distribution, insulin sensitivity, and their collective influence on lipid metabolism. LN is characterized by a more liver-centric fat distribution, resulting in less systemic adiposity and fewer harmful fatty acids released into the bloodstream. Additionally, lean individuals typically have better insulin sensitivity, further aiding in maintaining a healthier lipid profile and, hence, a more favorable metabolic profile.33,42,43
The average WC for LN was 85.9 ± 7.1 cm. Our analysis reveals that the non-lean population tends to have a higher WC. The WC of the lean population falls close to the international guidelines’ borderline values (95 cm for men and 80 cm for women). While having an apple-shaped body characterized by a high WC is considered a risk factor for DM in individuals with normal BMI, there is limited evidence linking this to NAFLD in lean individuals, as their WC is near the borderline range. It is important to note that there is no universal WC threshold worldwide, and these parameters can differ among various races and ethnicities. Notably, lean individuals who are diagnosed with NAFLD and have higher WCs (exceeding 102 and 88 cm in men and women, respectively) exhibit a greater risk of developing DM, carotid plaque, and fibrosis when compared to individuals without NAFLD.16,44 The intensity of LN is positively linked to accumulation of fat in the viscera, and it is suggested that visceral adiposity, rather than total fat, may contribute to the risk of LN.42,43 Consequently, measuring WC provides an additional means to assess metabolic risks associated with BMI.
Numerous studies have consistently found that lean individuals diagnosed with NAFLD experience a lesser incidence of DM, HTN, hypertriglyceridemia, obesity, and MS.15,16,45 However, in the advanced stages of the disease, LN patients tend to exhibit increase in fibrosis scores, cardiovascular morbidity, and all-cause mortality rates compared to their non-lean counterparts with NAFLD.9,29,46 Additionally, when using magnetic resonance elastography to assess fibrosis in NAFLD, the lean group displayed a reduced occurrence of substantial fibrosis but a heightened incidence of severe fibrosis. 47 Recent studies have predominantly focused on evaluating LN based on genetics and ethnicity. However, the available evidence on this topic remains limited.
Limitation
This analysis represents the most extensive investigation of the prevalence of NAFLD in lean individuals, along with its associated metabolic dysregulation. However, it is essential to acknowledge certain limitations in our study. Liver biopsy is the established benchmark for making a diagnosis of fatty liver; it is crucial to acknowledge that a selection bias could influence the outcomes of the sensitivity analysis. This bias arises from the fact that patients who opt for biopsies are more inclined to have a more advanced or severe form of the disease. Moreover, the literature could greatly benefit from examining the outlook or prognosis disparities between individuals with lean and non-lean NAFLD. However, our study’s scope is limited due to the absence of reported mortality outcomes in lean and ON from existing studies. In future research, investigating these mortality outcomes could provide valuable insights into the overall impact of NAFLD in both lean and obese individuals. Another limitation of our study is the unavailability of gender-based data. Anthropometric measures such as BMI, weight, and WC can significantly differ between genders. Additionally, genetics and ethnicity also contribute to variations in these anthropometric measures. Therefore, the lack of gender-specific data might hinder a comprehensive understanding of the impact of these factors on our study results.
Conclusion
This study delves into the unique subtype of NAFLD known as LN, differentiating it from the typical form associated with overweight or obese individuals. Notably, LN’s prevalence varies between Western and Eastern regions. While Western populations see it as a small fraction, it constitutes one-third of all NAFLD cases in the East. The prevalence of NAFLD among lean and non-lean individuals varies by region. Lean people with NAFLD generally experience lower metabolic burdens than their overweight and obese counterparts. This metabolic distinction is influenced by factors like body weight, genetics (e.g. PNPLA3 and TM6SF2), and IR. Lean NAFLD is characterized by a liver-centric fat distribution, resulting in more favorable lipid profiles and metabolic outcomes. While lean individuals with NAFLD experience fewer metabolic abnormalities initially, they may face higher fibrosis scores and increased cardiovascular risks in advanced stages. The connection between genetics, metabolism, and NAFLD provides crucial insights into the condition’s complex relationships with MS, DM, and cardiovascular diseases. Further research is needed to enhance our understanding and management of this unique condition.
Supplemental Material
sj-docx-1-tae-10.1177_20420188241274310 – Supplemental material for Analyzing and evaluating the prevalence and metabolic profile of lean NAFLD compared to obese NAFLD: a systemic review and meta-analysis
Supplemental material, sj-docx-1-tae-10.1177_20420188241274310 for Analyzing and evaluating the prevalence and metabolic profile of lean NAFLD compared to obese NAFLD: a systemic review and meta-analysis by Hareer Fatima, Hussain Sohail Rangwala, Muhammad Saqlain Mustafa, Muhammad Ashir Shafique, Syed Raza Abbas and Burhanuddin Sohail Rangwala in Therapeutic Advances in Endocrinology and Metabolism
Supplemental Material
sj-docx-2-tae-10.1177_20420188241274310 – Supplemental material for Analyzing and evaluating the prevalence and metabolic profile of lean NAFLD compared to obese NAFLD: a systemic review and meta-analysis
Supplemental material, sj-docx-2-tae-10.1177_20420188241274310 for Analyzing and evaluating the prevalence and metabolic profile of lean NAFLD compared to obese NAFLD: a systemic review and meta-analysis by Hareer Fatima, Hussain Sohail Rangwala, Muhammad Saqlain Mustafa, Muhammad Ashir Shafique, Syed Raza Abbas and Burhanuddin Sohail Rangwala in Therapeutic Advances in Endocrinology and Metabolism
Footnotes
References
Supplementary Material
Please find the following supplemental material available below.
For Open Access articles published under a Creative Commons License, all supplemental material carries the same license as the article it is associated with.
For non-Open Access articles published, all supplemental material carries a non-exclusive license, and permission requests for re-use of supplemental material or any part of supplemental material shall be sent directly to the copyright owner as specified in the copyright notice associated with the article.