
Abstract
Background:
Diabetic kidney disease (DKD) is characterized by reduced estimated glomerular filtration rate (eGFR) and albuminuria, which play a pivotal role in both diagnosing and determining the disease’s progression. This study aimed to assess the trajectory of these markers concerning age in individuals with DKD and identify predictive factors for the decline in eGFR decline, variation in albuminuria, mortality, and progression to renal replacement therapy (RRT).
Design:
This retrospective cohort encompassed patients with type 2 diabetes (T2D), divided into two age categories: <75 and ⩾75 years old.
Methods:
Over a 3-year span, the study evaluated eGFR (CKD-EPI) and 24-h albuminuria. Univariate and multivariate analyses were employed to pinpoint factors associated with deteriorating renal function and mortality. Significance was set at p < 0.05, and Kaplan–Meier survival curves were constructed to illustrate renal and overall survival.
Results:
The analysis comprised 304 patients. Comparable eGFR declines were evident in both age groups during the transition from the first to the second year and from the second to the third year. Nonetheless, a more pronounced rise in albuminuria was evident in the ⩾75 years group during the first to the second year. Multivariate analysis unveiled that systolic blood pressure (SBP) measurements in the first year positively forecasted eGFR decline. Age was associated with heightened albuminuria and mortality, while hospitalizations linked to cardiovascular causes robustly predicted mortality. Hospitalizations due to sepsis and cardiovascular reasons, coupled with first-year SBP measurements, served as predictive indicators for progression to RRT.
Conclusion:
Both age groups experienced similar declines in eGFR, though the ⩾75 years group displayed a more significant increase in albuminuria during the first to the second year. Age, hospitalizations, and higher blood pressure levels were correlated with exacerbated renal function deterioration and/or elevated mortality in DKD. Timely intervention and tailored management strategies stand as critical components for enhancing outcomes among DKD patients.
Plain language summary
Diabetic kidney disease (DKD) is characterized by a reduced estimated glomerular filtration rate (eGFR) and albuminuria. This study aims to evaluate the follow-up of these renal markers in relation to age among individuals with DKD and identify factors predisposing to eGFR loss, increased albuminuria, mortality, and the need for dialysis. We conducted an observational and retrospective study in Brazil, including patients with type 2 diabetes, divided into two age groups: < 75 and ⩾ 75 years. The patients were followed for three years, and a total of 304 patients were evaluated.
We observed a similar decline in eGFR in both age groups from the 1st to the 2nd year and from the 2nd to the 3rd year. However, worsening of albuminuria was more frequent in the ⩾ 75 years old group from the 1st to the 2nd year. Elevated blood pressure levels were associated with eGFR decline. Age was associated with increased albuminuria and mortality. Hospitalizations for cardiovascular causes strongly predicted mortality. Hospitalizations for sepsis and cardiovascular causes, along with higher blood pressure levels, were associated with the need for dialysis. Hence, establish approaches to enhance the health in individuals with DKD is of paramount importance.
Introduction
The global prevalence of diabetes mellitus (DM) has risen significantly, with estimates indicating that 537 million people were living with diabetes in 2021, projected to increase to 784 million by 2045. 1 DM substantially increases the risk of ischemic heart disease and stroke, 2 ranked as the first and second leading causes of global disease burden. 3 Diabetic kidney disease (DKD) affects approximately 40% of people with type 2 DM (T2D) and stands as the foremost cause of chronic kidney disease (CKD). 4 The primary modifiable risk factors for DKD are hypertension, glycemic control, and dyslipidemia. 5
The global elderly population is witnessing a substantial surge, projected to double from 12% to 22% between 2015 and 2050, according to the World Health Organization (WHO). 6 This increase is driven by a decline in fertility with fewer births and an increase in average life expectancy, leading to a rise in the average age of the world’s population. 7 Experts estimate that in the United Kingdom, for example, girls born in 2020 will live to be at least 90.2 years old, and boys 87.3 years old. 8
The elderly population experiences a high prevalence of CKD. 9 The aging process leads to a reduction in estimated glomerular filtration rate (eGFR), a normal biological phenomenon associated with cellular and organ senescence. The changes in the kidney’s volume, reduced nephron count, vasoactive response, and activity of the renin-angiotensin-aldosterone system, combined with cellular oxidative stress, contribute to this decline. 10 The eGFR decreases by approximately 8 mL/min per decade, starting in the fourth decade of life. 11 Therefore, CKD is estimated to affect almost 40% of people aged 65 or older, 12 and approximately half of the population over 70 years of age have an eGFR <60 mL/min/1.73 m2. 13 These higher rates are mainly attributed to the increased prevalence of traditional CKD risk factors, such as DM, in these populations. 14
Data from the Third National Health and Nutrition Examination Survey data in the United States show that the prevalence of CKD in the population over 60 years of age was 39.4%, compared to 12.6% and 8.5% for people aged 40–59 years and 20–39 years, respectively. 15 Similarly, the prevalence of CKD among women in the general Chinese population increases from 7.4% among ages 18–39 years to 18.0% and 24.2% among ages 60–69 and 70 years and older, respectively. 16 In Canada, more than half of patients starting dialysis are aged 65 or older. 17
Despite this higher prevalence of CKD and DM in the elderly, many trials of CKD therapies have excluded older patients. 18 Given the limited data comparing different age groups concerning the evolution of renal markers in DKD, our study aimed to evaluate the progression of eGFR and albuminuria according to age, stratifying patients into two groups: <75 years and ⩾75 years. Moreover, we analyzed renal and patient survival curves based on age and identified variables associated with eGFR decline, worsening albuminuria, mortality, and progression to renal replacement therapy (RRT).
This research seeks to contribute valuable insights into DKD progression among distinct age groups, shedding light on potential disparities and informing better management for DKD.
Patients and methods
Study design and setting
This retrospective cohort study was conducted at the nephrology outpatient clinic of Hospital Regional Hans Dieter Schmidt, a state public hospital in Santa Catarina, Brazil. The study was approved by the Ethics and Research Committee of the Universidade Federal de São Paulo (CAEE 55035222.9.0000.5505) in accordance with the Declaration of Helsinki, and the requirement for informed consent was waived due to the study’s retrospective nature. The study adheres to STROBE guidelines. 19
The study population included adults and elderly individuals with DKD and T2D. T2D was defined as an HbA1c level of ⩾6.5% or fasting blood glucose level of ⩾ 126 mg/dL on two separate occasions. We specifically chose patients undergoing drug treatment with hypoglycemic agents and/or insulin therapy, excluding those with suspected or confirmed type 1 diabetes mellitus (T1D). To be included, patients must have had at least two serum creatinine values (collected at least 3 months apart) associated with quantification of albuminuria in two 24-h measurements (also collected at least 3 months apart) or a record of 24-h albuminuria plus 24-h proteinuria accompanied by urinalysis with proteinuria, all within a minimum 3-month interval.
Exclusion criteria consisted of patients under 18 years of age, those with solid organ transplants, unilateral nephrectomy, autosomal dominant polycystic kidney disease, history of cancer or active cancer, suspected or confirmed T1D, urinary tract obstruction/hydronephrosis, positive serology for HIV, hepatitis B, or hepatitis C, cirrhosis, atypical cases of diabetic kidney disease without renal biopsy, and more than 20% missing data in medical records.
Data from the electronic medical records of patients treated at the outpatient clinic under the Unified Health System [Sistema Único de Saúde (SUS)] in Brazil were collected from 1 January 2010, to 31 December 2016. Each patient’s data were assessed for a period of 3 years, therefore at the maximum up to 31 December 2019. Patients using sodium-glucose cotransporter 2 (SGLT2) inhibitors were not included, as these medications were not yet available in the SUS during this period.
We chose not to study the last years due to the COVID-19 pandemic, period during which the outpatient clinic remained closed for a few months, and there was less access to outpatient examinations.
The study population was stratified into two age groups: <75 years and ⩾75 years, considering the high prevalence of individuals aged over 60 years in the outpatient clinic and the WHO classification of age groups (45–59 years classified as middle aged, 60–74 years as elderly, 75–89 years as old, and 90 years and over as very old). 20
Demographic, clinical, and laboratory variables
Demographic, clinical, and laboratory variables were collected from the first year of follow-up, including age, gender, race, duration of DM, presence of diabetic neuropathy, history of stroke/transient ischemic attack (TIA), coronary artery disease, amputation, peripheral vascular disease, uric acid levels, body mass index (BMI), total cholesterol, triglycerides, triglycerides/high-density lipoprotein (HDL) ratio, HDL, low-density lipoprotein (LDL), glycated hemoglobin (HbA1c), smoking, average blood pressure values in consultations, use of statins, fibrates, angiotensin-converting enzyme (ACE) inhibitors, angiotensin-receptor blockers (ARBs), acetylsalicylic acid (ASA), clopidogrel, oral hypoglycemic agents, and insulin.
Average blood pressure values in consultations during the first year of follow-up were also evaluated. Over 3 years, annual averages of glycated hemoglobin (HbA1c), fasting blood glucose (FBG), eGFR, and albuminuria, as well as diabetic retinopathy, hospitalizations, mortality, and progression to RRT rates were analyzed. eGFR was calculated based on serum creatinine using the formula defined by CKD-EPI (Chronic Kidney Disease Epidemiology Collaboration) study and was expressed in mL/min/1.73 m2 of the body surface, regardless of race.
Statistical analyses
Our primary objective was to evaluate the evolution of eGFR and albuminuria according to age in individuals with DKD. Statistical analyses were performed using the Mann–Whitney U test for continuous variables and the chi-square or Fisher’s exact test for categorical variables.
Our secondary objectives were to analyze renal and patient survival curves by age group and to determine the positive predictors of decreasing eGFR, worsening of albuminuria, mortality, and progression to RRT. The results referring to the negative predictors were not discussed in this work. Kaplan–Meier method was used to estimate renal and patient survival probabilities. Univariate logistic regression analysis assessed predictors of eGFR decline, increase in albuminuria, mortality, and progression to RRT. Predictors with p-values less than 0.10 entered the multivariate logistic regression models.
A minimum sample size of 260 patients was estimated based on a 47.1% prevalence of albuminuria in individuals with T2D. 21
Odds ratios (ORs) with a 95% confidence interval (CI) were reported. Data were presented as mean ± standard deviation (SD) or median and interquartile range (IQR) for continuous variables, as appropriate, and frequencies and percentages for qualitative data. Statistical analysis was conducted using IBM SPSS (Statistical Product and Services Solutions, version 21.0, Chicago, IL, USA) with a p-value < 0.05 considered significant for all data analyses.
Results
From 1 January 2010 to 31 December 2016, a total of 3108 patients were seen at the nephrology outpatient clinic. Among them, 304 patients with DKD were eligible for the study, with 253 (83.2%) in the <75 years group [61 (57.0; 66.5)] and 51 (16.8%) in the ⩾ 75 years group [77 (76.0; 81.0); Figure 1].
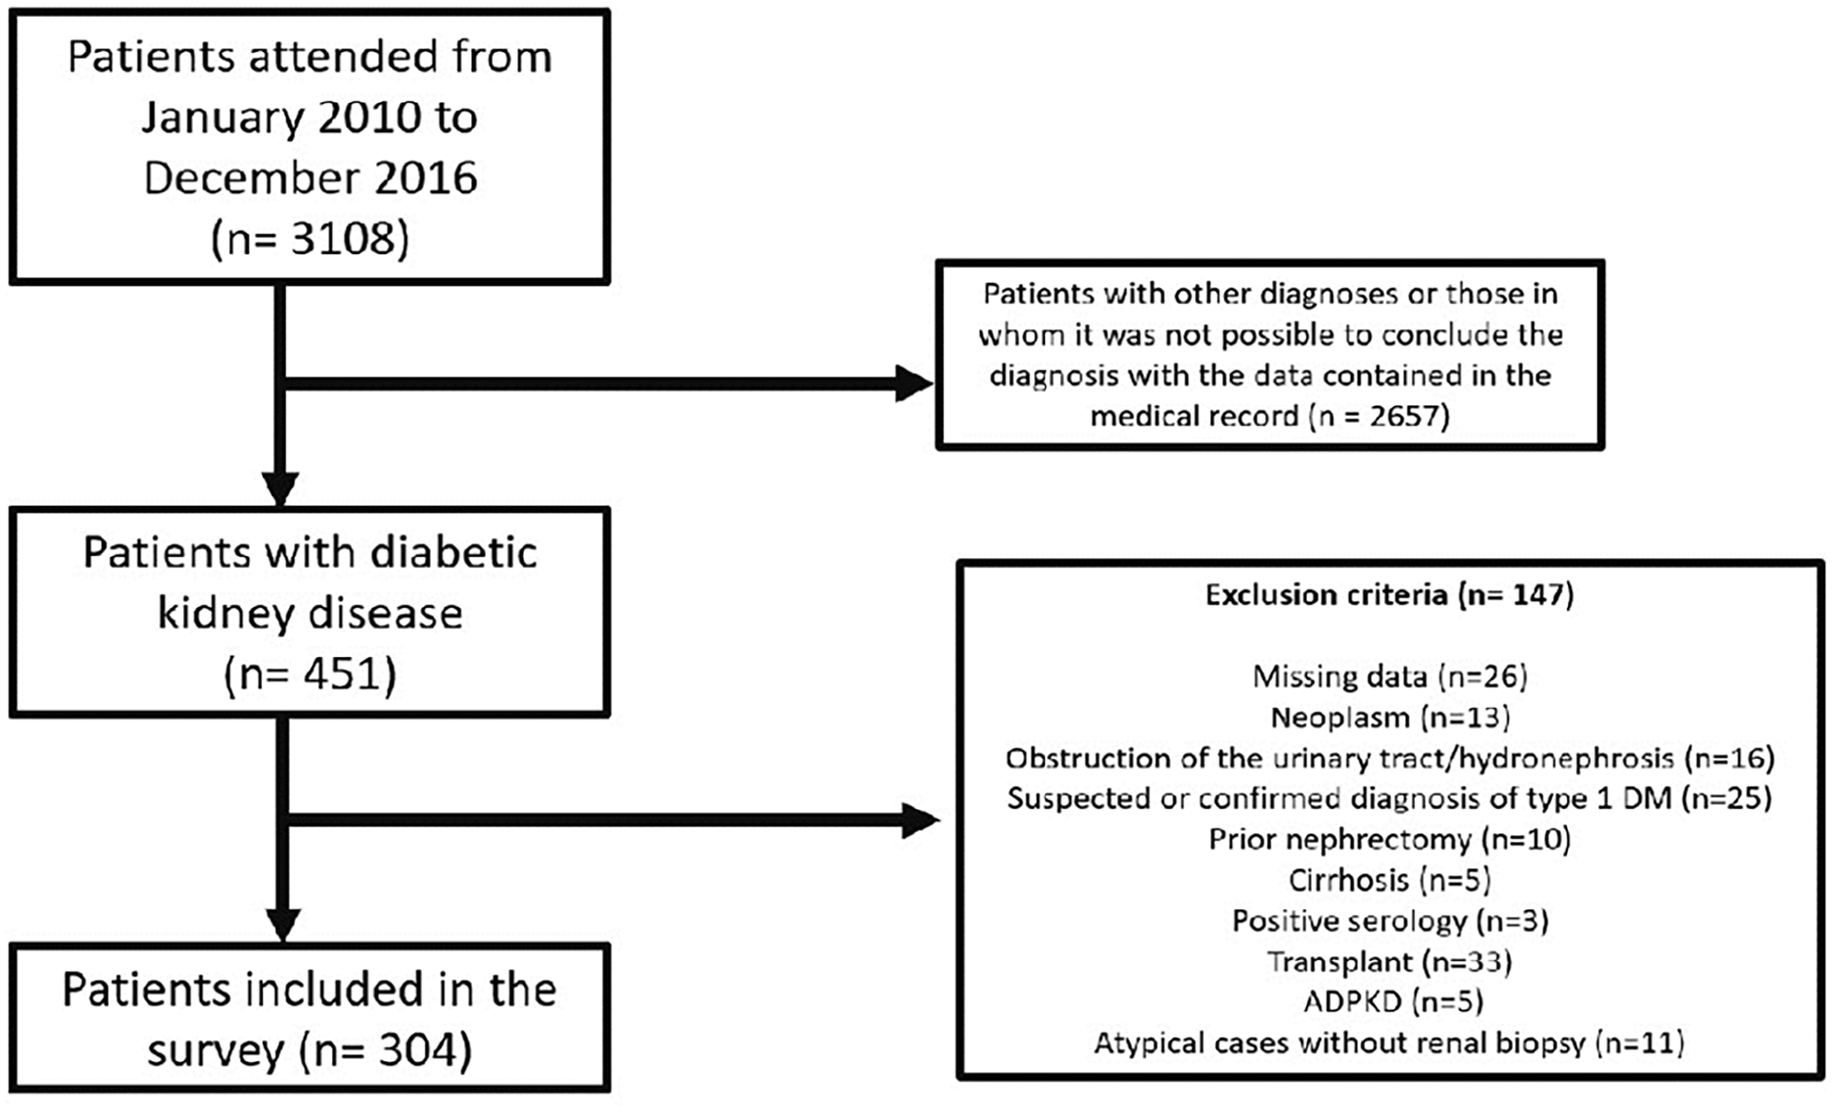
Flowchart referring to inclusion and exclusion criteria of patients in the research.
The study had a higher prevalence of male individuals (55.3%) and white race (95.7%), with no significant difference in these variables between the two age groups (Supplemental Table S1).
Regarding clinical variables, the <75 years group had a higher prevalence of diabetic retinopathy (82.2% versus 46.2%, p < 0.001) and higher levels of diastolic blood pressure [80 (77; 90) versus 80 (70; 80) mmHg, p = 0.013] and BMI [32.6 (30.1; 34.9) versus 29.3 (27.1; 32.8) kg/m2, p < 0.001; Table 1].
Comparison of clinical and epidemiological characteristics between groups.

All described variables pertain to the first year of follow-up, except for diabetic retinopathy, hospitalizations within 3 years, hospitalizations due to sepsis or septic shock, and hospitalizations for cardiovascular causes, which refer to the 3-year follow-up period. All quantitative variables were described as median and IQR, except the variable hospitalizations in 3 years, which was presented as mean ± SD.
BMI, body mass index; DBP, diastolic blood pressure; PVD, peripheral vascular disease; SBP, systolic blood pressure; TIA, transient ischemic attack.
In terms of laboratory tests, the <75 years group had higher levels of total cholesterol [184 (161; 216) versus 163 (151; 199) mg/dL, p = 0.025], LDL [102.4 (80.7; 128.6) versus 94 (72; 114), p = 0.037] compared to the ⩾75 years group (Table 2). The ⩾75 years group had higher uric acid levels [7.3 (6.2; 8.2) versus 6.6 (5.5; 7.7) mg/dL, p = 0.027].
Comparison of baseline laboratory parameters between groups.

All variables described refer to the first year of follow-up and were described as median and IQR.
HDL, high-density lipoprotein; LDL, low-density lipoprotein.
In terms of HbA1c, the group aged <75 years exhibited statistically higher levels in all years compared to the group aged ⩾75 years (Table 3). However, this trend was not observed in relation to FBG (Table 4).
Comparison of HbA1c between groups.
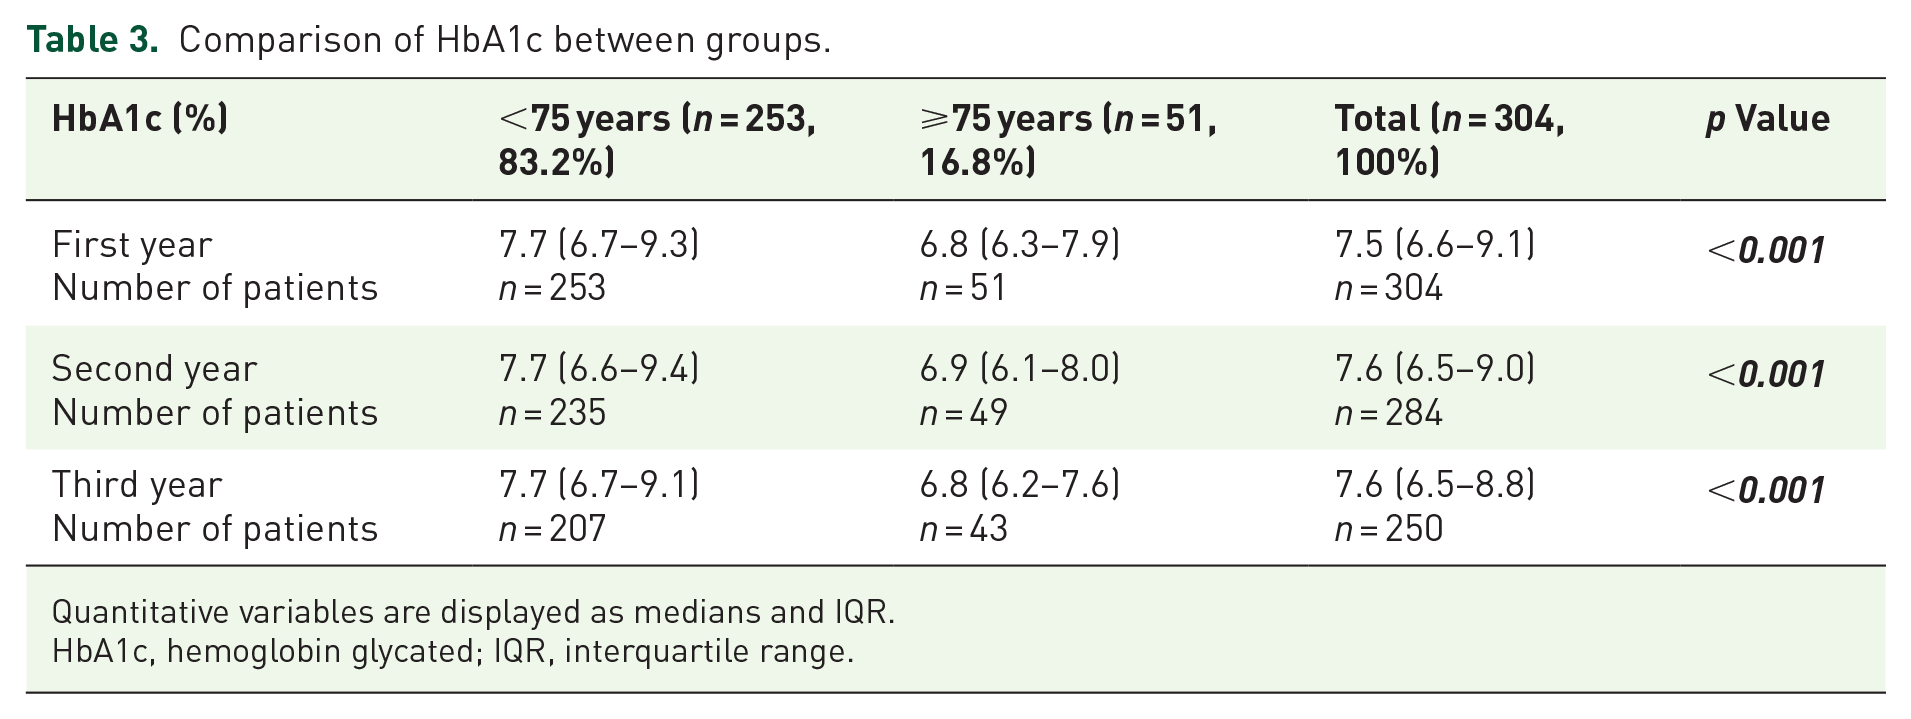
Quantitative variables are displayed as medians and IQR.
HbA1c, hemoglobin glycated; IQR, interquartile range.
Comparison of FBG between groups.
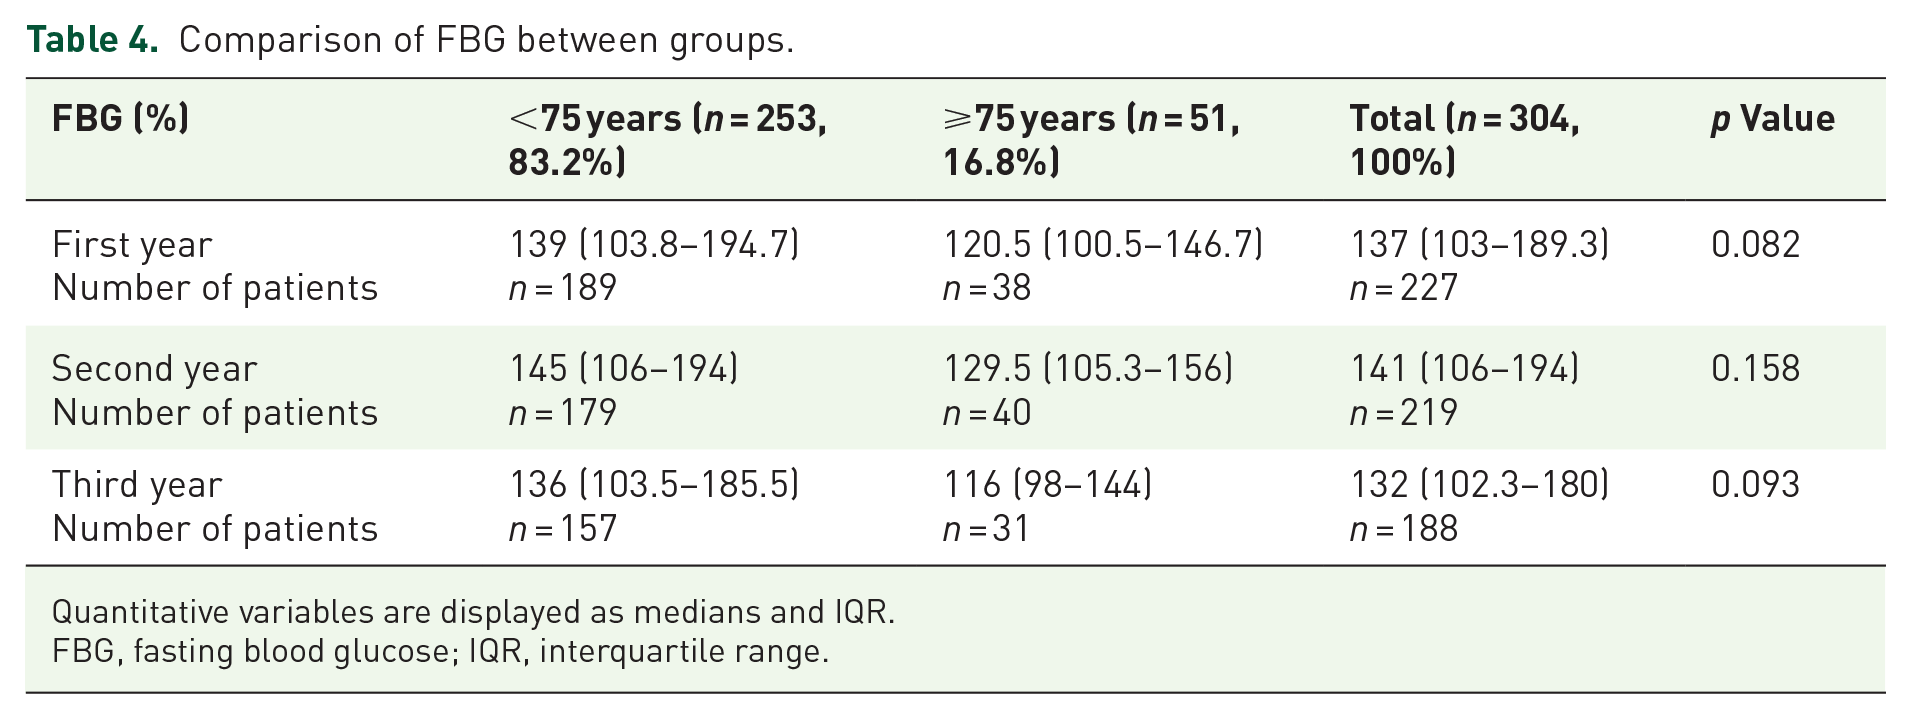
Quantitative variables are displayed as medians and IQR.
FBG, fasting blood glucose; IQR, interquartile range.
Medication usage did not significantly differ between the two age groups (Supplemental Table S2), with 45.4% of patients using ACE inhibitors, 43.9% using ARBs, and 62.5% using insulin (Supplemental Figure S1).
The median serum creatinine levels were significantly lower in the <75 years group compared to the ⩾75 years group during the first and second year [in the first year: 1.4 (1.1; 2.0) versus 1.7(1.4; 2.0) mg/dL, p = 0.011 and in the second year: 1.7 (1.2;2.5) versus 2.0 (1.5;2.6) mg/dL, p = 0.025; Figure 2(a) and (b)].

Comparison of creatinine levels (mg/dL) over a 3-year period between individuals aged <75 years and ⩾75 years with diabetic kidney disease. (a) Annual median creatinine levels, demonstrating a significant difference between the groups in the first year (p = 0.011) and second year (p = 0.025), but not in the third year. (b) Progression of median annual creatinine levels.
The median eGFR in mL/min/1.73 m2 differed significantly between the <75 years and ⩾75 years groups throughout the 3-year period, wherein individuals aged ⩾75 years demonstrated more advanced CKD categories [Figures 3(a) and (b); Table 5].
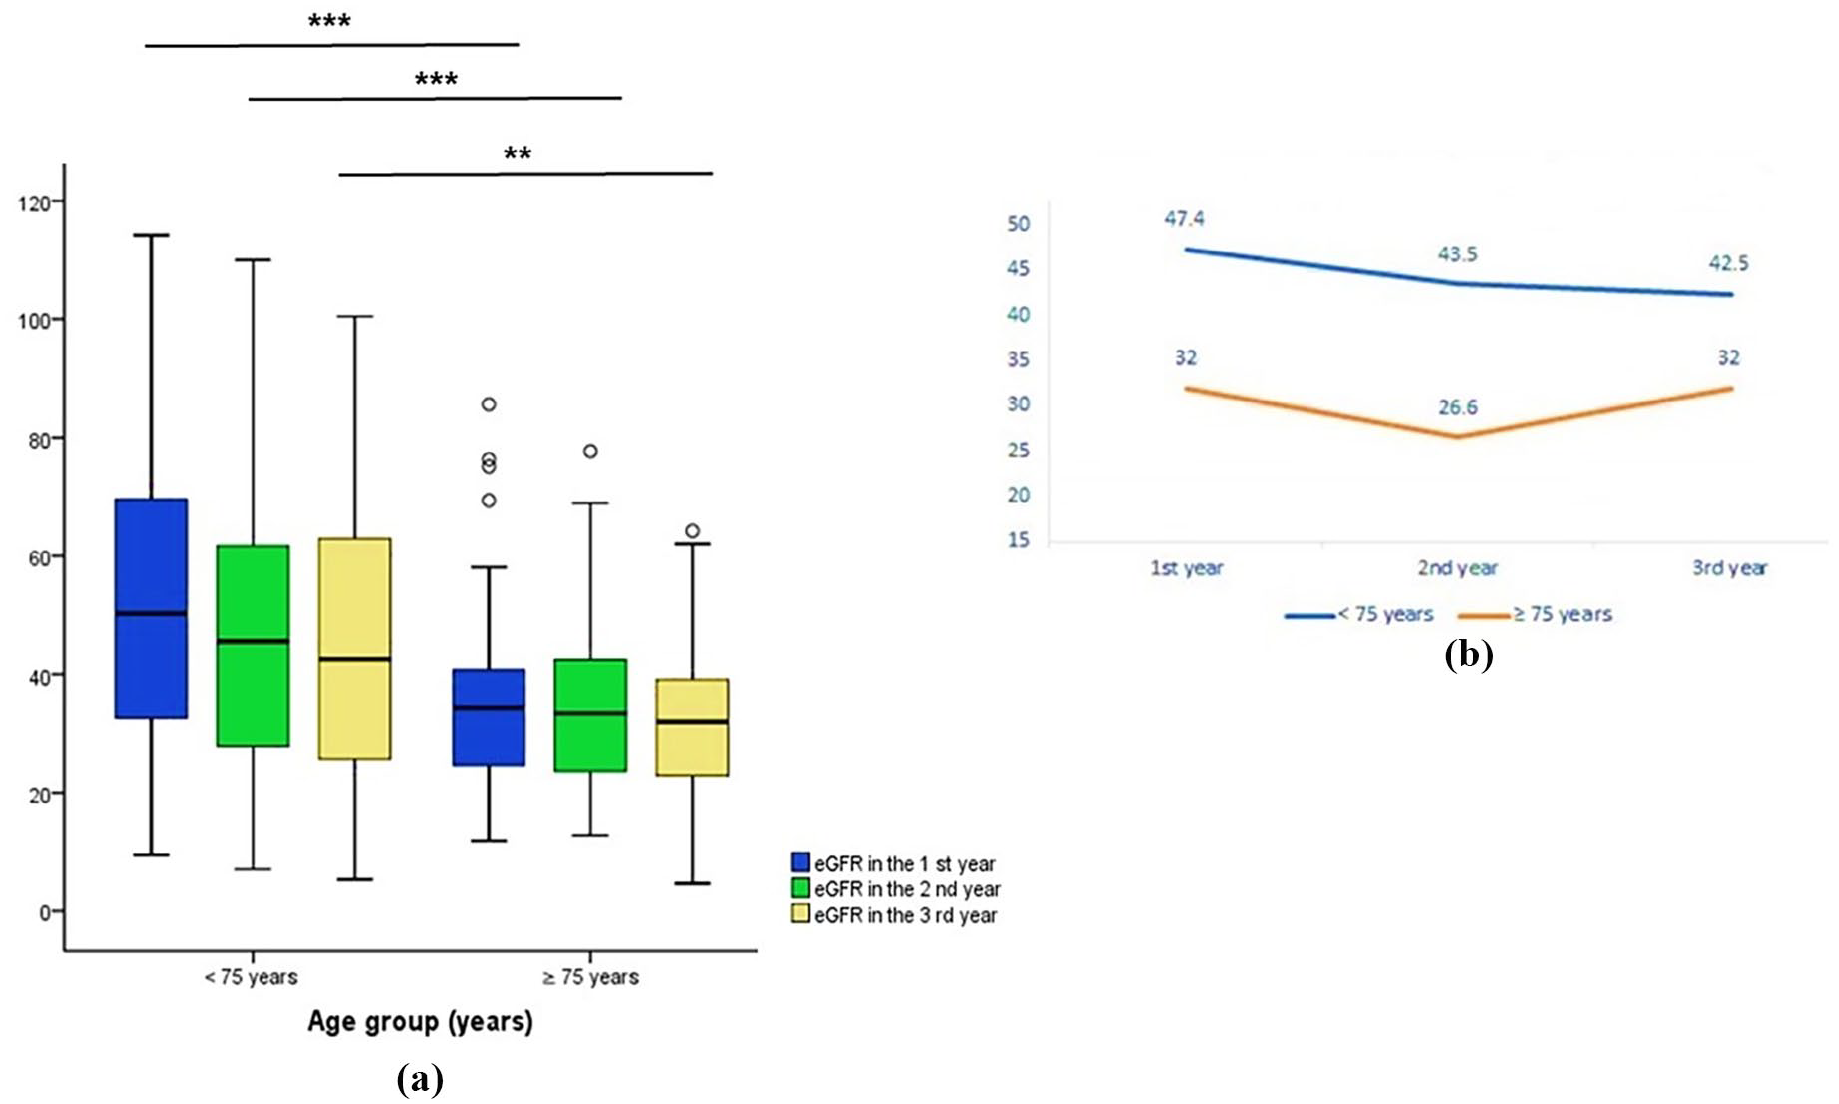
Comparison of eGFR (estimated glomerular filtration rate, in mL/min/1.73 m2) over a 3-year period between individuals aged <75 years and ⩾75 years with diabetic kidney disease. (a) Annual median eGFR levels, indicating lower levels in individuals aged ⩾75 years in the first year (p < 0.001), second year (p < 0.001), and third year (p = 0.004). (b) Progression of median annual eGFR values.
eGFR by age group throughout the annual follow-up.

Quantitative variables are displayed as medians and IQR.
eGFR, estimated glomerular filtration rate; IQR, interquartile range.
The eGFR classification by year of follow-up and age group is described in Figure 4. Throughout the 3-year duration, individuals aged ⩾75 years consistently fell into more advanced stages of eGFR classification.

Comparison of eGFR (estimated glomerular filtration rate, in mL/min/1.73 m2) categories according to the KDIGO guidelines between individuals aged <75 years and ⩾75 years with diabetic kidney disease. Individuals aged ⩾75 years were consistently classified in more severe stages of eGFR throughout the 3-year period.
Regarding the median values of albuminuria, there was a statistically significant difference only in the first year of follow-up between groups [Figures 5(a) and (b); Table 6].
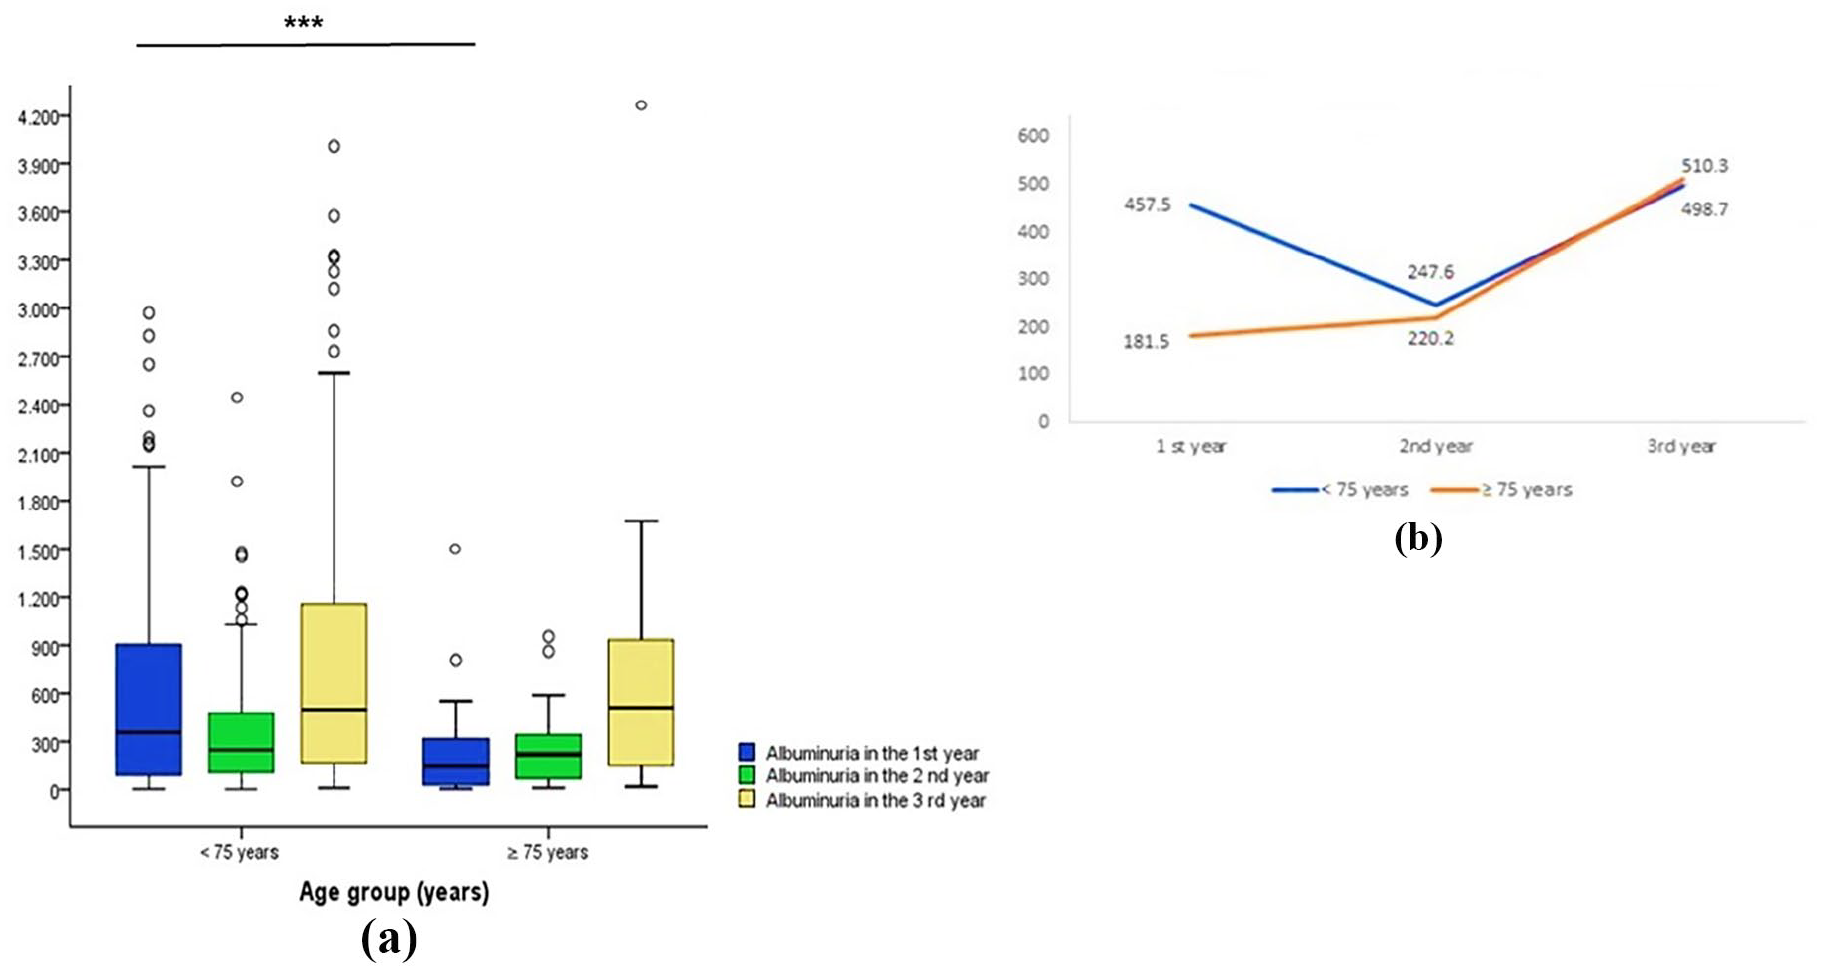
Comparison of albuminuria (mg/24 h) over a 3-year period between individuals aged <75 years and ⩾75 years with diabetic kidney disease. (a) Annual median albuminuria levels, indicating lower levels in individuals aged ⩾75 years in the first year (p < 0.001) but not in the second and third years. (b) Progression of median annual albuminuria levels.
Albuminuria by age group throughout the annual follow-up.
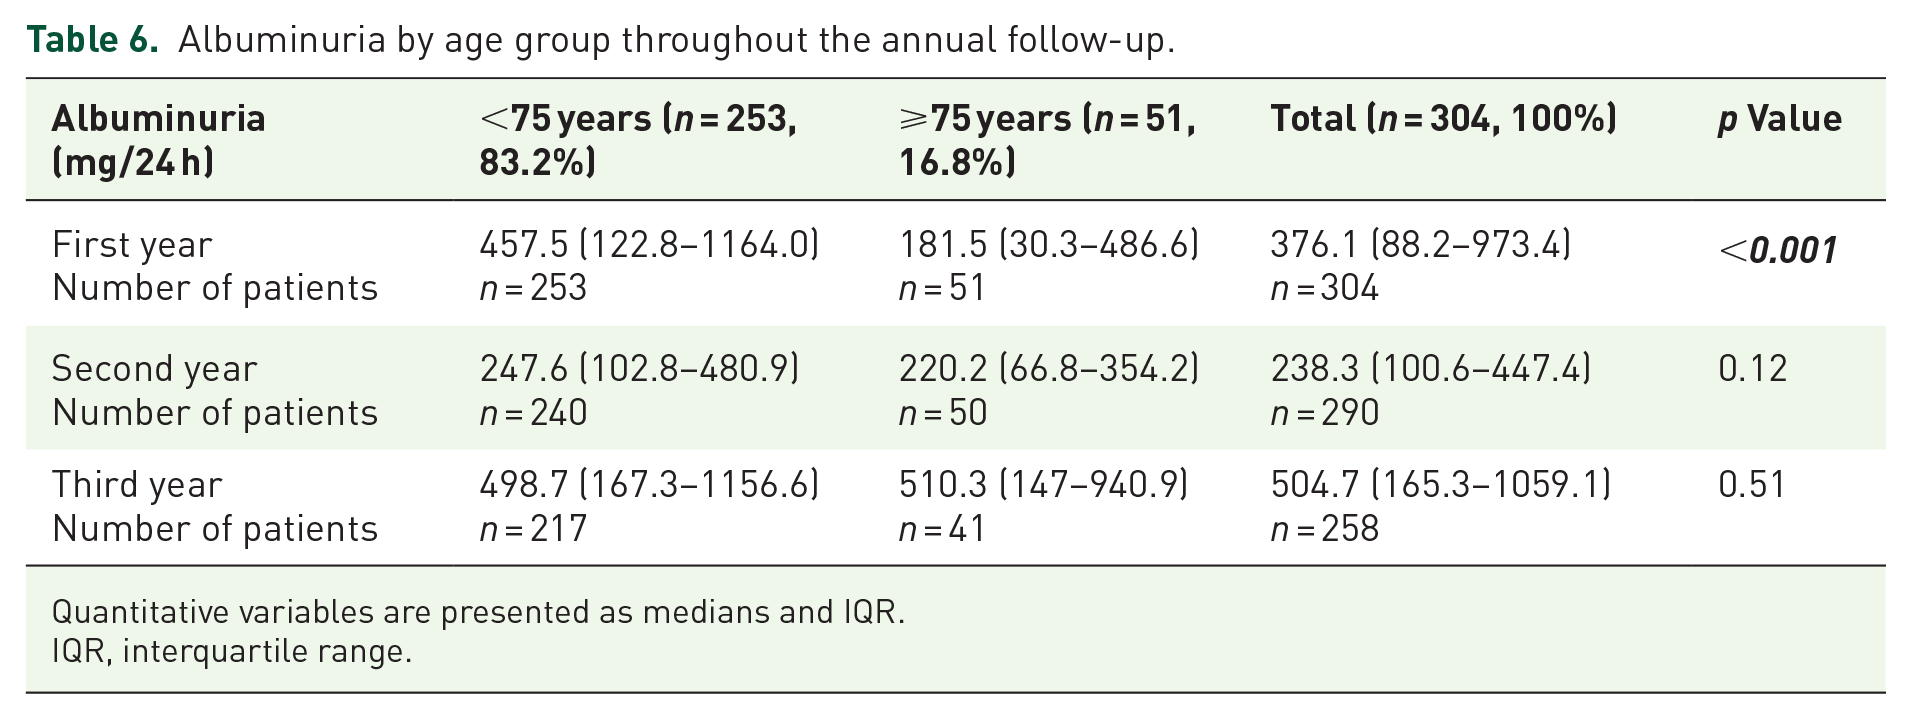
Quantitative variables are presented as medians and IQR.
IQR, interquartile range.
The decline in the median eGFR was similar between the <75 years and ⩾75 years groups, both from the first to the second year and from the second to the third year (Table 7).
eGFR variation by age group throughout the follow-up.

Quantitative variables are displayed as medians and IQR.
eGFR, estimated glomerular filtration rate; IQR, interquartile range.
Worsening of albuminuria during the transition from the first to the second year was more frequent in the ⩾ 75 years group (Table 8).
Frequency of albuminuria increases by age group throughout the follow-up.
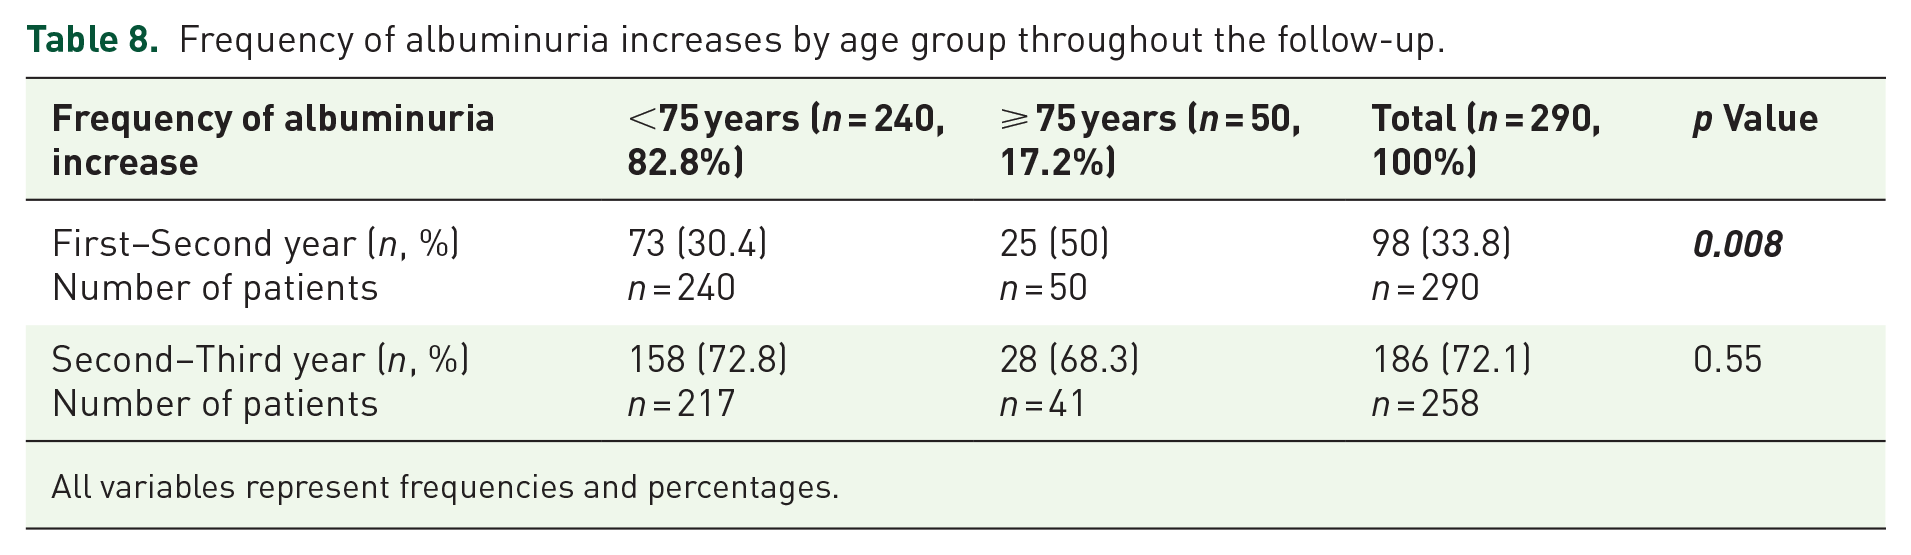
All variables represent frequencies and percentages.
In the univariate analysis, age, average SBP, average DBP, and smoking were associated with eGFR decline during the transition from the first to the third year (Table 9).
Clinical, demographic, and laboratory characteristics associated with a decline in eGFR from the first to the third year (n = 258).

All described variables pertain to the first year of follow-up, except for diabetic retinopathy, hospitalizations within 3 years, hospitalizations due to sepsis or septic shock, and hospitalizations for cardiovascular causes, which refer to the 3-year follow-up period. Quantitative variables are presented as medians and IQR, with the exception of the variable ‘hospitalizations in 3 years’. Univariate and multivariate analyses are indicated as odds ratios, 95% confidence intervals, and p-values.
BMI, body mass index; DBP, diastolic blood pressure; eGFR, estimated glomerular filtration rate; HbA1c, glycated hemoglobin; HDL, high-density lipoprotein; IQR, interquartile range; LDL, low-density-lipoprotein; PVD, peripheral vascular disease; SBP, systolic blood pressure; TIA, transient ischemic attack.
Age and smoking were the main predictors of increase in albuminuria (Table 10).
Clinical, demographic, and laboratory characteristics associated with an increase in albuminuria from the first to the third year (n = 258).

All described variables pertain to the first year of follow-up, except for diabetic retinopathy, hospitalizations within 3 years, hospitalizations due to sepsis or septic shock, and hospitalizations for cardiovascular causes, which refer to the 3-year follow-up period. Quantitative variables are presented as medians and IQR, with the exception of the variable ‘hospitalizations in 3 years’. Univariate and multivariate analyses are indicated as odds ratios, 95% confidence intervals, and p values.
BMI, body mass index; DBP, diastolic blood pressure; HbA1c, glycated hemoglobin; HDL, high-density lipoprotein; LDL, low-density-lipoprotein; PVD, peripheral vascular disease; SBP, systolic blood pressure; TIA, transient ischemic attack.
In the multivariate analysis, average SBP was a positive predictor of eGFR loss (Table 7), while age was a positive predictor of worsening albuminuria (Table 8).
Mortality rates were 10.7% in the <75 years group and 15.7% in the ⩾75 years group, with no significant difference. The rate of progression to RRT was 17.4% in the <75 years group and 15.7% in the ⩾75 years group, with no difference either (Table 11). Kaplan–Meier method estimated renal and patient survival probabilities [Figures 6(a)–(b)].
Comparison of mortality and progression to renal replacement therapy between groups.

RRT, renal replacement therapy.
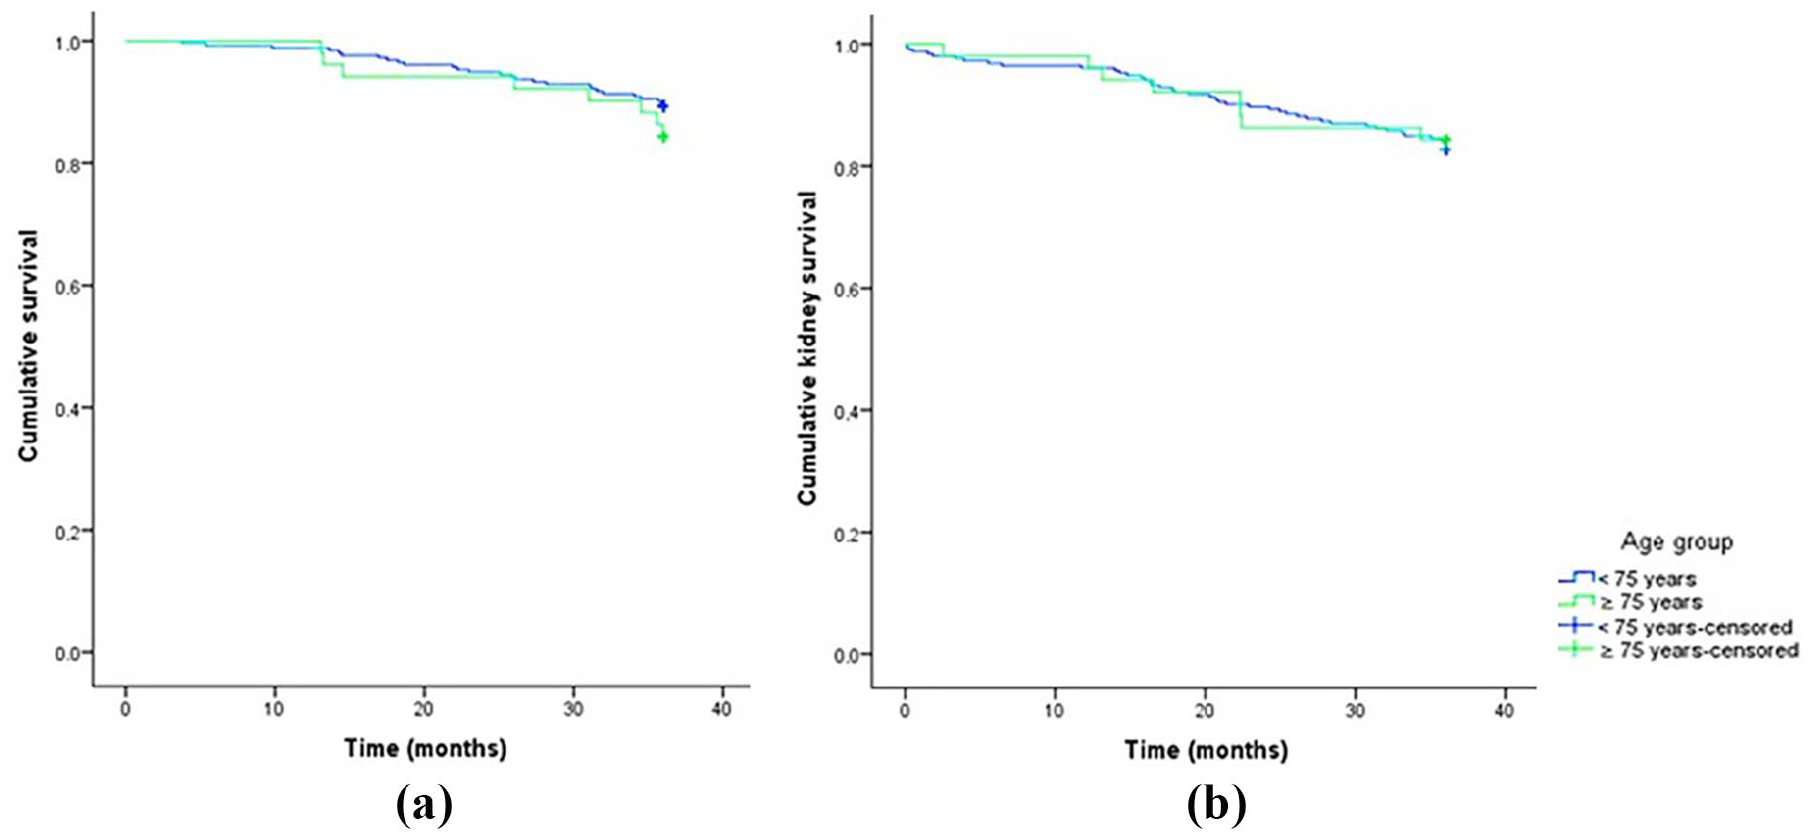
Kaplan–Meier survival curves over a 3-year period between individuals aged <75 years and ⩾75 years with diabetic kidney disease. (a) Overall survival. (b) Kidney survival.
In the univariate analysis, predictors of mortality included age, sex category, hospitalizations in 3 years, hospitalizations for sepsis/septic shock, hospitalizations for cardiovascular causes, stroke/TIA, coronary artery disease, amputation, uric acid levels, and BMI (Table 12). Regarding the variables associated with the evolution to RRT, age, hospitalizations in 3 years, hospitalizations for sepsis/septic shock, hospitalizations for cardiovascular causes, duration of DM, BMI and average SBP and DBP, eGFR variation from the second to the third year, average of 3-year eGFR, percentage change in albuminuria from the first to the second year and average of 3-year albuminuria were the main predictors for this outcome (Table 13).
Clinical, demographic, and laboratory characteristics associated with mortality (n = 304).

All described variables pertain to the first year of follow-up, except for diabetic retinopathy, hospitalizations within 3 years, hospitalizations due to sepsis or septic shock, and hospitalizations for cardiovascular causes, which refer to the 3-year follow-up period. Quantitative variables are presented as medians and IQR, with the exception of the variable ‘hospitalizations in 3 years’. Univariate and multivariate analyses are indicated as odds ratios, 95% confidence intervals, and p-values.
BMI, body mass index; DBP, diastolic blood pressure; HbA1c, glycated hemoglobin; HDL, high-density lipoprotein; LDL, low-density-lipoprotein; PVD, peripheral vascular disease; SBP, systolic blood pressure; TIA, transient ischemic attack.
Clinical, demographic, and laboratory characteristics associated with progression to renal replacement therapy (n = 304).

All described variables pertain to the first year of follow-up, except for diabetic retinopathy, hospitalizations within 3 years, hospitalizations due to sepsis or septic shock, and hospitalizations for cardiovascular causes, which refer to the 3-year follow-up period. Quantitative variables are presented as medians and IQR, with the exception of the variable ‘hospitalizations in 3 years’. Univariate and multivariate analyses are indicated as odds ratios, 95% confidence intervals, and p-values.
BMI, body mass index; DBP, diastolic blood pressure; HbA1c, glycated hemoglobin; HDL, high-density lipoprotein; LDL, low-density-lipoprotein; SBP, systolic blood pressure; TIA, transient ischemic attack; PVD, Peripheral vascular disease.
In the multivariate analysis, age and hospitalizations for cardiovascular causes were positive predictors of mortality (Table 12), while hospitalizations for sepsis/septic shock, hospitalizations for cardiovascular causes, and average SBP were positive predictors of progression to RRT (Table 13).
Discussion
In this study, we noted a comparable decline in eGFR between the two age groups; however, we observed a more pronounced deterioration of albuminuria in older individuals. Our investigation also unveiled an association between elevated blood pressure levels and declining eGFR. Age emerged as a positive predictor of worsening albuminuria levels and increased mortality risk. Furthermore, hospitalizations due to cardiovascular causes displayed a significant predictive link with mortality and progression to RRT. Similarly, hospitalizations attributed to sepsis, higher blood pressure, and albuminuria levels were identified as predictors of progression to RRT.
As outlined in the KDIGO guidelines 1 and Brazilian guidelines 22 pertaining to the management of individuals with DKD, the monitoring of eGFR and albuminuria is recommended for both diagnosis and ongoing follow-up. Importantly, the trajectories of these biomarkers can exhibit variations among individuals with DKD. 23 They may encompass the classical progression pattern, characterized by hyperfiltration and initial rise in albuminuria, followed by subsequent declines in both parameters over time. Additionally, trajectories could involve spontaneous regression in albuminuria, rapid declines in eGFR levels, or reductions in eGFR that are not associated with albuminuria.
It is important to highlight that over 80% of individuals were using ACE inhibitors/ARBs at the beginning of outpatient follow-up, a higher rate compared to other studies.24,25 Despite the use of nephroprotective medications, our study revealed that most diabetic patients presented progression of kidney disease, which is consistent with previous reports.26,27
The decline in eGFR showed statistically similar patterns between the <75 years and ⩾75 years groups. However, we observed that it was more pronounced in the <75 years group. This finding aligns with results from other studies, which propose that the rate of decline in renal function is potentially lower in the elderly.25,28 Nevertheless, comparisons between these two age groups warrant careful interpretation due to potential confounding factors. For example, serum creatinine levels can be influenced by situations not linked to kidney injury, such as changes in muscle mass. 29 Chronic conditions that contribute to sarcopenia can lead to reduced creatinine levels and, consequently, an overestimation of eGFR. 30 This scenario might complicate the estimation of eGFR in frail elderly individuals with low muscle mass.
Our research identified that the group of patients aged ⩾75 years exhibited significantly lower BMI levels than the group aged <75 years, which could potentially result in an eGFR overestimation within the older population. Another aspect that may have contributed to the similar drop in eGFR between the two groups is the fact that patients in the ⩾75 years group displayed better glycemic, blood pressure, and lipid profiles. This improvement may have offset the age-related factor in the ⩾75 years group because we know that adequate control of glycemia, hypertension, and dyslipidemia can delay the progression of kidney disease and mitigate cardiovascular risks. 31
In the older group (⩾75 years old), during the transition from the first to the third year, we observed a more intense increase in albuminuria. This finding aligns with other studies showing increased glomerular basement membrane permeability with aging, allowing greater excretion of proteins like albumin. 32 While albuminuria has limitations and can increase in situations not related to kidney damage such as infection, fever, congestive heart failure, severe hyperglycemia, menstruation, physical exercise, and severe hypertension, 33 and may even remain unaltered in CKD, 34 it remains useful for monitoring the progression of kidney disease. 35
Similar to the TRANSCEND study, wherein the reduction in albuminuria correlated with a decrease in eGFR, raising the hypothesis that the decrease in albuminuria might stem from the reduction in eGFR, 36 our study also reveals that in the analyzed period from the first to the second year, the group of younger individuals (<75 years old) exhibited a decline in albuminuria along with a more pronounced loss of eGFR. However, this greater loss of eGFR was not statistically significant in comparison to the older group (⩾75 years old).
Furthermore, another alternative hypothesis suggests that the decrease in albuminuria could have happened spontaneously. Several studies in the literature have demonstrated that roughly 30–60% of microalbuminuric patients undergo a spontaneous regression to normoalbuminuria.37,38
We noted that elevated blood pressure levels are linked to deteriorating eGFR and serve as predictors for progression to RRT. This aligns with findings from other studies in the literature, demonstrating an association between the progression of DKD and elevated blood pressure levels.39,40
Frailty, multimorbidity, and polypharmacy are more common among older adults with advanced CKD,41–43 and treatment goals for glycemic and blood pressure control tend to be more flexible in these groups, especially in those with low life expectancy. This is exemplified, for instance, by the KDIGO guidelines, 35 which establish HbA1c level target <8% for individuals with numerous comorbidities, advanced CKD stages, and limited life expectancy. Additionally, the ACC/AHA guideline also advises exercising caution when administering antihypertensive drugs to older people with medically restricted life conditions. 44
Despite these more flexible treatment targets, our study found that patients in the ⩾75 years age group exhibited improved better glycemic control and blood pressure levels, along with lower obesity/overweight rates. We believe that these factors significantly contributed to the fact that, despite their advanced age, this group demonstrated similar mortality rates and progression to RRT as the <75 years age group. The advantages of maintaining lower blood pressure among the elderly are underscored by a meta-analysis of trials involving antihypertensive agents conducted on patients over 80 years old, which concluded that such treatment resulted in a 34%, 22%, and 39% risk reduction for strokes, major cardiovascular events, and heart failure, respectively. 45
Considering the HbA1c levels and the lack of association with the worsening of renal function in our study, it can be speculated that HbA1c values were not accurate for estimating glucose levels. This is particularly evident in CKD patients, where there is chronic inflammation, reduced erythrocyte lifespan and production, along with hyperparathyroidism and deficiencies in erythropoietin, iron, folic acid, and vitamin B12. 46
Moreover, other CKD-related factors such as hemoglobin carbamylation, a posttranslational protein modification, may be altered in the uremic milieu. In the presence of anemia, carbamylation may modify the impact of HbA1c on renal outcomes in patients with coexisting DM and CKD. 47 When all these factors are considered together, their impact becomes more pronounced as renal function worsens. Therefore, it is essential to approach the evaluation of HbA1c with caution in such cases.
Our study also revealed a significantly heightened risk of mortality and progression to RRT among patients with records of hospitalizations due to cardiovascular causes. This finding reinforces what has been documented in the medical literature, where cardiovascular diseases emerge as the primary cause of morbidity and mortality in individuals with T2D. 48
We acknowledge the limitations inherent to this single-center study. Additionally, it is important to note that the majority of patients within this cohort were of Caucasian ethnicity, thereby warranting careful extrapolation of our conclusions to other racial groups. As with any observational data, unavoidable bias and confounding factors are inherent, although our study design was devised to mitigate these issues. Despite the retrospective nature of data collection and the absence of patients using SGLT2 inhibitors, our findings underscore the significance of investigating the progression of DKD in elderly individuals. While aging triggers a gradual decline in multiple physiological processes, elevating the risk of health, 49 our work suggests that managing modifiable risk factors in older populations (such as blood pressure, blood glucose, cholesterol levels, and BMI) can potentially align the progression of DKD and mortality rates more closely with those of younger populations. Furthermore, it is crucial to continue investigating the safety and effectiveness of SGLT2 inhibitors in older adults. This class of medications has demonstrated considerable cardiorenal advantages for both diabetic and non-diabetic CKD patients, with mean ages usually following between 50–65 years. 50 Worth noting is the promising early assessment of SGLT2 inhibitors in adults with an average age of 75 years. 51
In conclusion, our research highlights that the decline in eGFR may exhibit similarity across different age groups, and age appears to serve as a predictive factor for worsening albuminuria. Moreover, alongside age, hospitalizations and elevated blood pressure levels are correlated with declining renal function and/or increased mortality within the context of DKD. Consequently, enhancing outcomes among DKD patients necessitates the implementation of timely interventions and personalized management strategies.
Supplemental Material
sj-docx-1-tae-10.1177_20420188241242947 – Supplemental material for Age-related markers and predictors of diabetic kidney disease progression in type 2 diabetes patients: a retrospective cohort study
Supplemental material, sj-docx-1-tae-10.1177_20420188241242947 for Age-related markers and predictors of diabetic kidney disease progression in type 2 diabetes patients: a retrospective cohort study by Larissa Fabre and Érika Bevilaqua Rangel in Therapeutic Advances in Endocrinology and Metabolism
Footnotes
References
Supplementary Material
Please find the following supplemental material available below.
For Open Access articles published under a Creative Commons License, all supplemental material carries the same license as the article it is associated with.
For non-Open Access articles published, all supplemental material carries a non-exclusive license, and permission requests for re-use of supplemental material or any part of supplemental material shall be sent directly to the copyright owner as specified in the copyright notice associated with the article.