
Abstract
Background
The Chronic Kidney Disease Epidemiology Collaboration (CKD-EPI) and Modification of Diet in Renal Disease (MDRD) equations are common for calculating estimated glomerular filtration rate (eGFR). Unlike CKD, the key pathological change of diabetic kidney disease (DKD) is glomerulosclerosis.
Methods
To conduct a meta-analysis of the diagnostic performance of the CKD-EPI and MDRD equations in diabetic patients, we searched PubMed, Embase and the Cochrane Library for studies comparing standard GFR (sGFR) with eGFR using these two equations.
Results
Thirteen studies of 7192 diabetic patients reporting data on bias or accuracy were included. At the study level, both equations underestimated eGFR. CKD-EPI was more accurate in studies with mean GFR ≥60 mL/minute/1.73 m2. At the individual level, both equations overestimated GFR by 6.38 mL/minute/1.73 m2 (95% confidence interval [CI] 2.67–10.1) and 7.65 mL/minute/1.73 m2 (95% CI 2.78–12.52), respectively, for sGFR < 90 mL/minute/1.73 m2. The CKD-EPI equation was 7.61% (95% CI 4.66–10.56) more accurate in subjects with sGFR > 90 mL/minute/1.73 m2. The CKD-EPI equation performed poorly in diabetic patients.
Conclusions
The CKD-EPI equation can be used to estimate GFR in patients with incipient DKD, but has drawbacks. Improved eGFR equations suitable for diabetic populations are needed.
Keywords
Introduction
Diabetic kidney disease (DKD), a major diabetic microvascular complication, develops in 25% to 40% of patients with diabetes mellitus (DM) and is the single most common cause of end-stage renal failure worldwide. 1 Progressive renal injury often goes unrecognized until more than 50% of normal renal function is lost. Early detection and timely interventions can delay or prevent adverse outcomes, improving long-term prognosis for patients with DKD.
Evaluation of DKD is based on albuminuria and the glomerular filtration rate (GFR). Initial evaluation of DKD using serum creatinine and GFR estimation equations is highly recommended by all clinical guidelines and expert consensus reports. 2 , 3 The results of cross-sectional studies showed that some diabetic patients had no urinary albumin excretion abnormalities but already showed a decrease in GFR, suggesting that patients with negative urinary albumin might also have DKD. 4 , 5 Renal function as determined via the estimated glomerular filtration rate (eGFR) was previously found to decrease by 2 to 3 mL/minute per year in diabetic patients. 6 Accurate estimation of GFR is crucial for detecting and staging DKD, stratifying risk, and determining drug dosing.
Renal function is most reliably assessed using substances that are exclusively filtered by the kidneys. However, this approach is both invasive and costly. In clinical practice, the Chronic Kidney Disease Epidemiology Collaboration (CKD-EPI) and Modification of Diet in Renal Disease (MDRD) equations are the most used creatinine-centered eGFR equations. The original MDRD equation (MDRD186) used a constant factor of 186. Because of the standardization of creatinine assays against the isotope dilution-mass spectrometry reference method, Levey et al. 7 , 8 later revised and re-expressed the equation using a constant factor of 175 (MDRD175). Nonetheless, the MDRD186 equation performs well in subjects with GFR ≤60 mL/minute/1.73 m2, but underestimates GFR for GFR ≥60 mL/minute/1.73 m2. 7 The revised MDRD175 did not improve this limitation compared with the gold standard method. 3 In 2009, the CKD-EPI equation was developed to reduce bias associated with the MDRD equation, especially among patients with GFR ≥60 mL/minute/1.73 m2. However, whether the performance of the CKD-EPI equation is superior to that of the MDRD equation in diabetic patients remains controversial.9–13
Systematic reviews and meta-analyses of the performance of the CKD-EPI and MDRD equations have been conducted in populations with CKD, but not specifically in patients with DM with or without overt nephropathy. 9 , 14 , 15 In the current study, we conducted a meta-analysis to compare the diagnostic performance of the CKD-EPI and MDRD equations in patients with DM. We also evaluated the accuracy of the CKD-EPI equation in DM and non-DM patients.
Materials and methods
Search strategy, selection criteria and quality assessment
We searched PubMed, Embase and the Cochrane Library for studies published prior to June 10, 2019 comparing standard GFR (sGFR) defined using a reference method (i.e., radionuclides, iodinated tracers or inulin clearance) with eGFR calculated using the MDRD and CKD-EPI equations from serum creatinine (Scr) data. MeSH keywords included CKD-EPI, MDRD, glomerular filtration rate and diabetes mellitus. In addition, we hand searched the references of key relevant articles.
To be included, studies had to: (a) simultaneously assess the bias and accuracy of MDRD and CKD-EPI equations compared with sGFR in patients with DM; (b) use sGFR obtained via measurement of inulin, iohexol, 99mTc-diethylenetriaminepentaacetic acid (DTPA) or 51Cr-ethylenediaminetetraacetic acid (EDTA); (c) provide either accuracy [percentage of eGFR measurements within 30% of sGFR (P30)] 16 or mean bias (mean difference between eGFR and sGFR) information; and (d) recruit patients >18 years of age. This search was limited to human studies without any language limitations.
Two reviewers extracted the data and discrepancies were settled by discussing with a third reviewer. A standardized data extraction tool was used to extract information on mean bias, standard deviation (SD), accuracy, publication year and sGFR. The methodological quality of studies including potential for bias was evaluated via quality assessment of diagnostic accuracy studies (QUADAS-2). Study quality was evaluated in four domains: patient selection, index test, reference test, and flow and timing.
Estimation of renal function
The equations used to determine eGFR were as follows: (i) the MDRD equation (2000): GFRMDRD186 = 186 × [Scr (mg/dL)]−1.154 × [age(years)]−0.203 × 0.742 (if female) × 0.180 (if black) 17 ; (ii) the MDRD equation (2007): GFRMDRD175 = 175 × [Scr (mg/dL)]−1.154 × [age (years)]−0.203 × 0.742 (if female) × 0.180 (if black) 8 ; and (iii) the CKD-EPI equation (2009): GFREPI = 141 × (Scr/κ)α × (0.993) age × 1.018 (if female) × 1.159 (if black) 3 , where κ = 0.7 (female) or 0.9 (male) and α = −0.329(female) or −0.411(male).
Statistical analysis
We defined bias as eGFR minus sGFR for each subject and accuracy (P30) as the percentage of eGFRs that were within ±30% of the sGFR. We calculated bias as the mean error, with the mean value used to describe the distribution. We calculated accuracy as the percentage of subjects with an absolute percent error less than 30% (P30). We conducted meta-analyses of bias comparing eGFR estimated using the MDRD and the CKD-EPI equations with sGFR (both at the study and individual levels). We analyzed differences in the accuracy of the MDRD and CKD-EPI equations in studies in which they were compared with sGFR. Data were stratified into high and low mean GFR (mGFR) (study level) or into different sGFR levels (individual level). P30 was the primary outcome, as it is a common measurement of the accuracy of GFR estimations. Differences in accuracy were assessed between eGFR calculated using the MDRD and CKD-EPI equations. A negative difference in accuracy indicated that the MDRD equation was more accurate than the CKD-EPI equation.
We used random-effects inverse-variance weighted meta-analysis to pool the data. The SD was calculated by taking the mean SD from studies or computing one from standard error (SE) or confidence intervals (CIs). We used the square root of [proportion × (1-proportion)/n] to compute the SEs of the accuracy. Studies were ordered in forest plots by mGFR (low to high at the study level) and different levels of sGFR (individual level). At the study level, subgroup analyses compared low and high mean GFR (<60 and ≥60 mL/minute/1.73 m2, respectively) to identify differences in bias and accuracy between MDRD and CKD-EPI. At the individual level, subgroup analyses compared different levels of sGFR (i.e., sGFR > 90 mL/minute/1.73 m2 and 30–60 mL/minute/1.73 m2) to identify differences in bias and accuracy between MDRD and CKD-EPI.
Heterogeneity was evaluated using the I2 statistic. Heterogeneity was classified as low for I2 < 25%, moderate for 25 ≤I2 ≤75, and high for I2 > 75%. Random-effects meta-regression was used to investigate high heterogeneity. Potential sources of heterogeneity were explored using subgroup analysis. The stability of the results was assessed by sensitivity analysis, which excluded smaller studies and sequentially omitted one study at a time. We assessed potential publication bias by constructing a funnel plot. Stata version 11.0 (StataCorp LP, College Station, TX, USA) was used for statistical analysis.
Results
Figure 1 summarizes the study selection process. A total of 5422 reports were initially identified. Following removal of 1769 duplicate records, 3653 articles remained for screening. Thereafter, 3201 reports were excluded after the titles and abstracts were reviewed. After a full-text review of the remaining 452 articles, we excluded 439 studies that did not meet the inclusion criteria. Reasons for exclusion are shown in Figure 1. Thirteen studies18–30 of 7192 patients with DM met the inclusion criteria.

Flow chart of selection of studies eligible for meta-analysis.
The characteristics of the included studies are summarized in Table 1. Of the 13 included studies, one included data from multiple subgroups, resulting in 14 comparisons. Ten studies reported both accuracy P30 and mean bias, while three studies (four comparisons) reported accuracy P30 only.
Characteristics of included studies using the MDRD and CKD-EPI equations.
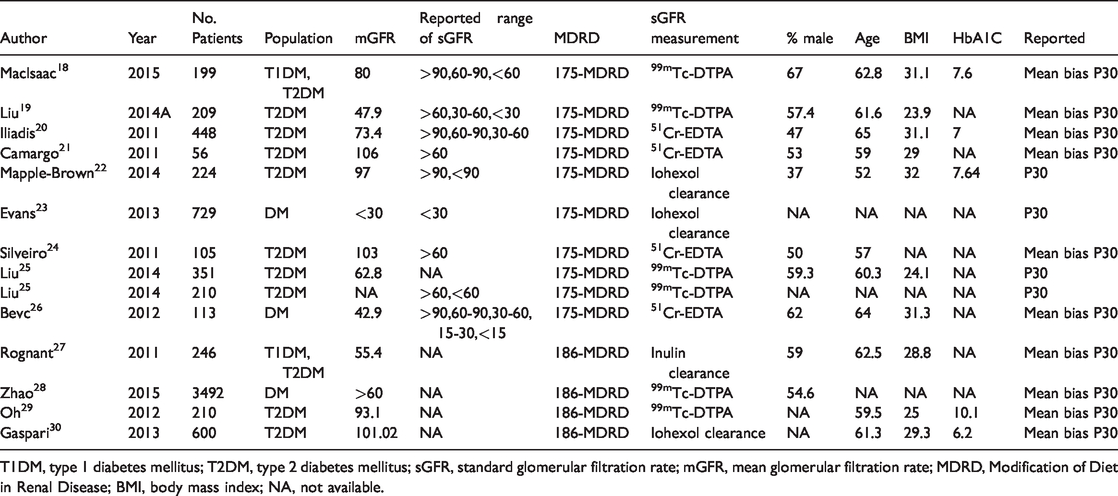
T1DM, type 1 diabetes mellitus; T2DM, type 2 diabetes mellitus; sGFR, standard glomerular filtration rate; mGFR, mean glomerular filtration rate; MDRD, Modification of Diet in Renal Disease; BMI, body mass index; NA, not available.
Study quality was assessed using QUADAS-2 as follows. Six studies fulfilled all QUADAS-2 criteria for determining the risk of bias. For patient selection, five studies had a high risk of bias and two studies had an uncertain risk of bias. Two studies showed an unclear risk of bias for the domain of “reference standard”.
Mean bias and accuracy using MDRD and CKD-EPI equations for eGFR at the study level
Mean bias estimates for both equations were reported in 10 studies of 5592 diabetic patients. In study-level meta-analyses, the overall mean bias of the MDRD equation was −9.52 mL/minute/1.73 m2 (95% CI: −17.42 to −1.62 mL/minute/1.73 m2) with a high degree of heterogeneity between studies (I2 = 99.4%; P < 0.001). The overall mean bias of the CKD-EPI equation was −9.83 mL/minute/1.73 m2 (95% CI: −17.91 to −1.74 mL/minute/1.73 m2) with high heterogeneity between studies (I2 = 99.5%; P < 0.001; Figure 2). Subgroup analyses of low and high mGFR studies showed that both the CKD-EPI and MDRD equations underestimated GFR in the higher mGFR group (mGFR > 60 mL/minute/1.73 m2; Figure 2). Sensitivity analyses excluding studies with <100 participants and sequentially omitting one study at a time yielded similar results (data not shown).
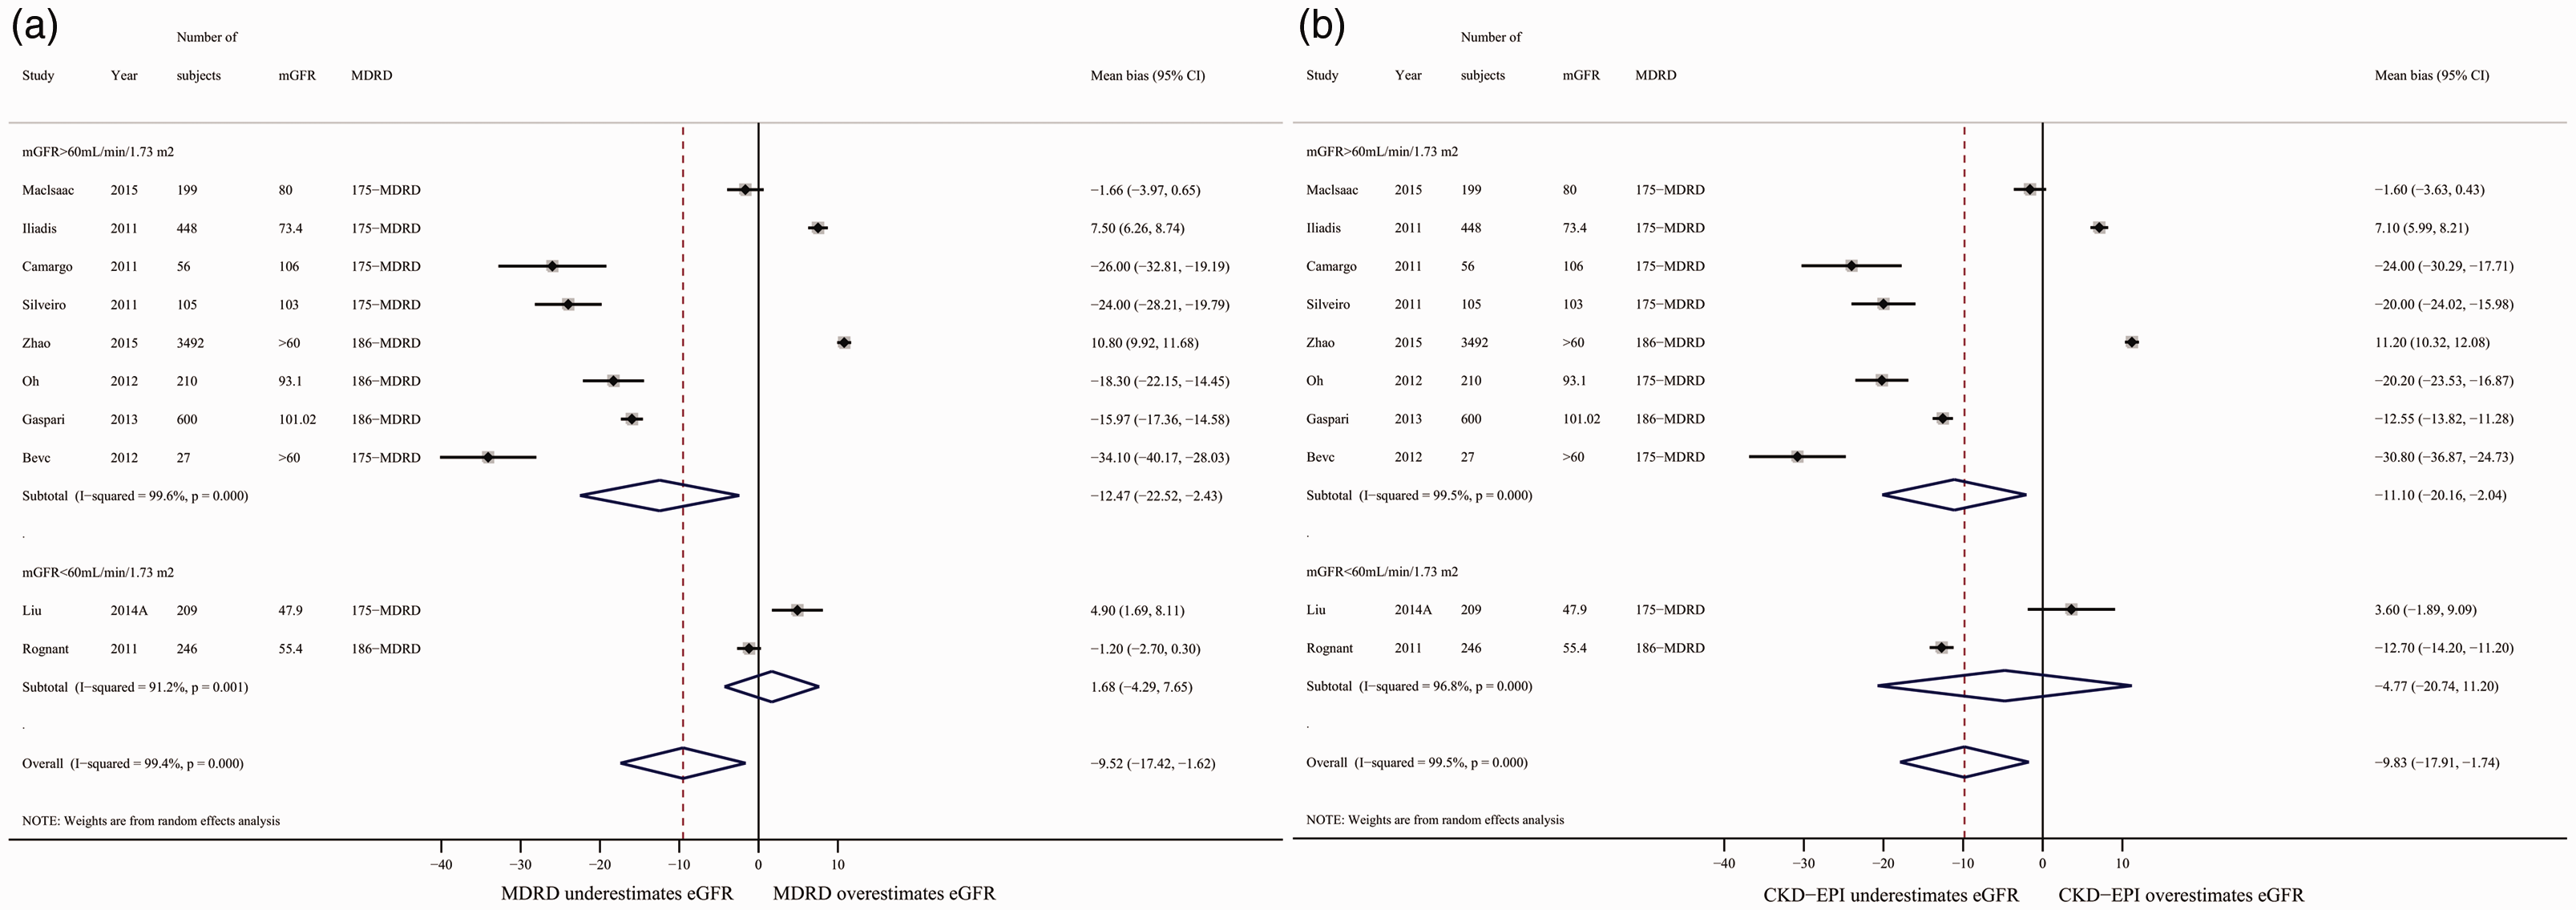
Mean bias between eGFR and mean GFR (mGFR) calculated using the MDRD (a) and CKD-EPI (b) equations, stratified into subgroups of mGFR > 60 mL/minute/1.73 m2 and mGFR < 60 mL/minute/1.73 m2. Random-effects models were applied. Mean bias=eGFR-mGFR.
Across the 14 studies of 7192 diabetic patients that reported accuracy P30, the accuracy P30 of the CKD-EPI equation was 4.67% (95% CI: 3.04% to 6.31%) higher than that of the MDRD equation with a low level of heterogeneity (I2 = 9.8%; Figure 3). Subgroup analyses of low and high mGFR studies showed that CKD-EPI was significantly more accurate than MDRD, but only for studies with mGFR ≥60 mL/minute/1.73 m2 (Figure 3). Sensitivity analyses excluding studies with < 100 participants and sequentially omitting one study at a time yielded similar results (data not shown). Another subgroup analysis of the MDRD175 and MDRD186 equations yielded similar results (data not shown).
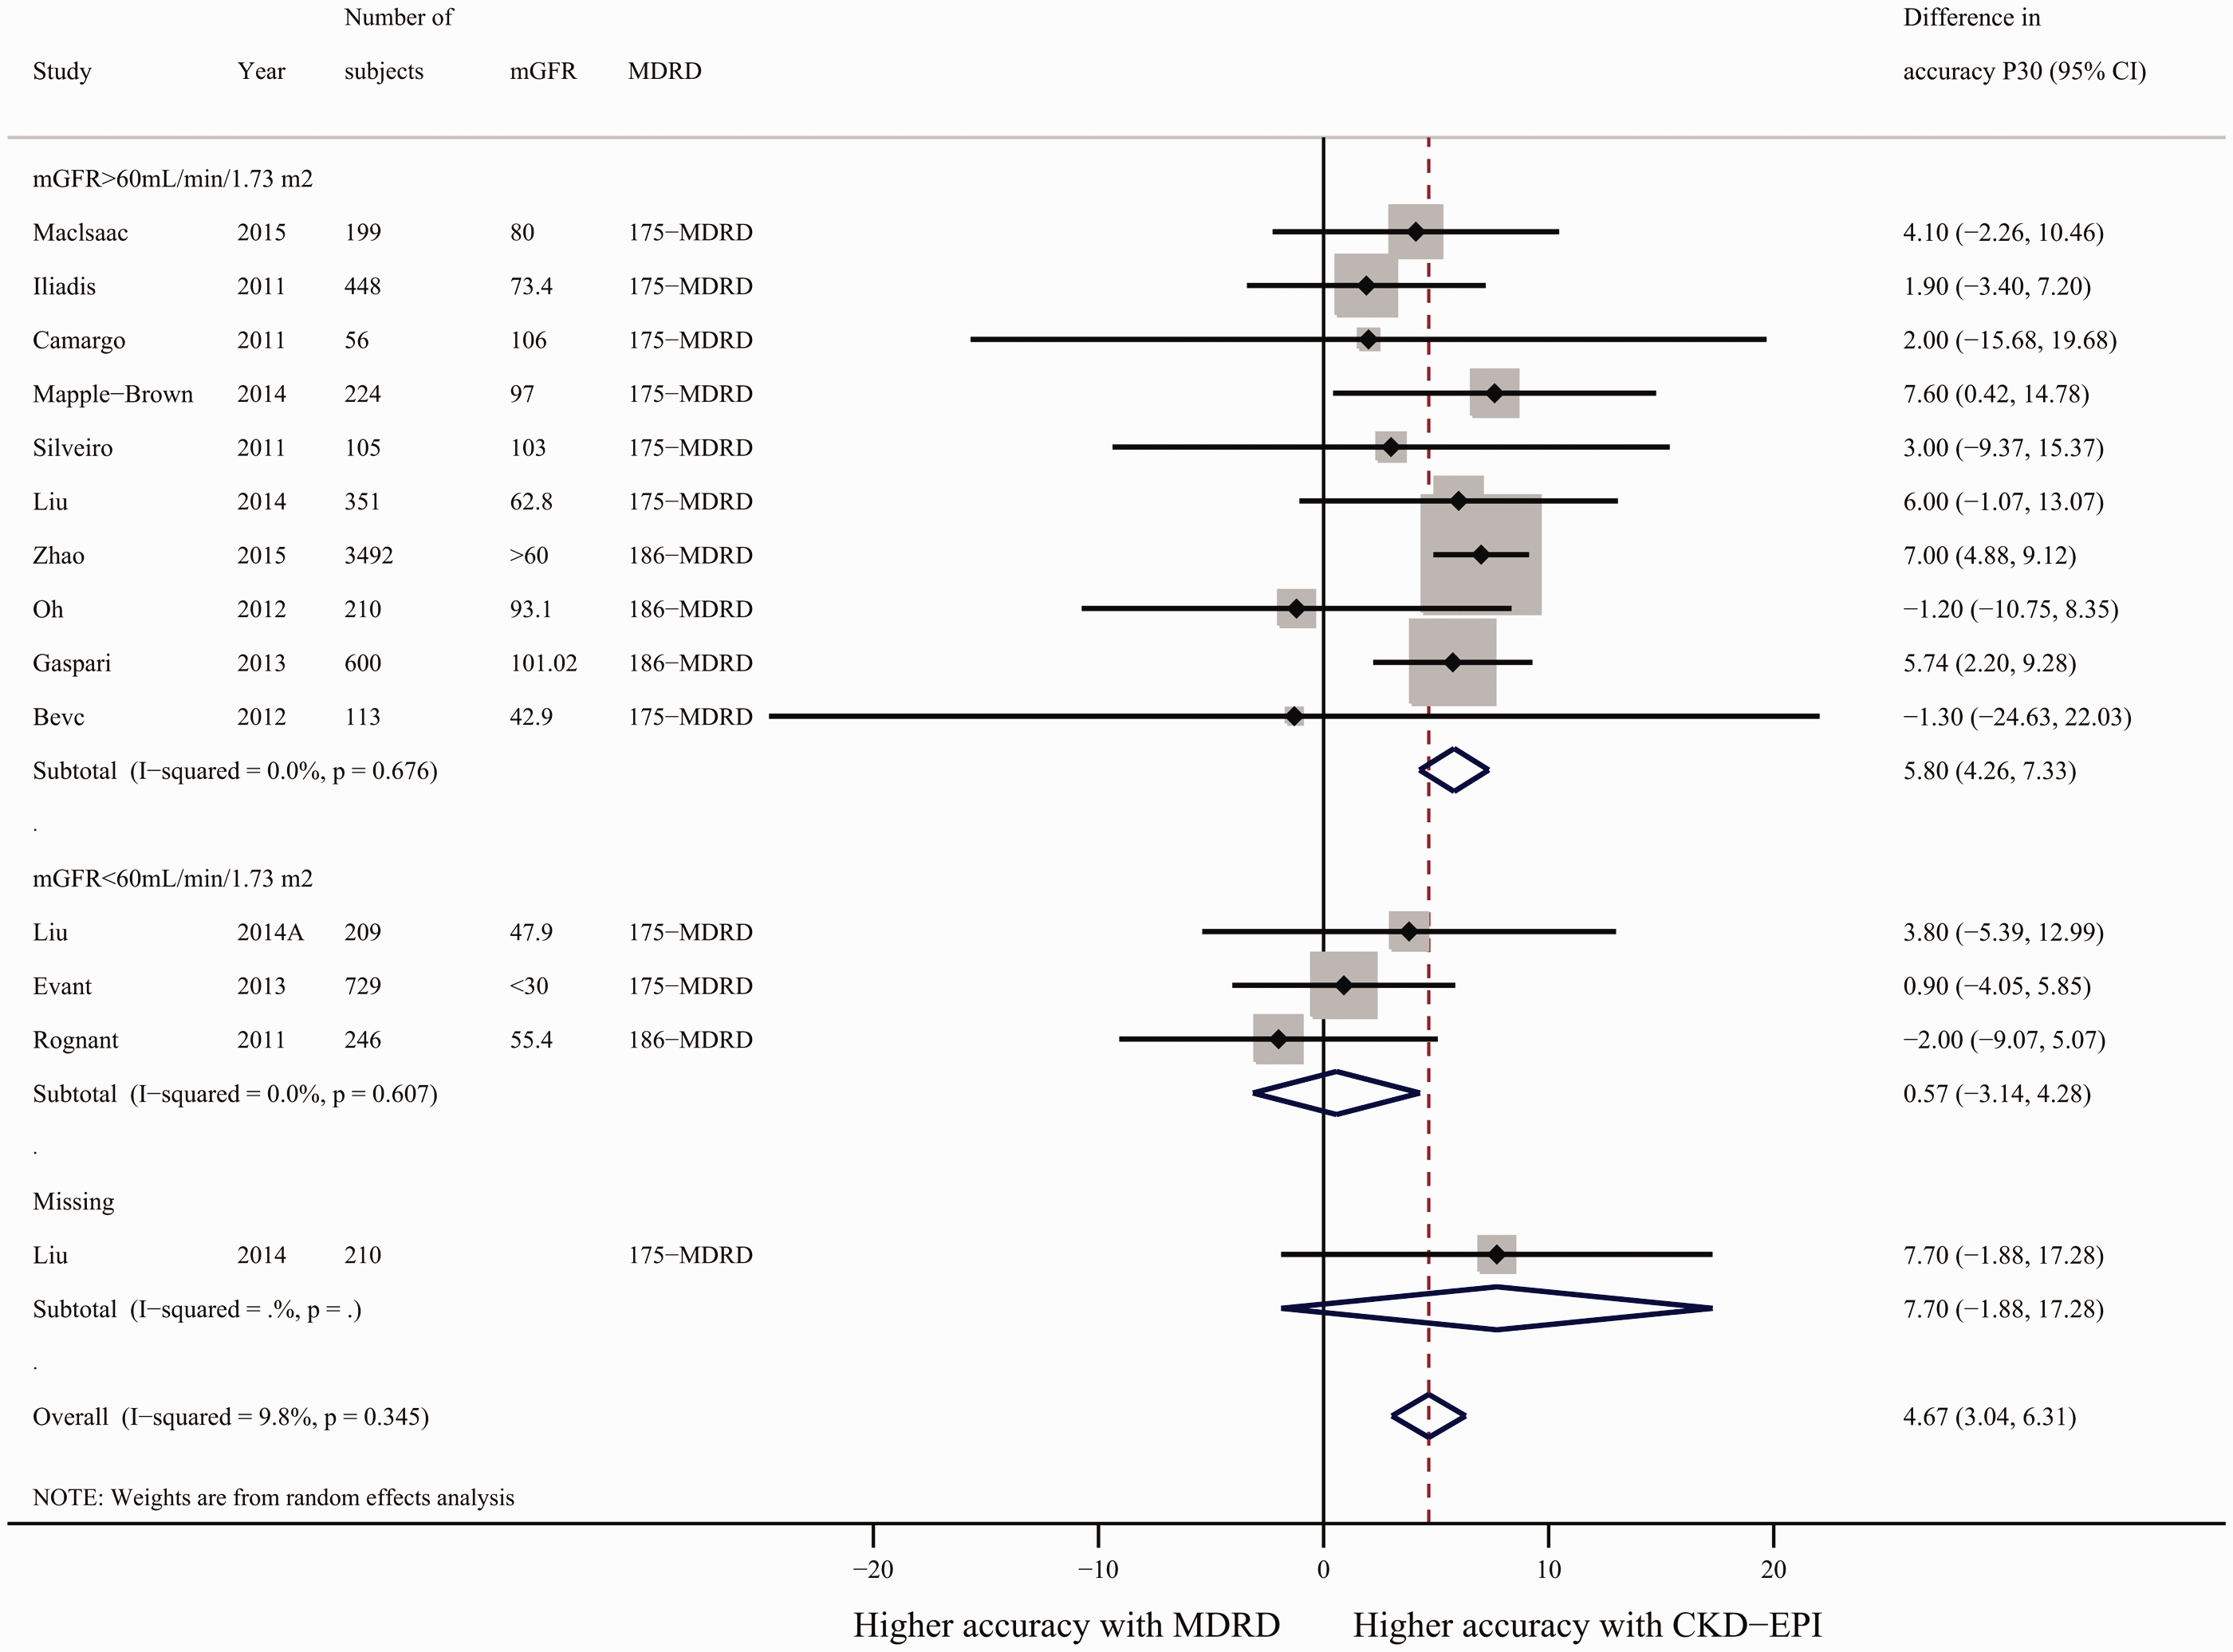
Difference in accuracy of the CKD-EPI and MDRD equations. Pooled estimates were stratified into subgroups of mGFR > 60 mL/minute/1.73 m2 and mGFR< 60 mL/minute/1.73 m2. A random-effects model was applied. P30, proportion of eGFR results within 30% of sGFR; difference in accuracy P30 = accuracy P30 from CKD-EPI - accuracy P30 from MDRD.
Subgroup analysis of the MDRD175 and CKD-EPI equations at different sGFR levels
In individual-level meta-analyses, we explored the bias and accuracy of the MDRD175 and CKD-EPI equations at different sGFR levels. Nine studies20–28 of 2293 diabetic patients with explicit sGFR levels (e.g., sGFR > 90 mL/minute/1.73 m2 or sGFR < 60 mL/minute/1.73 m2) using both the MDRD175 and CKD-EPI equations were included.
Across the five studies of 921 diabetic patients that reported bias, both the MDRD and CKD-EPI equations overestimated GFR by 6.38 mL/minute/1.73 m2 (95% CI: 2.67–10.1 mL/minute/1.73 m2; two comparisons; I2 = 93.6%; P < 0.001) and 7.65 mL/minute/1.73 m2 (95% CI: 2.78–12.52 mL/minute/1.73 m2; two comparisons; I2 = 91.7%; P < 0.001), respectively, in individuals with sGFR < 90 mL/minute/1.73 m2. Three subgroup analyses (sGFR < 90 mL/minute/1.73 m2; sGFR 60–90 mL/minute/1.73 m2 and sGFR < 60 mL/minute/1.73 m2) showed that both the CKD-EPI and MDRD equations overestimated the GFR. Both the MDRD and CKD-EPI equations underestimated GFR by 16.43 mL/minute/1.73 m2 (95% CI: 0.55–32.31 mL/minute/1.73 m2; five comparisons; I2 = 97%; P < 0.001) and 17.04 mL/minute/1.73 m2 (95% CI: 8.01–26.07 mL/minute/1.73 m2; five comparisons; I2 = 86.7%; P < 0.001), respectively, in subjects with a sGFR > 60 mL/minute/1.73 m2 (Figure 4).

Mean bias as determined by comparing eGFR and mGFR calculated using the MDRD (a) and CKD-EPI (b) equations, stratified into subgroups of different sGFR levels (sGFR > 90 mL/minute/1.73 m2; sGFR < 60 mL/minute/1.73 m2; sGFR > 60 mL/minute/1.73 m2; sGFR 60–90 mL/minute/1.73 m2; and sGFR < 90 mL/minute/1.73 m2). A random-effects model was applied. Mean bias = (eGFR) – (mGFR).
Across the nine studies of 2293 diabetic patients that reported accuracy P30, we found that accuracy P30 for CKD-EPI was 7.61% higher than for MDRD (95% CI: 4.66% to 10.56%; four comparisons) with low heterogeneity across studies (I2 = 0%) in subjects with sGFR > 90 mL/minute/1.73 m2. Subgroup analyses showed that CKD-EPI was significantly more accurate than MDRD among patients with a sGFR > 60 mL/minute/1.73 m2. No differences in accuracy P30 were identified between the MDRD and CKD-EPI equations across five subgroups (sGFR <90 mL/minute/1.73 m2, sGFR 60–90 mL/minute/1.73 m2, sGFR < 60 mL/minute/1.73 m2, sGFR 30–60 mL/minute/1.73 m2 and sGFR < 30 mL/minute/1.73 m2; Figure 5).

Differences in the accuracy of the CKD-EPI and MDRD equations. Pooled estimates were stratified into subgroups of different sGFR levels (sGFR > 90 mL/minute/1.73 m2; sGFR < 60 mL/minute/1.73 m2; sGFR > 60 mL/minute/1.73 m2; sGFR 60–90 mL/minute/1.73 m2; sGFR < 90 mL/minute/1.73 m2; sGFR 30–60 mL/minute/1.73 m2; and sGFR < 30 mL/minute/1.73 m2). A random-effects model was applied. P30, proportion of eGFR results that were within 30% of sGFR; differences in the accuracy P30 = accuracy P30 from CKD-EPI - accuracy P30 from MDRD.
Performance of the CKD-EPI equation in DM and non-DM patients
We conducted a meta-analysis to evaluate the accuracy of CKD-EPI in DM and non-DM populations with similar levels of renal function. We included studies that: (a) compared the accuracy of the CKD-EPI equation to sGFR in DM and non-DM subjects simultaneously, (b) used sGFR, including measurement of inulin, iohexol, 99mTc-DTPA or 51Cr-EDTA clearance, (c) provided accuracy P30 information, and (d) recruited patients > 18 years of age. Six studies21–23,25,31,32 of 1660 DM and 1517 non-DM patients simultaneously reported accuracy P30 using the CKD-EPI equation. Table 2 shows the characteristics of the included studies.
Characteristics of studies simultaneously evaluating the CKD-EPI equation in DM and non-DM patients.

DM, diabetes mellitus; sGFR, standard glomerular filtration rate; mGFR, mean glomerular filtration rate; NA, not available.
For the six included studies, accuracy P30 in non-DM subjects was 10.56% higher than that in DM subjects (95% CI: 6.14% to 14.97%) with moderate heterogeneity (I2 = 57.8%; P = 0.037). Sensitivity analyses omitting one study at a time yielded similar results (data not shown; Figure 6).

Difference in accuracy P30 between DM and non-DM subjects using the CKD-EPI equation.
Between-study heterogeneity
Significant evidence of heterogeneity was detected when we pooled the overall results by “mean bias.” Meta-regression was used to explore the source of high heterogeneity for the MDRD and CKD-EPI equations, respectively. Except for mGFR, which could decrease the I2 statistic by 5%, no other covariate [i.e., HbA1c, case number, age, or body mass index (BMI)] accounted for the high level of heterogeneity.
Publication bias analysis
The potential for publication bias was examined using the funnel plot asymmetry test at the study level. Egger’s regression asymmetry test and Begg’s filled funnel plot detected no publication bias in mean bias.
For accuracy P30, the results of the Egger and Begg tests for publication bias were contradictory (P = 0.043 and not significant, respectively). We further assessed publication bias using Duval’s trim and fill method. No indications of publication were detected (no new studies added).
Discussion
In diabetic patients, we found that at the individual level, the CKD-EPI equation was significantly more accurate than the MDRD equation in two sGFR subgroups (sGFR > 90 mL/minute/1.73 m2 and sGFR > 60 mL/minute/1.73 m2). No difference in accuracy P30 was identified between the MDRD and CKD-EPI equations in the sGFR 60–90 mL/minute/1.73 m2 subgroup. We concluded that the CKD-EPI equation performs better than the MDRD equation in terms of accuracy, but only in diabetic subjects with sGFR > 90 mL/minute/1.73 m2. Study-level analyses yielded similar results. Hyperfiltration (usually > 100 mL/minute/1.73 m2) confers an increased risk of diabetic nephropathy. Higher accuracy was observed for the CKD-EPI equation compared with the MDRD equation for higher GFR values (sGFR > 90 mL/minute/1.73 m2), which more easily enables hyperfiltration recognition. In the same way, another study concluded that the CKD-EPI equation could be used as a screening tool for early renal impairment because of its better performance characteristics compared with MDRD in diabetic patients with hyperfiltration and normal albuminuria. 12 Studies recently demonstrated that the CKD-EPI equation provides improved risk prediction for cardiovascular mortality, heart failure and end-stage renal disease compared with the MDRD equation.33–35 Given the distribution of renal function in diabetic patients, 36 our results support the decision of the Kidney Disease: Improving Global Outcomes and American Diabetes Association guidelines to estimate GFR using the CKD-EPI equation. 37 , 38
Individual-level tests showed that both the MDRD and CKD-EPI equations overestimated GFR for individuals with sGFR < 90 mL/minute/1.73 m2. This might lead physicians to neglect the early stages of GFR decline and delay administration of renin-angiotensin system blockers. This challenge should be noted. Both the CKD-EPI and MDRD equations underestimated GFR in those with sGFR > 60 mL/minute/1.73 m2. Given that both equations overestimated the GFR in the 60–90 mL/minute/1.73 m2 sGFR subgroup, we speculate that both equations underestimated GFR for higher GFR values (sGFR > 90 mL/minute/1.73 m2). Study level analyses yielded similar results. Statistical and clinical heterogeneity between studies was high. Different characteristics of these studies may have produced the observed heterogeneity, including methodological quality, admission category and human variability. Our results are consistent with those of previously published studies. A retrospective study of 152 type 2 DM patients reported that the GFR, as estimated using the CKD-EPI equation, overestimated GFR at lower sGFR levels and underestimated GFR at higher sGFR levels. 36 Similarly, another study conducted in 600 DM patients concluded that both the MDRD and the CKD-EPI equations significantly underestimated the GFR at sGFR > 80 mL/minute/1.73 m2 and overestimated the GFR at sGFR < 80 mL/minute/1.73 m2. 30
The present meta-analysis was conducted in patients with DM. Another meta-analysis compared the MDRD and CKD-EPI equations and evaluated 48 studies (eight studies of diabetic patients). This study found that both equations underestimated mGFR; however, CKD-EPI showed greater accuracy than MDRD at higher mGFR values (mGFR > 60 mL/minute/1.73 m2). Our meta-analysis evaluated performance at the individual level and showed that both equations overestimated the GFR at sGFR < 90 mL/minute/1.73 m2. The CKD-EPI provided more accurate estimates of GFR at sGFR > 90 mL/minute/1.73 m2, enabling better identification of hyperfiltration in diabetes. The problem of overestimating GFR in diabetic patients with abnormal renal function could have detrimental effects on patient outcomes.
In addition, we conducted another meta-analysis to evaluate the accuracy of the CKD-EPI equation in DM and non-DM patients with similar levels of renal function. We observed poorer performance of the CKD-EPI equation in DM compared with non-DM individuals. A later study reported worse performance of the CKD-EPI equation in diabetic compared with non-diabetic subjects. 31 Another study also showed that the GFR, as estimated using the CKD-EPI and MDRD equations in diabetic patients, was estimated less accurately than in normal control subjects. 38 Guidelines suggest that the accuracy P30 should exceed 90%, but studies rarely achieve this value. Therefore, exploring improved equations suitable for patients with DM is urgently needed.
The specific characteristics of patients with DM, such as glomerular hyperfiltration, obesity and hyperglycemia, are associated with the predictive power of these equations. A prospective study that included 600 diabetic patients reported that the actual GFR was underestimated by some 20 to 50 mL/minute/1.73 m2 in 90 patients with hyperfiltration. 29 A European study found that Scr-based equations (i.e., the CKD-EPI, MDRD and Cockroft–Gault equations) lost their predictive value in patients with type 2 DM and BMI > 30 kg/m2. 39 Another study reported that Scr-based equations overestimated the GFR because of poor nocturnal glycemic control, as shown by comparing eGFR based on creatinine with sGFR at different levels of hyperglycemia. 40 Given the limitations of Scr as a GFR marker, alternative filtration markers may give better estimates of GFR. Furthermore, only 4.8% to 12.9% of DM patients with both albuminuria and renal dysfunction (eGFR < 60 mL/minute/1.73 m2) could be identified using various eGFR equations based on Scr. 41 The discordance between albuminuria and renal dysfunction demonstrated the importance of adding albuminuria to eGFR-based DKD staging systems. Because all filtration markers have non-GFR determinants, precision can be improved by using multiple markers to decrease the contribution of any one non-GFR determinant. 42
Our study had some limitations. Our study was not registered, which may have introduced small deviations, but we followed the steps recommended for systematic reviews diligently. The characteristics measured by the included studies included variables such as BMI, GFR and blood glucose. Given the recruitment methods, the generalizability of the individual studies remains unclear. Some studies have assessed the diagnostic performance of eGFR equations using statistical tools other than mean bias and P30. Thus, we recognize that excluding such studies from the meta-analysis could result in selection/reporting bias.
Conclusions
Our analyses showed a higher accuracy of the CKD-EPI equation in diabetic populations with higher GFR values. This finding is important for the secondary prevention of DKD progression. Because a large proportion of diabetic patients have higher clinically-measured GFR values, we recommend that the CKD-EPI equation be introduced into clinical practice to estimate GFR in patients with incipient DKD. Both the CKD-EPI and MDRD equations overestimated GFR at a sGFR < 90 mL/minute/1.73 m2, which may result in incorrect clinical staging of renal function. Furthermore, poor performance of the CKD-EPI equation was observed in DM patients compared with non-DM patients. Thus, users should be aware of the drawbacks of these equations, and further investigation is required for improving eGFR equations to make them suitable for diabetic populations. Equations that use other filtration markers including measurement of albuminuria and blood glucose levels instead of or in addition to creatinine, are promising approaches.
Footnotes
Declaration of conflicting interest
The authors declare that there is no conflict of interest.
Funding
This study was supported by the National Natural Sciences Foundation of China (No. 81200649), the Natural Sciences Foundation of Hubei Province of China (No. 2016CFB425), and Fundamental Research Funds for the Central University (No. 0118530324).