
Abstract
Accumulating evidence suggests that ectopic/visceral adiposity may play a key role in the pathogenesis of nonischaemic cardiovascular diseases associated with type 2 diabetes. Epicardial adipose tissue (EAT) is a complex visceral fat depot, covering 80% of the cardiac surface with anatomical and functional contiguity to the myocardium and coronary arteries. EAT interacts with the biology of the underlying myocardium by secreting a wide range of adipokines. Magnetic resonance imaging (MRI) is the reference modality for structural and functional imaging of the heart. The technique is now also emerging as the reference imaging modality for EAT quantification. With this narrative review, we (a) surveyed contemporary clinical studies that utilized cardiovascular MRI to characterize EAT (studies published 2010–2023); (b) listed the clinical trials monitoring the response to treatment in EAT size as well as myocardial functional and structural parameters and (c) discussed the potential pathophysiological role of EAT in the development of diabetic cardiomyopathy. We concluded that increased EAT quantity and its inflammatory phenotype correlate with early signs of left ventricle dysfunction and may have a role in the pathogenesis of cardiac disease in diabetes with and without coronary artery disease.
Introduction
Epicardial adipose tissue (EAT) is a complex endocrine organ that has been shown to have functions beyond thermogenesis and mechanical protection of the heart.1–3 EAT is part of the visceral adipose tissue (VAT), which is localized between the epicardium of the heart and the visceral layer of the pericardium. EAT surrounds approximately 80% of the cardiac surface with no fascia separating it from the myocardium and lies in close proximity to the coronary arteries.1,4,5
Adipose tissue is histologically classified into two types, brown adipose tissue (BAT) and white adipose tissue (WAT), which are visibly distinguishable based on tissue colour. EAT is a form of WAT but uniquely also has features of BAT, such as being composed of smaller adipocytes and expressing uncoupling protein 1 (UCP1).1,6 UCP1 is a mitochondrial protein dedicated to adaptive thermogenesis by stimulating high levels of fatty acid oxidation while uncoupling mitochondrial oxidation from ATP synthesis, thereby provoking energy dissipation as heat, a specialized function performed by BAT.7,8 Therefore, normal functioning BAT may protect against obesity and type 2 diabetes (T2D). 9 Patients with obesity have less BAT volume and heat loss via UCP1. 1 Furthermore, studies indicate that glucose uptake by BAT is reduced in T2D 10 and there is reduced expression of peroxisome proliferator-activated receptor-gamma coactivator-1alpha (PGC-1α) in the EAT of T2D patients with coronary artery disease (CAD), which is a key regulator of energy metabolism.6,11
The pathophysiological role of EAT can be attributed to the several bioactive products it secretes, collectively termed ‘adipokines’ that regulate vascular tone, inflammation, endothelial function and vascular smooth muscle migration.3,12 EAT contains macrophages and cluster differentiation 8 cells that influence local immune function. It has been seen that in healthy lean individuals, there is a predominance of the anti-inflammatory phenotype of macrophages, which can switch to being pro-inflammatory in obesity and other metabolic conditions. 13 Yang et al. 14 demonstrated differential gene expression in people with T2D with higher expression of genes associated with inflammation and cytokines. It has also been speculated that by altering the inflammatory response and cytokine activity in EAT, diabetes predisposes patients to detrimental cardiovascular effects. 14
EAT has dichotomous functional characteristics, both adverse and protective, interacting locally with the coronary arteries and the myocardium through paracrine and vasocrine pathways. Under physiological conditions, EAT exerts a protective effect on the coronary arteries and supplies heat to the myocardium.15,16 Its pathological increase and the coexistence of other metabolic and haemodynamic abnormalities turn it into an adverse lipotoxic, prothrombotic and pro-inflammatory organ.17,18 Under physiological conditions, processes within the EAT serve as protective forces; however, in metabolically diseased states, EAT is infiltrated by inflammatory cells, leading to translational changes within the tissue and tipping the scales towards a pro-inflammatory and pro-fibrotic phenotype of EAT.2,19,20
Figure 1 summarizes the physiological and pathological role of EAT in relation to the heart.

(a) Schematic representation of EAT function. (b) Intermodulation of EAT and cardiac tissue.
EAT and cardiovascular disease
Prior systematic reviews and meta-analyses have addressed the potential role of EAT in the pathophysiology of several cardiovascular conditions, including ischaemic heart disease,21,22 atrial fibrillation23,24 and heart failure with preserved ejection fraction. 25 Patients with CAD were shown to have higher levels of reactive oxygen species in the EAT than patients without CAD. 26 Whether this is a cause or consequence of CAD or other cardiac pathology remains to be elucidated. However, suggesting a potential causal relationship, endothelial microparticles carrying microRNAs have been shown to contribute to atherosclerosis by causing inflammation in perivascular adipose tissue, which is a form of EAT in close proximity to coronary arteries. 27 Moreover, BAT-specific genes such as UCP-1, PGC-1α, bone morphogenetic protein 7 and PR/SET domain 16 were found to be lower in EAT from patients with CAD than in EAT from those without CAD. 26 These findings were interpreted as a transition of brown features of EAT to white or beige features in the presence of CAD. Furthermore, adipocyte infiltration of the atrial myocardium and inflammatory cytokines from the neighbouring EAT were shown to contribute to the development of atrial fibrillation.28,29
EAT in diabetes and obesity
Heart failure is the leading cardiovascular complication of diabetes. Key manifestations of myocardial disease in patients with diabetes include mitochondrial dysfunction, impaired mitochondrial calcium (Ca2+) handling, excess inflammation, diffuse myocardial fibrosis, cardiac hypertrophy, microangiopathy and abnormal cardiac metabolism.30,31 While multiple studies also suggest that EAT alterations may play a significant mechanistic role in the pathophysiology of myocardial disease in patients with diabetes, there is a paucity of systematic or narrative reviews summarizing the findings of these studies.
Several cardiovascular imaging studies have established significantly increased EAT area/volume in patients with T2D.18,32–35 VAT accumulation may be one of the main underlying factors for developing insulin resistance, and insulin resistance syndrome due to obesity may be the first pathological stage in the long-lasting asymptomatic period of T2D.1,36 Studies using invasive EAT biopsies and histological tissue assessments suggest that in metabolic disease states such as T2D and obesity, a shift between anti-inflammatory and pro-inflammatory adipocytokines within the EAT occurs, with this imbalance predisposing to chronic, low-grade inflammation, which may contribute to the development of cardiovascular disease. 14
Moreover, the adipose tissue expandability hypothesis states that adipocytes have a maximum capacity and that over-expansion of adipocytes can lead to hypoxia and inappropriate fat storage. Hypoxia within adipose tissue, in turn, can lead to adipocyte insulin resistance through inhibition of insulin receptor tyrosine phosphorylation and decreased glucose transport. 37 Failure to store fat effectively increases dyslipidaemia and ectopic fat deposition in tissues such as the skeletal muscle and liver, which further impairs insulin signalling in conditions such as T2D and obesity. 38
Imaging of EAT
EAT can be assessed, and different types of VAT can be differentiated using imaging techniques such as echocardiography, computed tomography (CT) and magnetic resonance imaging (MRI) (Figures 2 and 3).
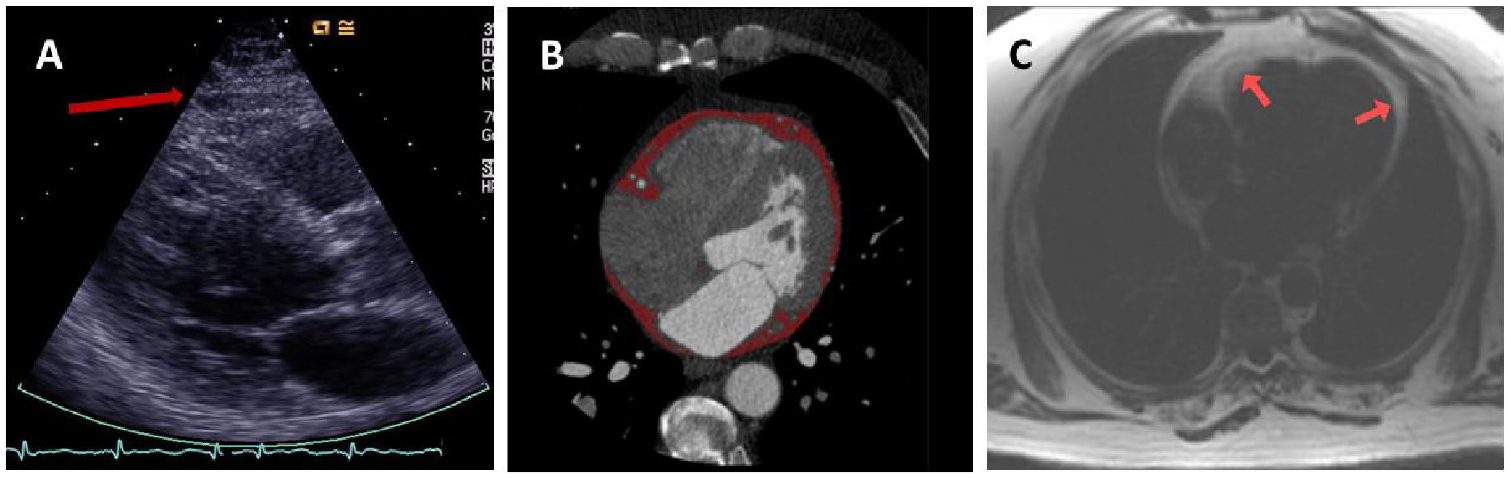
(a) Imaging of EAT by echocardiography. (b) Cardiac computed tomography 18 (reproduced with permission). (c) Cardiovascular magnetic resonance imaging.

Example of manual contouring of the EAT area. A linear hypointensity enables the differentiation of EAT from pericardial adipose tissue. The area is measured with the atrioventricular junction as limits. The contours are manually drawn in all slices, and a cumulative area is expressed as the final quantity.
Transthoracic echocardiography is an inexpensive, easily available and time-efficient modality for visualizing EAT and measuring its localized thickness. 39 CT and cardiovascular MRI techniques have also been utilized to image EAT and offer the advantage over echocardiography of providing volumetric evaluation of EAT. Several systematic reviews have ascertained the utility of CT techniques in assessing EAT quantification and its impact on or association with the development of cardiac disease, especially CAD.40,22 Cardiovascular MRI is now considered the reference modality for adipose tissue evaluation, including the EAT 41 and provides a reproducible assessment of EAT volume 42 as well as being the best diagnostic imaging modality for reproducible assessment of cardiac volumes, mass and function. 43 Additionally, cardiovascular MRI has been effectively used to detect subtle early-onset cardiac changes in patients with diabetes, such as alterations in myocardial strain, perfusion and myocardial lipid accumulation. 30 The detection of subclinical dysfunction is a marker of heart failure risk and presents a potential target for reducing incident heart failure in patients with T2D. 44 For the assessment of metabolic imaging biomarkers, magnetic resonance spectroscopy (MRS) has been utilized in many patients with diabetes. Proton ( 1 H)-MRS allows for the non-invasive measurement of cardiac triglyceride content. Using this non-invasive technique, myocardial triglyceride content is increased 1.5- to 2.3-fold in patients with T2D.45–47 Consequently, with its clear superiority for assessment of cardiomyopathy as the reference test, 48 its ability to detect ischaemia associated with CAD49,50 and an added advantage of metabolic assessment, cardiovascular MRI is an obvious one-stop shop for conveniently studying EAT characteristics and their impact on the heart. This narrative review focuses on the currently available evidence from studies that utilized cardiac MRI as the primary imaging tool in examining the role of EAT in T2D.
MRI assessment of EAT
Various methods and pulse sequences have been used to evaluate EAT, which is usually measured either as area or volume. These MRI sequences included dark blood prepared T1-weighted multi-slice turbo spin–echo pulse sequence with a water suppression pre-pulse, 3D-mDixon sequence, standard balanced steady-state-free precession (b-SSFP) cardiovascular MRI and multi-echo gradient echo sequence to acquire water/fat images. As examples of these MRI studies, Flüchter et al., 51 in 2007, used dark blood prepared T1-weighted multi-slice turbo spin–echo pulse sequence with water suppression prepulse for acquisition and contoured EAT in end-diastolic short axis images covering the whole of left (LV) and right ventricles (RV). Homsi et al. 52 assessed EAT using a 3D-mDixon sequence to acquire the images and subsequently analysed the EAT volume offline using MATLAB (MathWorks Inc., Natick, MA, USA). This method allowed volume quantification of EAT and required relatively little time per analysis. The authors suggested that this 3D-Dixon sequence could be easily integrated into any routine workflow. 52 Furthermore, b-SSFP cardiovascular MRI was used by Leo et al. to evaluate EAT characteristics in detail. This sequence allowed a clear distinction of adipose tissue from myocardium, blood and other surrounding muscles. 42 Chowdhary et al. 32 used multi-echo gradient echo cardiovascular MRI acquisition to acquire water/fat images allowing measurement of EAT area with a clear definition of the adipose tissue borders.
To overcome the time-consuming nature of manual EAT segmentation, semiautomated and fully automated artificial intelligence (AI)-based programmes have been developed.53,54 Currently used manual methods to contour EAT may take up to 13 min by an expert cardiologist, whereas this is reduced to 5 min by automated methods. 55
Purpose
We aimed to close the gap in the literature of reviews summarizing the latest evidence on the utility of cardiovascular MRI in assessing the association of EAT quantification with ischaemic as well as nonischaemic myocardial disease in patients with T2D.
Methods
Search selection criteria and strategy
Studies investigating EAT characteristics and associations in participants with T2D were reviewed. MEDLINE was systematically searched using the keywords ‘epicardial fat’, ‘EAT’ and ‘diabetes’. Recent systematic reviews56–60 (covering the period of the last 5 years, between 2018 and 2023) were screened for relevant studies. The following inclusion criteria were used:
Studies that included participants with T2D as their primary study group or provided results specific to the T2D group.
Studies that utilized cardiac magnetic resonance (CMR) for quantitative measurement of EAT.
Studies that specifically assessed the relationship of EAT with cardiac function.
Search results
The study identification and selection are demonstrated in the flow diagram in Figure 4. The search was performed by a single operator (SK). The search generated 935 publications. A total of 348 duplicates were identified and excluded. Reviews, editorials, comments and responses to comments amounted to 130 publications. Eligible participants were adult patients with T2D. After reviewing the abstracts, studies that did not include patients with T2D or did not classify results for this group were excluded (n = 128). Studies that utilized modalities other than CMR, such as echocardiography, cardiac CT and positron emission tomography (PET), totalled 200 publications. Preclinical, histopathological and biochemical studies were excluded (n = 96). Eventually, 23 publications that met the inclusion criteria were included in this review (Figure 4). The description of these studies was divided into (1) observational, (2) methodological, (3) clinical trials and (4) other interventions.

PRISMA (Preferred Reporting Items for Systematic Reviews and Meta-Analyses) flow diagram.
Unique studies were identified by the first authors of associated publications. Patient characteristics of the studies included in this review are summarized in Tables 1 and 2. The interventional study methodologies were assessed for quality by a single operator (SK) (Supplemental Table 1).
Observational studies that assessed EAT by MRI.
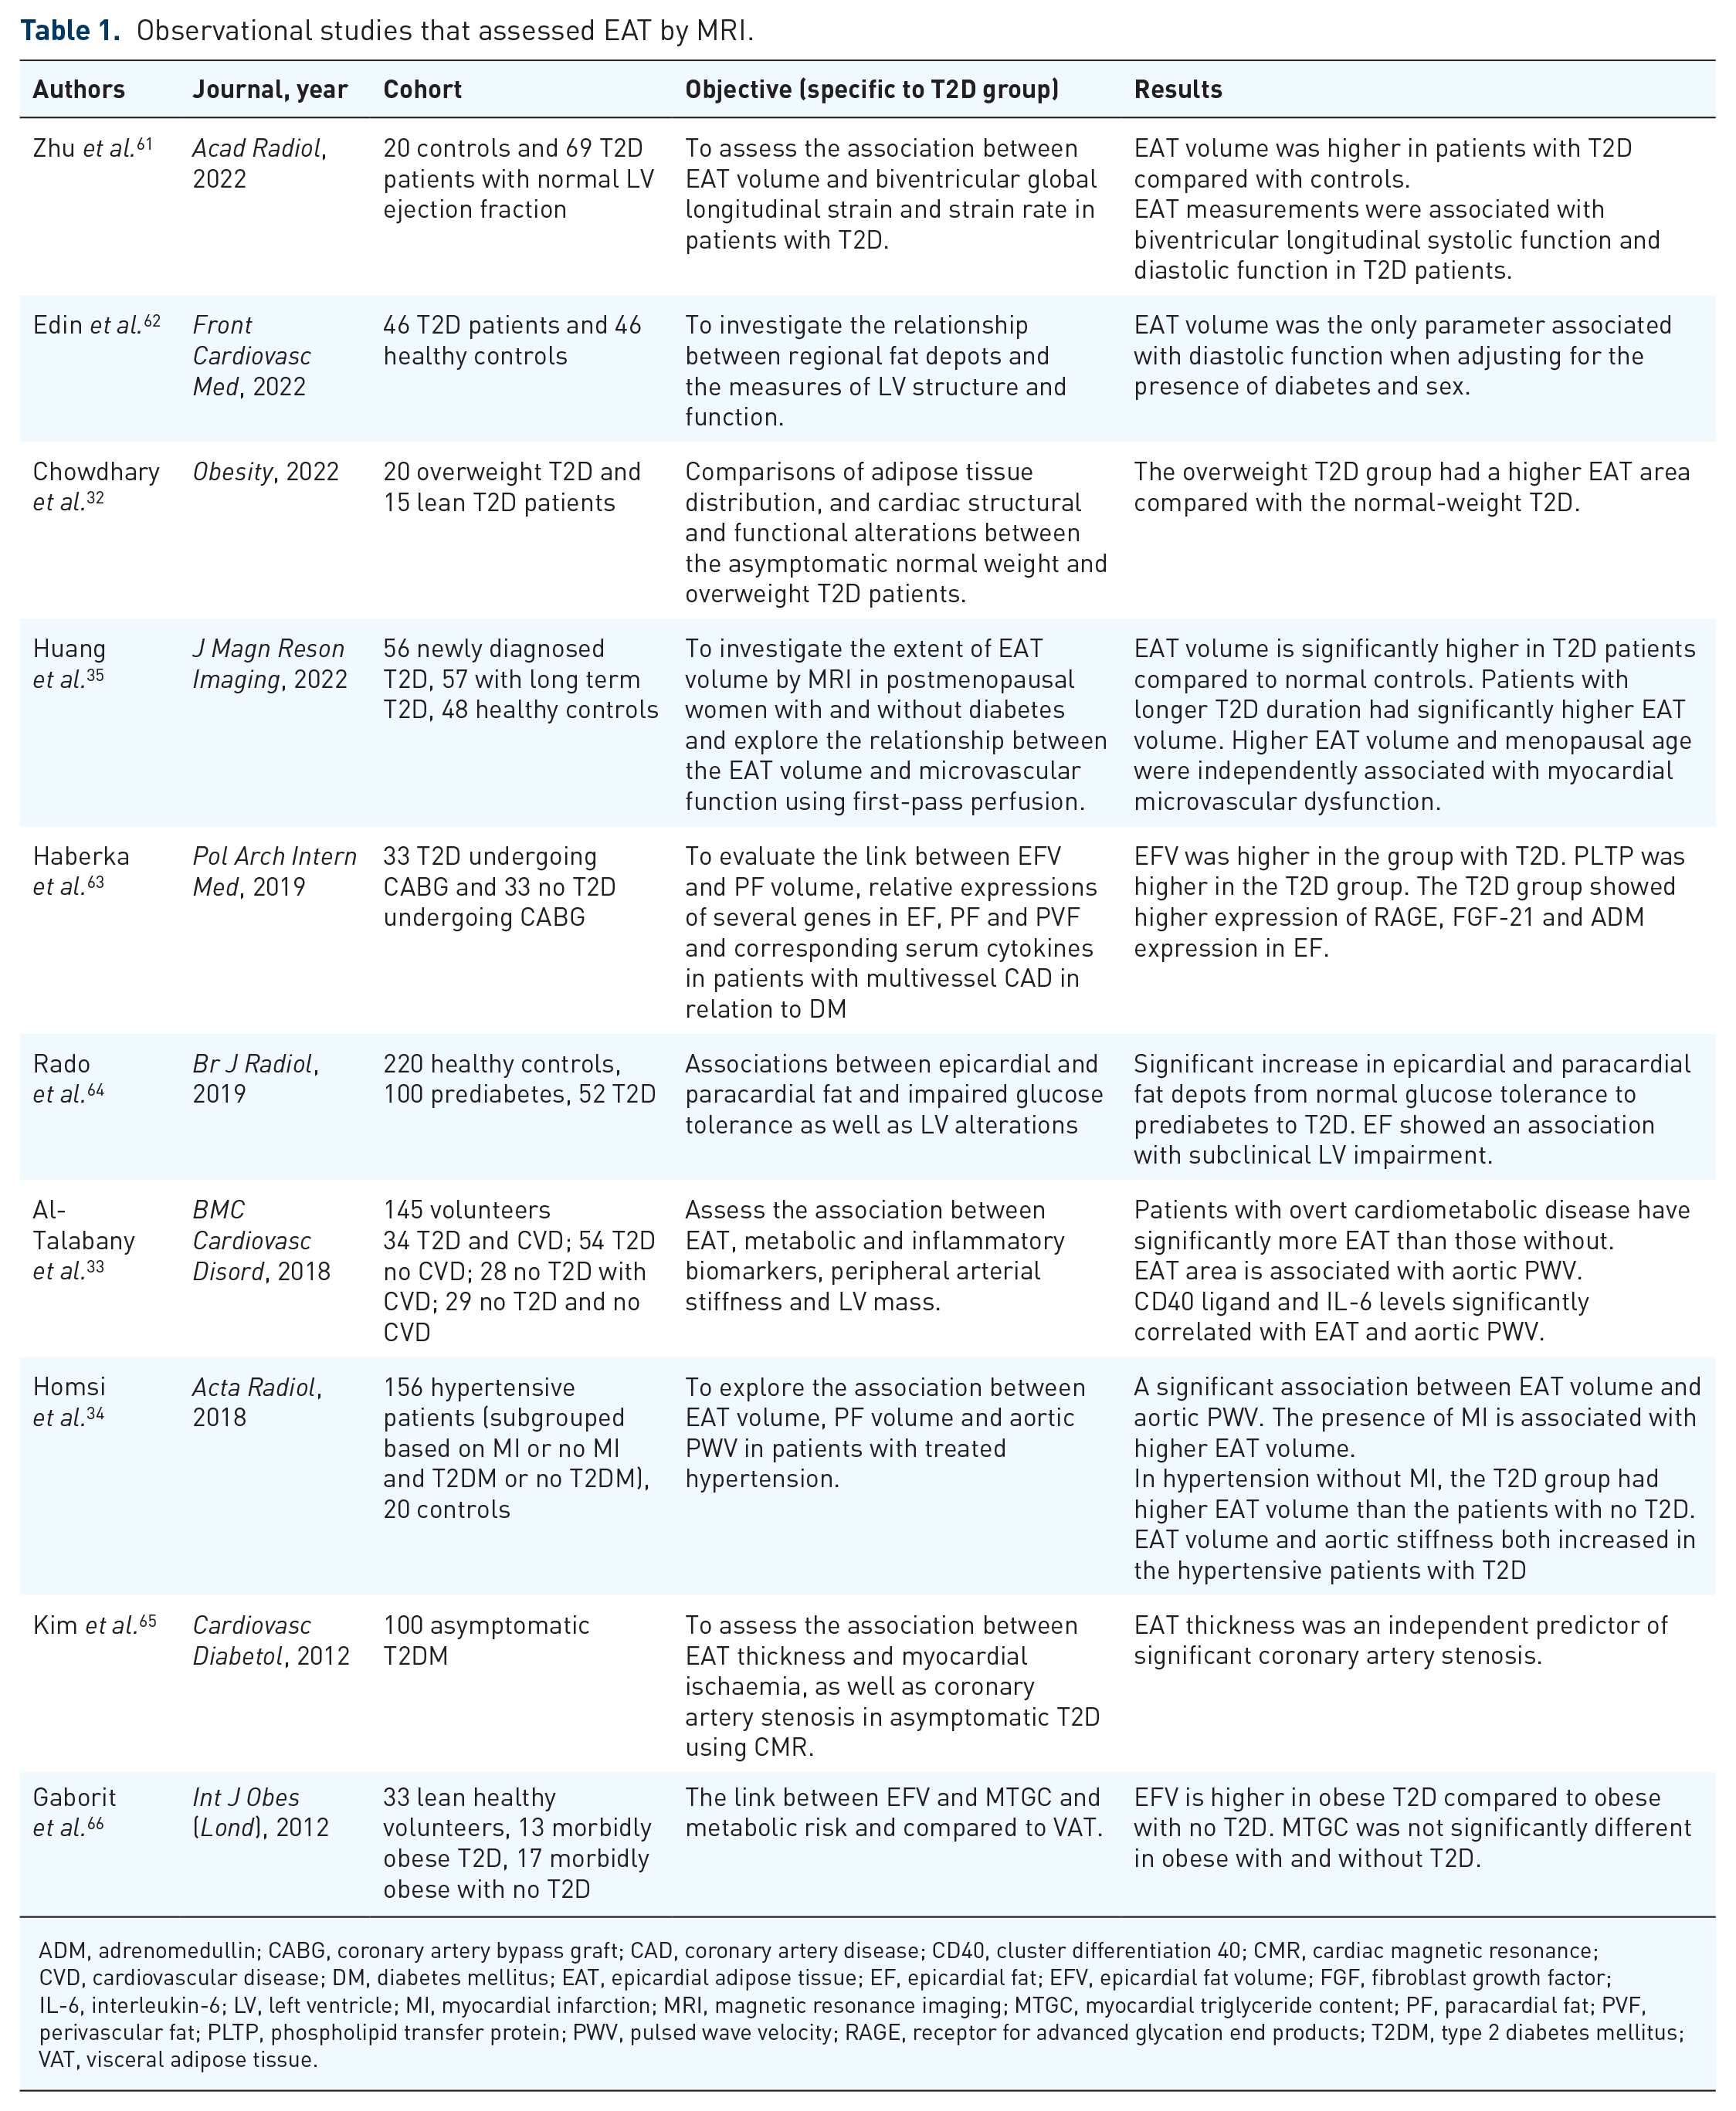
ADM, adrenomedullin; CABG, coronary artery bypass graft; CAD, coronary artery disease; CD40, cluster differentiation 40; CMR, cardiac magnetic resonance; CVD, cardiovascular disease; DM, diabetes mellitus; EAT, epicardial adipose tissue; EF, epicardial fat; EFV, epicardial fat volume; FGF, fibroblast growth factor; IL-6, interleukin-6; LV, left ventricle; MI, myocardial infarction; MRI, magnetic resonance imaging; MTGC, myocardial triglyceride content; PF, paracardial fat; PVF, perivascular fat; PLTP, phospholipid transfer protein; PWV, pulsed wave velocity; RAGE, receptor for advanced glycation end products; T2DM, type 2 diabetes mellitus; VAT, visceral adipose tissue.
Interventional studies.

BMI, body mass index; 4Ch, 4 chamber; EAT, epicardial adipose tissue; FCN, fully convolutional network; LA, left atrium; MRI, magnetic resonance imaging; PAT, pericardial adipose tissue; T2D, type 2 diabetes.
Observational studies
Multiple studies have demonstrated significantly increased EAT area or volume in patients with T2D.18,32–35,66 Al-Talabany et al. 33 demonstrated in their study of 145 patients (subdivided into four groups based on the presence of T2D and CAD) that the EAT area was significantly associated with arterial stiffness. They also showed that inflammatory markers such as cluster differentiation 40 ligand and interleukin-6 were significantly correlated with EAT volume and aortic pulse wave velocity. 33 This was supported by Homsi et al. 34 in their study of 156 patients with treated hypertension versus 20 controls. The patients were subdivided based on whether they had prior myocardial infarction and/or T2D. The EAT volume and aortic stiffness were significantly higher in those with T2D. 34 Huang et al. conducted a study on 161 postmenopausal women, of whom 56 had newly diagnosed T2D, 57 had long-term T2D and 48 were healthy controls. In addition to the increased EAT volume in both T2D groups (newly diagnosed and chronic T2D) compared to healthy controls, they also showed that increased EAT volume was independently associated with coronary microvascular dysfunction. 35
A retrospective, single-centre study by Kim et al. 65 of 100 asymptomatic patients with T2D showed that EAT thickness was significantly higher in those with significant CAD (defined as a signal reduction or stenosis >50% on CMR angiography) than in those without. They concluded that EAT thickness was an independent predictor of significant CAD. 65
With regard to the studies that assessed the association of EAT with LV parameters, Edin et al., 62 in their study of 46 patients with T2D and 46 matched healthy controls, showed that the impairment of diastolic function was related to higher EAT volumes. Furthermore, Zhu et al. demonstrated a negative correlation of EAT volume with LV global longitudinal strain (GLS), LV longitudinal strain rate, RVGLS and RV longitudinal strain rate in patients with T2D. Rado et al. 64 explored the association of EAT area with subclinical LV impairment (combined endpoint based on LV concentricity index, amount of scar assessed by late gadolinium enhancement and LV ejection fraction) in a study that included patients with prediabetes, established T2D and healthy controls. They concluded that EAT area remained significantly associated with subclinical LV impairment even after adjustment for age, sex, smoking, hypertension, low-density lipoprotein, T2D and VAT.
Haberka et al. 63 in a single-centre cross-sectional study that included 66 participants who were undergoing coronary artery bypass grafting surgery for multivessel CAD (33 with T2D and 33 without T2D) combined imaging and histological analysis to characterize T2D-associated changes in EAT. This study also concluded that T2D is associated with higher EAT volume on imaging. In addition, they showed reduced messenger ribonucleic acid (mRNA) expression of fibroblast growth factor 21 (cardioprotective) and increased mRNA expression of pro-adrenomedullin (cardioprotective in ischaemia/reperfusion injury) and receptor for advanced glycation end products (involved in inflammatory processes and metabolic dysfunction) in EAT. 63
Table 1 summarizes the observational studies and includes their key objectives and results.
Methodological studies
Two studies presented novel MRI techniques to assess EAT quantification. Daudé et al. 53 employed fully convolutional networks that were used for cardiac volume segmentation techniques to measure the EAT area on horizontal long-axis four-chamber cine MRI multi-frame images. This approach was developed to overcome interobserver variability and shorten the time-consuming nature of manual analysis. 53
Evin et al. 54 developed a novel method to assess LA strain by feature tracking and used the two-point Dixon technique to measure epicardial fat. They assessed left atrial strain utilizing feature tracking. In this study, EAT and intramyocardial fat were separately measured following segmentation of the Dixon data into fat and water images. A semiautomatic method was applied for EAT quantification. 54
Table 2 summarizes the two studies and includes their key objectives and results.
Pharmaceutical clinical trials targeting EAT
Several interventional studies have used novel diabetes therapies for pharmacological modulation of the EAT. Overall, the evidence from the studies included in this review showed conflicting results for the effects of these drugs on the quantitative measures of EAT. Among the studies that used sodium–glucose cotransporter-2 (SGLT2) inhibitors, Gaborit et al. 67 found that empagliflozin led to weight loss and reduced liver fat but had no effect on the EAT volume or myocardial fat content as measured by CMR and 1 H-MRS, respectively. By contrast, Bouchi et al. 68 in their study of 19 T2D patients found that another SGLT2 inhibitor, luseogliflozin, reduced EAT volume but had no effect on hepatic fat accumulation. They further showed that EAT volume reduction was associated with the improvement of systemic microinflammation and reduction in body weight. 68 A reduction in EAT volume was also shown by Fukuda et al. 69 in their study of nine T2D patients with increased VAT area (⩾100 cm2).
A further group of studies used glucagon-like peptide 1 receptor agonists (GLP1-RA). The effect of exenatide was studied by Dutour et al., 70 who showed that exenatide was an effective treatment to reduce liver fat content and EAT in patients with T2D and obesity and that these effects were mainly weight-loss dependent. A double-blind, placebo-controlled trial by van Eyk et al. 71 showed that liraglutide reduced VAT, but other adipose tissue compartments, including EAT, were not changed by liraglutide treatment. Supporting this observation, another placebo-controlled randomized trial with liraglutide showed no effect on EAT volume. 72 However, contradicting these findings, Zhao et al. 73 showed a statistically significant reduction in EAT thickness after 3 months of treatment with liraglutide.
A potent PPAR-γ (peroxisome proliferator activator receptor-γ) agonist pioglitazone was another glucose-lowering drug that was studied for its effects on EAT in a small case–control study of 12 T2D patients versus 12 healthy controls by Moody et al. 74 They demonstrated that pioglitazone reduces the EAT volume and that the reduction in EAT size is associated with an improvement in insulin sensitivity. 74
Among the nondiabetic drugs studied, Fiore et al. 75 assessed the effect of the phosphodiesterase-5 inhibitor sildenafil on EAT volume and inflammatory marker expression in 59 patients with T2D. This study found that sildenafil treatment is associated with reductions in EAT volume in T2D. 75
Table 3 shows the list of interventional studies that aim to modify EAT.
Drug interventional studies.
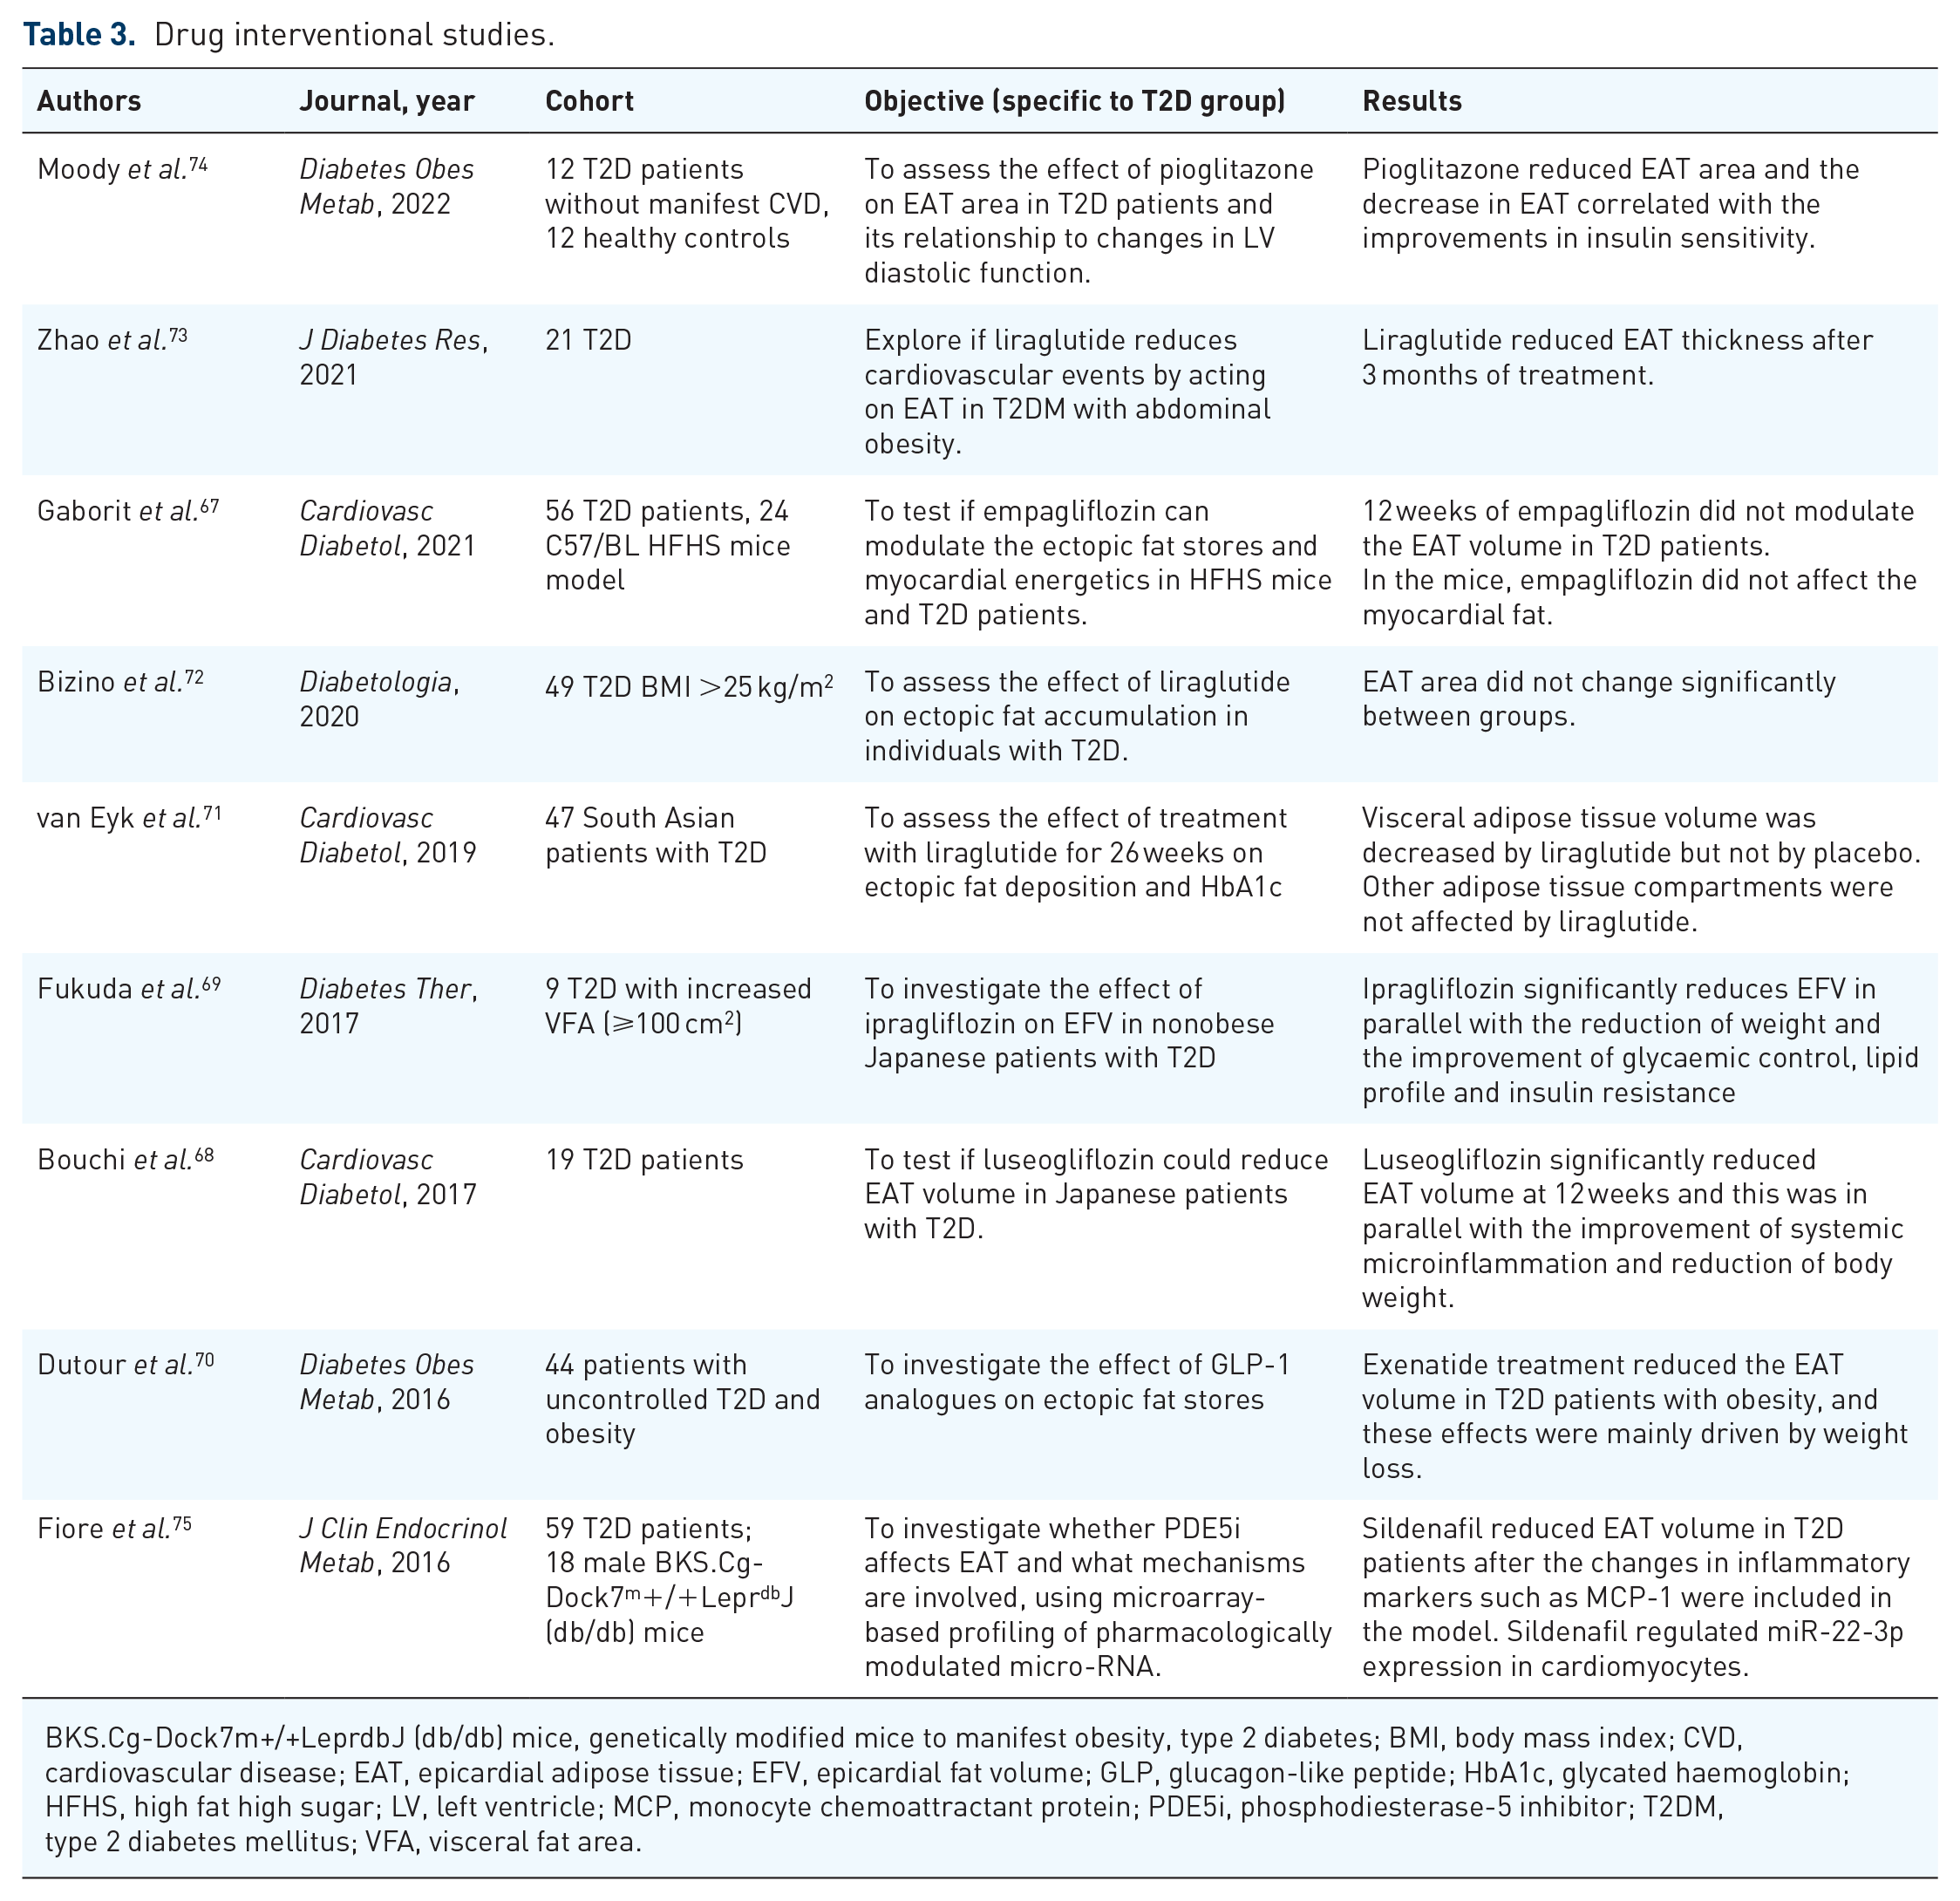
BKS.Cg-Dock7m+/+LeprdbJ (db/db) mice, genetically modified mice to manifest obesity, type 2 diabetes; BMI, body mass index; CVD, cardiovascular disease; EAT, epicardial adipose tissue; EFV, epicardial fat volume; GLP, glucagon-like peptide; HbA1c, glycated haemoglobin; HFHS, high fat high sugar; LV, left ventricle; MCP, monocyte chemoattractant protein; PDE5i, phosphodiesterase-5 inhibitor; T2DM, type 2 diabetes mellitus; VFA, visceral fat area.
Nonpharmaceutical interventions targeting EAT
Nonpharmaceutical interventions targeting EAT included gastric bypass surgery and exercise training. Van Schinkel et al. studied the effects of bariatric surgery on ectopic adipose tissue deposition. In addition to EAT volume, they also measured paracardial fat volume, which is brown mediastinal adipose tissue located external to the parietal pericardium and contiguous with perivascular aortic adipose tissue. They found that Roux-en-Y gastric bypass surgery caused a substantial reduction in EAT volume at the 16-week follow-up and that there was a higher proportional decrease in paracardial volume as opposed to EAT volume. 76
To investigate the effects of exercise, Jonker et al. conducted a prospective cohort study of 12 patients with T2D evaluating the effects of a 6-month individualized exercise training regimen. They showed that exercise reduced the paracardial fat but did not have any effect on EAT volume or intramyocardial triglyceride content. 77
Table 4 summarizes the two interventional studies and their key objectives and results.
Other interventional studies.

EAT, epicardial adipose tissue; EFV, epicardial fat volume; PF, paracardial fat; RYGB, Roux-en-Y gastric bypass; T2D, type 2 diabetes; TG, triglyceride.
Discussion
In summary, this narrative review demonstrated that there are a significant number of contemporary studies that have focused on phenotyping EAT by MRI technology in patients with T2D, while assessments of changes in EAT quantity are not yet widely used as a surrogate endpoint for clinical trials. There are significant inconsistencies in terms of the MRI pulse sequence and analysis methodology used by the observational studies evaluating EAT characteristics, which limits the generalization of their findings and the promotion of MRI-assessed EAT quantity as an imaging biomarker for future clinical trials. Nevertheless, there is consistent evidence from imaging studies, as well as histopathological studies, that EAT may play a significant role in the diabetic cardiomyopathy process. As a result, agreement on specific standards for the MRI evaluation of the EAT quantity, such as the most reproducible pulse sequence and postprocessing technique, is required to ensure consistent quality of these assessments and validation of MRI-assessed EAT quantity as a useful imaging biomarker for multicentre large clinical studies.
Limitations and strengths
This narrative review aimed to summarize the available evidence on the EAT phenotype in diabetic heart disease and interventional studies that target EAT size in patients with T2D. The MEDLINE electronic archive was systematically searched. The literature search terms were kept relatively broad, and the review was updated regularly to reduce the probability of omission of relevant studies. The included studies assessed sufficiently similar cohorts of patients on account of physiological or clinical characteristics and comorbid factors, making their results comparable. The included clinical trials were scrutinized for their quality (Supplemental Table 1).
While MEDLINE is a very large and regularly updated archive, we have not used EMBASE or searched for conference abstracts. Therefore, there remains a theoretical risk of omission of a small number of studies that were only included in EMBASE or recent conference papers. Although methods of a systematic review were followed, it has been presented as a narrative review as data extraction of relevant studies for the review was conducted by a single operator (SK) and prior registration of systematic review was not done.
Conclusion and future directions
EAT quantity and metabolic characteristics have emerged as important factors implicated in the development and modulation of not only obstructive CAD but also nonischaemic diabetic cardiomyopathy. EAT quantities correlate with early signs of left ventricular dysfunction in patients with T2D. Moreover, there is evidence that genetic and molecular changes in EAT may appear before any obvious clinically apparent measure of cardiac dysfunction in this population.
Larger-scale randomized controlled trials are required to confirm the effect of SGLT2 inhibitors and GLP1-RA treatments, which have already been shown to have several other favourable effects on cardiac physiology, on EAT remodelling. Furthermore, early histological studies have suggested potential genetic and molecular targets that can potentially be modified to promote the favourable effects of EAT on the heart.
Finally, AI algorithms are exceedingly being used in often time-consuming cardiovascular imaging tasks, including image segmentation, detection of pathologies and patient selection. AI algorithms have the potential to improve the robustness of information extracted from cardiac images. AI-powered imaging data analysis has reached human-level or above human-level performance in many applications with the efficiency of modern machine learning methods such as deep learning using convolutional neural networks. While not specifically used for EAT quantification, AI technology has been implemented in the population-based UK Biobank cohort study dataset by Ardissino et al. 78 for quantification of pericardial adipose tissue. Such large-scale studies are also necessary to validate and standardize EAT quantification by cardiovascular MRI to enable robust and statistically strong associations between EAT and cardiovascular health.
Supplemental Material
sj-docx-1-tae-10.1177_20420188241229540 – Supplemental material for Role of epicardial adipose tissue in diabetic cardiomyopathy through the lens of cardiovascular magnetic resonance imaging – a narrative review
Supplemental material, sj-docx-1-tae-10.1177_20420188241229540 for Role of epicardial adipose tissue in diabetic cardiomyopathy through the lens of cardiovascular magnetic resonance imaging – a narrative review by Sindhoora Kotha, Sven Plein, John P. Greenwood and Eylem Levelt in Therapeutic Advances in Endocrinology and Metabolism
Footnotes
References
Supplementary Material
Please find the following supplemental material available below.
For Open Access articles published under a Creative Commons License, all supplemental material carries the same license as the article it is associated with.
For non-Open Access articles published, all supplemental material carries a non-exclusive license, and permission requests for re-use of supplemental material or any part of supplemental material shall be sent directly to the copyright owner as specified in the copyright notice associated with the article.