
Abstract
Objectives
A retrospective study to investigate the relationship between epicardial adipose tissue thickness (EATT) and presence of coronary artery plaque, coronary artery disease (CAD) and CAD risk factors.
Methods
Multidetector computed tomography (MDCT) coronary angiography images were reviewed. Left anterior decending artery, right coronary artery and left circumflex artery pericoronary EATT were measured. Demographic, clinical and CAD risk factor data were obtained from medical records.
Results
Patients with CAD (n = 49) had significantly larger mean EATT than those without CAD (n = 101). Pericoronary EATT was significantly correlated with body mass index, total cholesterol level, coronary artery calcium score, hypertension and diabetes mellitus history.
Conclusions
There is an association between pericoronary EATT and CAD, as well as CAD risk factors. Pericoronary EATT measurement may become a widely used, easy-to-perform method for determining CAD risk.
Introduction
Coronary artery disease (CAD) is characterized by myocardial ischaemia due to atheromatous plaque accumulation in the coronary arteries and is the primary cause of adult deaths in developed countries. CAD is a pathological process; several years can pass between disease initiation and the development of myocardial dysfunction. The worldwide CAD mortality rate is expected to rise from 28.9% in the 1990s to an estimated 36.3% in the 2020s. 1
Multiple risk factors (including sex, age, smoking, hypertension, hyperlipidaemia, body mass index, family history of CAD and diabetes mellitus)2,3 are associated with the prevalence, incidence and progression of CAD, and the correction of these risk factors results in a 50% decrease in the incidence of cardiovascular death. 4 The identification and treatment of plaques – before they narrow the coronary artery lumen or cause acute coronary syndrome – can halt and possibly even reverse the progression of CAD, returning the plaques to a stable form.1,4–7
Epicardial adipose tissue (EAT) fills the area between the pericardium and the myocardium, and has the same embryologic origin as intra-abdominal adipose tissue. 8 Regional adiposity is known to play an important role in the development of cardiovascular disease.2,9 EAT secretes proinflammatory cytokines2,10–13 that have been shown to play an important role in the development of CAD. 9–12,14,15
The aim of the present study was to investigate the relationship between EAT thickness (EATT) and the presence of coronary artery plaques, CAD and CAD risk factors.
Patients and methods
Study population
This retrospective study included consecutive patients who underwent multidetector computed tomography (MDCT) coronary angiography at the Department of Radiology, School of Medicine, Fırat University, Elazig, Turkey between January 2008 and June 2010. Clinical data, laboratory findings, major risk factors for coronary artery disease and MDCT images were obtained from patient records. Exclusion criteria were images of suboptimal quality and those patients who underwent coronary interventions such as stent placement or bypass surgery. Additionally, patients with congenital heart disease and coronary artery anomalies were excluded from the study.
The study was approved by the ethics committee of Fırat University School of Medicine, Elazig, Turkey. All patients provided written informed consent.
MDCT
Examinations were performed with a 64-detector MDCT (Aquilion™; Toshiba Medical Systems, Tokyo, Japan). Patients were informed about the necessity of holding their breath and avoiding movement before the start of the examination, to shorten the scan duration and ensure patient compliance. Patients were given 5 mg isosorbide dinitrate (sublingual) 2–4 min before image acquisition in order to dilate the coronary arteries. Patients with heart rate >70 bpm received 5 mg metoprolol tartrate (intravenous) until their heart rate reached <70 bpm (maximum dose 10 mg). Upper and lower scanning limits were determined by obtaining anteroposterior and lateral scanograms at the beginning of the examination. Images without contrast were obtained for calculating calcium scores.
Heart rate and ECG traces were recorded retrospectively during scanning, for segmental reconstruction. A region of interest (ROI) was placed in the aortic root, and 70 ml nonionic contrast medium
All MDCT images were transferred to a workstation running Vitrea 2® software (Vital Images, Minnetonka, MN, USA). Reconstruction images were created in the percentile where the least movement occurred and image evaluations were performed in the region where each of the coronary arteries had the fewest artefacts. Coronary artery plaques were classified morphologically as soft, calcified or mixed. Arterial narrowing was classified as mild (0–49%), moderate (50–74%) or severe (75–99%). Pericoronary EATT was measured at the thickest region, which extended perpendicular to the heart from the left anterior decending artery (LAD), right coronary artery (RCA) and left circumflex artery (LCX) in the axial images. EATT was not measured obliquely to the vessel diameter (Figure 1). All EATT measurements were made by an experienced radiologist (A.M.A.)
Axial multidetector computed tomography image indicating the measurement of pericoronary epicardial adipose tissue in the region of the right coronary artery.
Study definitions
Coronary artery disease was defined as the presence of at least one coronary artery plaque, as determined by MDCT.13,16,17 Hypertension was defined as systolic blood pressure ≥140 mmHg, diastolic blood pressure ≥90 mmHg, or treatment with an antihypertensive agent. Diabetes mellitus was defined as fasting plasma glucose ≥6.93 mmol/l or treatment with a hypoglycaemic agent and/or insulin. Hypercholesterolaemia was defined as total cholesterol level >5.18 mmol/l, low-density lipoprotein cholesterol (LDL-C) level >3.4 mmol/l or use of a cholesterol-lowering agent. Patients were classified according to body mass index (BMI) as normal (18.5–24.9 kg/m2), overweight (25–29.9 kg/m2), or obese (30–39.9 kg/m2). Agatston’s calcium scoring system was used to evaluate coronary artery calcium levels. 18
Statistical analyses
Data were presented as mean ± SD or n (%) and analysed using Student’s t-test, χ2-test or one-way analysis of variance with post hoc Tukey’s test. Regression analysis was performed to analyse the level of significance of risk factors and between-group relationships. Statistical analyses were performed using SPSS® version 22.0 (SPSS Inc., Chicago, IL, USA) for Windows®. P-values < 0.05 were considered statistically significant.
Results
Clinical characteristics of patients who underwent multidetector computed tomography coronary angiography, included in a study investigating the relationship between coronary artery disease (CAD) and pericoronary epicardial adipose tissue thickness, stratified according to presence or absence of CAD.

Data presented as n (%) or mean ± SD.
Student’s t-test or χ2-test.
NS, not statistically significant (P ≥ 0.05); LDL-C, low-density lipoprotein cholesterol; BMI, body mass index.
Hypertension, systolic blood pressure ≥140 mmHg, diastolic blood pressure ≥90 mmHg, or treatment with an antihypertensive agent.
Diabetes mellitus: fasting plasma glucose ≥6.93 mmol/l or treatment with a hypoglycaemic agent and/or insulin.
Relationships between mean pericoronary epicardial adipose tissue thickness and clinical characteristics in patients who underwent multidetector computed tomography coronary angiography (n = 150).

Data presented as n (%) or mean ± SD.
One-way analysis of variance, Tukey’s test.
NS, not statistically significant (P ≥ 0.05); LDL-C, low-density lipoprotein cholesterol; BMI, body mass index.
High total cholesterol, > 5.18 mmol/l.
High LDL-C, > 3.4 mmol/l.
BMI: normal, 18.5–24.9 kg/m2; overweight 25–29.9 kg/m2; obese 30–39.9 kg/m2.
Hypertension, systolic blood pressure ≥140 mmHg, diastolic blood pressure ≥90 mmHg, or treatment with an antihypertensive agent.
Diabetes mellitus: fasting plasma glucose ≥6.93 mmol/l or treatment with a hypoglycaemic agent and/or insulin.
Pericoronary epicardial adipose tissue thickness (mm) of the three coronary arteries in patients who underwent multidetector computed tomography coronary angiography (n = 150).
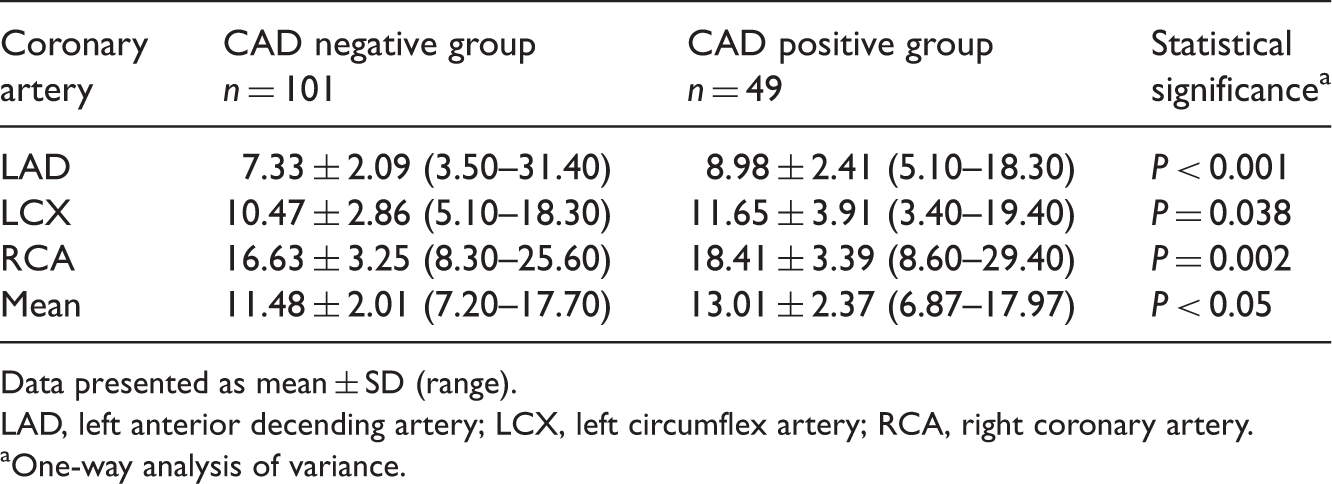
Data presented as mean ± SD (range).
LAD, left anterior decending artery; LCX, left circumflex artery; RCA, right coronary artery.
One-way analysis of variance.
Relationship between mean pericoronary epicardial adipose tissue thickness (EATT) and presence of calcified plaque in the three coronary arteries, in patients who underwent multidetector computed tomography coronary angiography (n = 150).
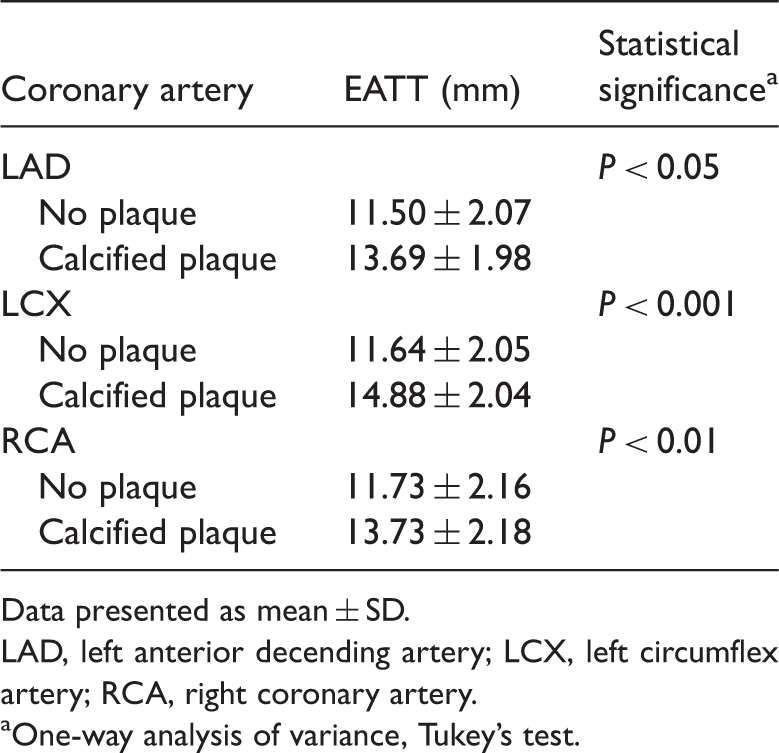
Data presented as mean ± SD.
LAD, left anterior decending artery; LCX, left circumflex artery; RCA, right coronary artery.
One-way analysis of variance, Tukey’s test.
Discussion
Increasing numbers of coronary risk factors have been identified and are known to play important roles in the development and progression of atherosclerosis.19,20 One such risk factor is adiponectin, which is a hormone synthesized in fat cells including those in epicardial adipose tissue. Adiponectin decreases insulin resistance and has a protective role in the formation of atherosclerosis. 21 Adiponectin levels have been found to be lower in epicardial tissue than in subcutaneous fat, in patients with CAD. 22
Epicardial adipose tissue secretes pro- and anti-inflammatory mediators that contribute to the formation of CAD. Increased understanding of the pathophysiological role of EAT has led to a search for imaging methods that can provide EATT measurements and detect CAD. An echocardiography study found associations between EATT and risk factors for CAD, such as BMI, age and C-reactive protein levels, as well as a correlation between CAD severity and increased EATT. 23 Echocardiography has also revealed thicker EAT in patients with metabolic syndrome than in healthy controls, 24 and an association between thicker EAT and poor prognosis in patients with acute coronary syndromes. 25 A further echocardiography study found no association between CAD severity and EATT, however. 2 The limited echocardiography window available for the visualization and measurement of EATT thickness can limit the efficiency of this technique in determining the full measurement of fat surrounding the heart. A study examining the reproducibility of echocardiography EATT findings identified large interobserver differences and, as a result, echocardiography was reported to be of limited use for EATT measurement. 26
Although conventional angiography is the gold standard for diagnosis of coronary artery disease, MDCT coronary angiography has become a useful method for detecting subclinical atherosclerosis before the onset of clinical symptoms. 27 With the development of 64-detector MDCT and dual-source technology, noninvasive CT angiography has become an alternative to conventional angiography for CAD diagnosis.3,28 Several studies have used MDCT to examine the relationship between epicardial adipose tissue and CAD. EATT can be measured using MDCT, and epicardial adipose tissue volume can also be calculated. 12 A study using 64-detector MDCT found that patients with coronary artery plaque (with or without stenosis) had increased EAT volume compared with patients without coronary artery plaque. 29 In addition, EAT volume was a better predictor of early stage CAD than simple anthropometric measurements. 29 Others have found relationships between high EAT volume and the presence of soft or mixed plaques, 30 or CAD.12,31
Although volume measurements obtained using MDCT provide precise information about the quantity of EAT, image processing requires additional software and time. The association between EATT in the left atrioventricular groove and CAD has been shown to be more significant than the association between EAT volume and CAD. 8 For convenience, the present study evaluated EATT.
Pericoronary EAT was significantly thinner in patients with calcium scores of 0 compared with those having scores >0, in the present study. In addition, pericoronary EAT was thicker in cases with calcified plaque compared with those without. These findings suggest that epicardial adipose tissue could have a role in the development of calcified plaque in coronary arteries.
Pericoronary epicardial adipose tissue has a close anatomical relationship with the coronary arteries, and may therefore have a disproportionately large effect on the inflammatory response and the development of atherosclerosis. We therefore measured pericoronary EATT in order to examine the relationship between epicardial adipose tissue and coronary heart disease. Few studies have investigated pericoronary EATT. 32 A large-scale study of 573 healthy postmenopausal women found positive relationships between pericoronary EATT and age, body weight, BMI, waist circumference, waist-to-hip circumference ratio, smoking status, blood glucose and low serum high-density lipoprotein cholesterol concentrations. 32 In contrast to the present study, the study population was made up entirely of older women, and age and sex are known risk factors for CAD. We also examined other CAD risk factors and observed that pericoronary EAT was significantly thicker in patients with CAD than in those without.
Positive correlations were found between pericoronary EATT and total cholesterol, BMI, coronary artery calcium score, hypertension and diabetes mellitus in the present study. Although pericoronary EAT was thicker in patients with high LDL-C, this correlation was not statistically significant. Similar findings have been reported by others, 32 and this lack of significance may be due to the different proportional distribution of other risk factors in our study. Pericoronary EATT was not correlated with either cigarette smoking or family history in the present study, which may also be due to differences in the distribution of CAD risk factors.
The present study had several limitations. EATT measurements were made from the thickest region around the LAD, LCX and RCA, but interobserver differences are possible. In addition, factors, including the low number of patients and differences in the distribution of CAD risk factors between individuals limited the statistical power.
In conclusion, the present study reveals a relationship between pericoronary EATT and CAD, as well as an association between pericoronary EATT and CAD risk factors. Pericoronary EATT measurement may become a widely used, easy-to-perform method for determining CAD risk.
Footnotes
Declaration of conflicting interest
The authors declare that there are no conflicts of interest.
Funding
This research received no specific grant from any funding agency in the public, commercial, or not-for-profit sectors.