
Abstract
Background:
Metformin, which has been shown to be highly effective in treating type 2 diabetes (T2D), is also believed to be valuable for Alzheimer’s disease (AD). Computer simulation techniques have emerged as an innovative approach to explore mechanisms.
Objective:
To study the potential mechanism of metformin action in AD and T2D.
Methods:
The chemical structure of metformin was obtained from PubChem. The targets of metformin were obtained from PubChem, Pharm Mapper, Batman, SwissTargetPrediction, DrugBank, and PubMed. The pathogenic genes of AD and T2D were retrieved from the GeneCards, OMIM, TTD, Drugbank, PharmGKB, and DisGeNET. The intersection of metformin with the targets of AD and T2D is represented by a Venn diagram. The protein-protein interaction (PPI) and core targets networks of intersected targets were constructed by Cytoscape 3.7.1. The enrichment information of GO and Kyoto Encyclopedia of Gene and Genomics (KEGG) pathways obtained by the Metascape was made into a bar chart and a bubble diagram. AutoDockTools, Pymol, and Chem3D were used for the molecular docking. Gromacs software was used to perform molecular dynamics (MD) simulation of the best binding target protein.
Results:
A total of 115 key targets of metformin for AD and T2D were obtained. GO analysis showed that biological process mainly involved response to hormones and the regulation of ion transport. Cellular component was enriched in the cell body and axon. Molecular function mainly involved kinase binding and signal receptor regulator activity. The KEGG pathway was mainly enriched in pathways of cancer, neurodegeneration, and endocrine resistance. Core targets mainly included TP53, TNF, VEGFA, HIF1A, IL1B, IGF1, ESR1, SIRT1, CAT, and CXCL8. The molecular docking results showed best binding of metformin to CAT. MD simulation further indicated that the CAT-metformin complex could bind well and converge relatively stable at 30 ns.
Conclusion:
Metformin exerts its effects on regulating oxidative stress, gluconeogenesis and inflammation, which may be the mechanism of action of metformin to improve the common pathological features of T2D and AD.
Introduction
Dementia is a severe public health issue. It has affected about 57.4 million people all over the world as of 2019. 1 According to the World Alzheimer’s report, by 2050, the prevalence of dementia will triple worldwide. Alzheimer’s disease (AD) is one of the most common neurodegenerative diseases, accounting for two-thirds of all dementia cases. 2 AD drugs that have been approved by FDA can only improve cognitive function in a short time, and no drugs have been approved specifically for the treatment of moderate and severe AD cognitive impairment. 3 One of the important reasons for the slow development progress of effective drugs against AD is that the molecular changes in the course of AD remain unclear. 4 Finding therapeutic targets is urgent for the prevention and treatment of AD.
High blood glucose levels and aging are important risk factors for dementia.5,6 AD is also known as ‘brain diabetes’ or ‘type 3 diabetes (T3D)’. 7 Many studies have shown that there is a close relationship between T2D and AD and that many of the pathogenic mechanisms between the two may be the same, although the exact pathophysiological mechanisms are not clear yet.8–11
Metformin, derived from a plant named ‘galega officinalis’ is currently widely used as a first-line drug for the treatment of T2D. Its efficacy has been proven, and it has few adverse effects. Recent studies have proved the effect of metformin on the prophylaxis and treatment of neuropsychiatric degenerative diseases in addition to its significant hypoglycemic effects, especially in patients with T2D.12,13 However, the mechanism of action of metformin in both diseases is not yet clear. Screening common drug targets is a potential strategy for identifying molecular linked pathways. Molecular dynamics (MD) simulation is an indispensable classical technique in computer-aided drug design and is often used to study the dynamic processes of targets-drug interactions. It plays a key role in the study of drug-protein interaction mechanisms and in the drug design process. The combination of the two approaches may offer new possibilities for the treatment of T2D and AD. Early studies have shown that metformin improves metabolism by inhibiting mitochondrial complex I, but only at suprapharmacological or high concentrations (>250 μmol). The mechanism of action of metformin at therapeutic concentrations is unclear. At therapeutic doses, the LKB1-AMPK axis becomes a more reliable mechanism for the action of metformin. 14 In addition, human liver and endothelial tissue never reach such high concentrations but still inhibit gluconeogenesis at pharmacological concentrations, which may be related to the ability of metformin to minimize the reactive oxygen species via orphan nuclear receptors (NR4A1/Nur77) at therapeutic blood concentrations. 15 High mobility group protein B1 (HMGB1) and presenilin enhancer protein 2 (PEN2) could also be potential therapeutic targets for metformin.16,17 In addition to the above targets, other targets derived from PubMed references can also be used as supplements to the metformin target repertoire and are thoroughly described in the discussion section. In this study, we focused on the main mechanisms of metformin action on the common pathogenic targets of AD and T2D at pharmacological concentrations based on network pharmacology, bioinformatics analysis, and molecular docking. The flow chart is shown in Figure 1.

Flow chart of the network pharmacology of therapeutic targets of metformin for AD and T2D.
Materials and methods
Potential targets for metformin
Metformin targets were collected and integrated from
Potential pathogenic targets for AD and T2D
A search on
The plotting of the Venn diagram and the construction of the protein-protein interaction network
The active target genes of metformin intersect with the pathogenic targets of AD and T2D. The results were presented as a Venn diagram based on R software. The intersected target genes were imported into the List of Names under Multiple Proteins on the STRING (https://cn.string-db.org/), and Homo sapiens were selected from the Organism. The minimum required interaction score was set to 0.400, disconnected nodes in the network were hidden, and the protein-protein interaction (PPI) network was constructed and downloaded as a high-resolution bitmap.
The construction of the PPI of core targets by Cytoscape 3.7.1 software
After completing the above steps on the STRING, the result was exported and downloaded as tabular text output in TSV format additionally. The TSV file was imported to Cytoscape 3.7.1 software (UC San Diego & UC San Francisco & Gladstone Institute, California, USA; University of Toronto, Ontario, Canada) to obtain the network. The following parameters were set in the Network Analyzer – Visualize Parameters module: map node size and color to degree. The plug-in named cytoHubba was downloaded in the APP Manager, and each gene was assigned by the cytoHubba according to the topological network algorithm. The top 10 targets in terms of degree were screened as core targets for subsequent analysis.
Enrichment analysis
Metascape (http://metascape.org/), which contains data resources such as Gene Ontology (GO) and Kyoto Encyclopedia of Gene and Genomics (KEGG), has the advantages of rich content and timely updates over DAVID. 18 In this study, the enrichment of these targets in the KEGG pathway and GO was analyzed based on the Metascape. GO terms include Molecular Function (MF), Biological Processes (BP), and cellular components (CC). The cutoff criteria were p-value <0.01, a minimum overlap of 4, and a minimum enrichment of 1.5. The data that met the above criteria were arranged according to the requirements in the example. The third column was set to ‘count’ and arranged in descending order. The sorted data was imported into the online bioinformatics platform (http://www.bioinformatics.com.cn/) for image optimization to obtain a three-in-one histogram of BF, CC, and MF. The construction of the KEGG enrichment bubble chart was similar to the above. The bar chart and the drawing data (pathway, enrichment, p-value, count) required in the example were exported in Metascape, and the drawing data was imported into the online platform to construct the dot bubble chart.
The construction of a network map of ‘compound-target-pathway’
Targets were imported into the KEGG Mapper-Color to obtain the pathways in which the targets were contained. The network table file and attribute table file were constructed based on EXCEL, and these tables were imported into Cytoscape 3.7.1 to construct a ‘compound-target-pathway’ network.
Molecular docking
Molecular docking of metformin with the core targets was performed based on AutoDock 1.5.6, Pymol, and Chem3D 18.1. The metformin 2D structure file was first downloaded from PubChem, then imported into Chem3D 18.1, optimized to a minimum energy structure, and saved in MOL2 format. PDB files for the crystal structures of candidate protein targets were downloaded from RCSB Protein Data Bank (https://www.rcsb.org/). The 10 core targets screened were used for molecular docking. Resolutions between 1.5 and 2.5 Å are considered a good quality for docking studies. 19 These proteins were imported into Pymol for removing solvent and organic and saved in PDB format. If the protein was a multimer of the same monomer, one of the monomers would be extracted. Ligand-receptor complexes were introduced into AutoDock 1.5.6 for hydrogenation and saved in PDBQT format as docking ligands. Set the active pocket to encompass the entire receptor as much as possible and obtain the active pocket coordinate parameters. Set the docking times to 20 in the Vina input parameters module, and save the generated txt file. The file in PDBQT format obtained by running vina was imported into Pymol for optimization and adjustment to obtain the molecular docking conformation.
MD simulation
Molecular docking results often have errors with the actual situation. MD simulation can simulate the dynamic process of protein-drug interactions, discover potential lowest-energy conformations, and improve the rationality and accuracy of drug design. 20 Currently, MD simulation has been widely used for problems that are difficult to be solved solely by experiments, such as the pathogenic mechanisms of diseases caused by amyloid misfolding, virtual screening, drug and target interaction mechanisms, and drug resistance mechanisms caused by target mutations. 21 We used GROMACS 2020.5 software for MD simulation. AMBER99SB field was used for the protein system, GAFF field was used for metformin small molecule drugs, SPC/E water molecule model was used for water molecule model, and regular dodecahedron – water box was used for simulation box. Protein charge: add 3 NA +; NVT balance: 100ps; NPT equilibrium: 100ps. The root-mean-square deviation (RMSD), which indicates the sum of all atomic deviations from the resulting conformation and the target conformation at a given time, is an important basis for measuring the stability of the system. We obtained the RMSD results of the whole system and conducted the analysis. The combined free energy was calculated with the MM/PBSA method. The Gibbs Energy Landscape shows that the overall conformation of the molecule is stabilized to the local minimum free energy during the simulation. 22 In this study, RMSD and Gyrate were used to map Gibbs Energy Landscape and obtain the docking results of the lowest energy conformation.
Results
Metformin targets prediction
Thirteen known active targets were obtained from PubChem, 101 from BatMan, 1 from SwissTargetPrediction, 3 from DrugBank, 74 from PharmMapper, and 105 from Pubmed references. A total of 291 were obtained after deduplication.
AD and T2D pathogenic targets prediction
Eighty-nine targets were obtained from the Drugbank database, 131 from TTD, 87 from Pharm GKB, 123 from DisGeNET, 658 from OMIM, and 10,973 from Genecards. We selected 3116 targets with a correlation score larger than 5 from Genecards. A total of 3669 AD pathogenic targets were obtained after reweighting all targets.
For T2D pathogenic targets, 154 were obtained from the Drugbank database, 89 from TTD, 49 from PharmGKB, 7 from DisGeNET, 513 from OMIM, and 5064 with correlation scores greater than 10 from Genecards. A total of 5283 T2D pathogenic targets were obtained after reweighing all targets.
Venn diagram of compound-diseases common targets
The Venn diagram is shown in Figure 2. The network constructed after hiding nodes is shown on the right side of Figure 2, which contains 115 nodes and 864 edges, significantly higher than the expected 330 edges (p < 1.0e-16).

Venn diagram showing the number of intersected targets: orange, purple, and blue circles represent the number of targets for metformin, AD, and T2D, respectively.
The acquisition of core targets
The PPI derived from STRING was imported into the PPI established in Cytoscape 3.7.1, as shown in Figure 3 (left). The color and size of the dots vary with the degree, with darker and larger circles indicating a higher degree. The average degree was 15.5 based on cytoHubba. The top 10 targets with the highest degree values are shown in Table 1, and the complete table is available in the supplementary material. The PPI network of core targets is shown in Figure 3 (right), including TP53, TNF, VEGFA, HIF1A, IL1B, IGF1, SIRT1, ESR1, CAT, and CXCL8.

PPI diagram of drug-diseases common targets (left) and core targets screened by the cytoHubba (right).
The 10 core targets with the highest degree ranking.

Results of the enrichment analysis
The three-in-one histogram of BP, CC, and MF GO enrichment based on Metascape and the online bioinformatics platform is shown in Figure 4, with ‘count’ indicating the number of genes enriched to the corresponding items. The results showed that BP was mainly enriched in response to the hormone, regulation of ion transport, and positive regulation of cell migration. CC are mainly enriched in the cell body, axon, membrane raft, and apical part of the cell. MF mainly involved kinase binding and signal receptor regulator activity. The KEGG pathway bubble map and histogram are shown in Figure 5. The p-value of bubble chart enrichment results is reflected by color. Genes are represented by bubble size. Y-axis indicates pathway or disease, and X-axis indicates gene ratio. The KEGG pathway analysis indicated that these targets are mainly enriched in pathways in cancer, pathways of neurodegeneration, endocrine resistance and longevity regulating pathway.

Enrichment analysis of the BP, CC, and MF modules.

KEGG pathway enrichment analysis.
Construction of the ‘metformin-target-pathway’ network based on Cytoscape
The pathways were acquired using the KEGG Mapper Color to embrace most core targets, and the ‘metformin-target-pathway’ network was drawn using Cytoscape 3.7.1 software, as shown in Figure 6.

The ‘metformin-target-pathway’ network.
Molecular docking results
All predicted targets were successfully docked with metformin, and the docking binding energy results are shown in Table 2. In general, stable docking models have negative binding energies, with binding energy <4.0 kcal/mol indicating certain binding activity and <5.0 kcal/mol indicating good binding activity. 23 The lower the energy score, the stronger the ligand-receptor binding capacity and the more stable the structure.24,25 In this study, stable docking models with specific binding sites, binding distances, and binding atoms were obtained. Among them, CAT was the most stable receptor binding to metformin, with a binding energy of −6.0 kcal/mol. Metformin acted on GLU- 330 (2.1 Å and 2.7 Å) and two SER-120s (2.4 Å and 2.2 Å) amino acids residues through five hydrogen bonds (Figure 7(a)). The binding energy of TP53-metformin (Figure 7(b)) is −5.6 kcal/mol, and metformin interacts with THR-230 (2.3 Å, and 2.4 Å) and SER-227 (2.5 Å) via hydrogen bonding. The binding energy of SIRT1-metformin (Figure 7(c)) was −5.6 kcal/mol, and metformin interacted with SER-442 (1.8 Å) residues through hydrogen bonding.
Molecular docking results.

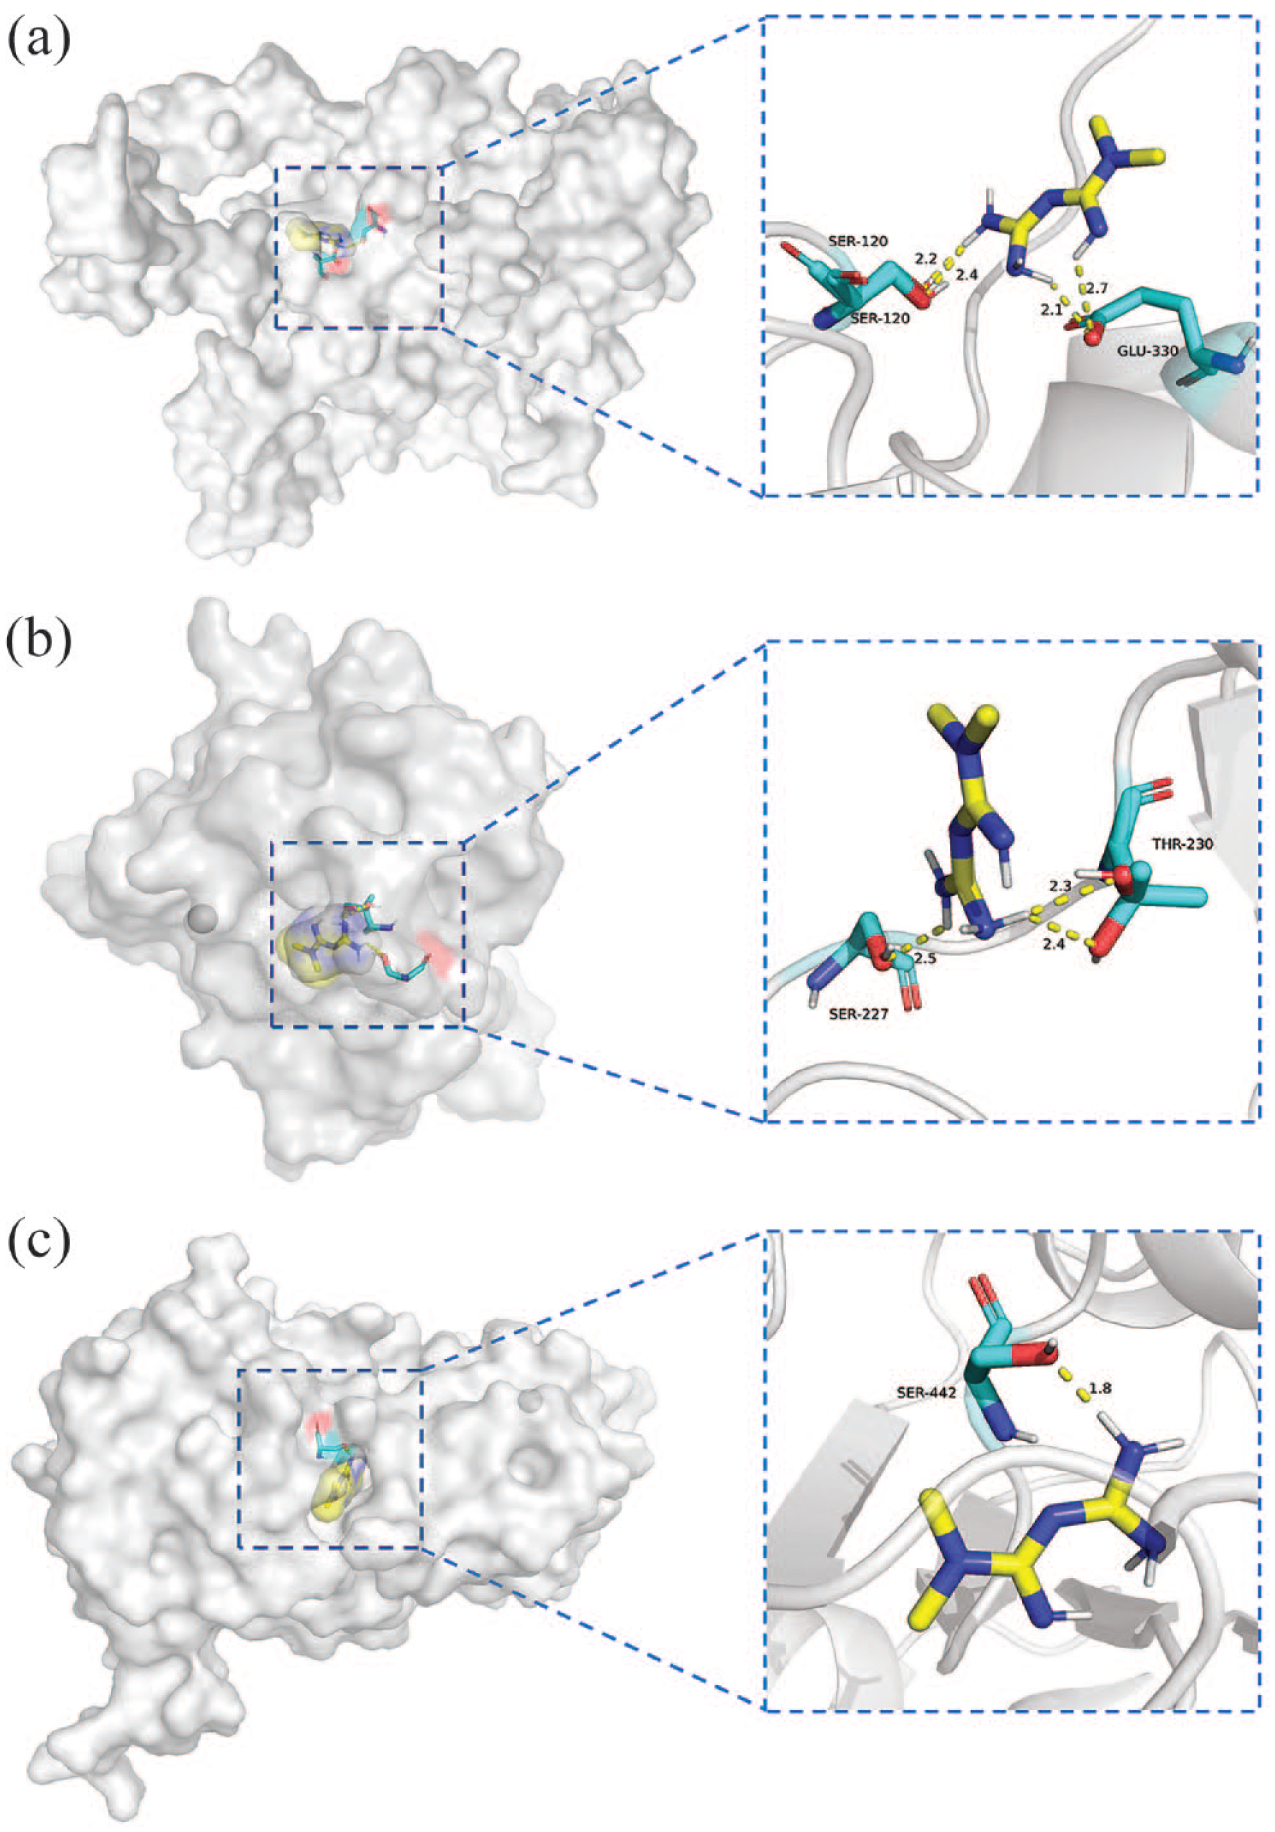
Binding models of metformin to central targets. Active residues are represented by stick models, yellow dashed lines represent hydrogen bonds, and metformin is represented by stick models: (a) CAT-metformin, (b) TP53-metformin, and (c) SIRT1-metformin.
Results of MD simulation
The CAT protein docked best with metformin molecular was selected for 50 ns MD simulation and system stability analysis (Figure 8). A smaller RMSD value indicates a more stable conformation. In general, the optimal score for the RMSD value should be close to 2 Å. 26 The results show that the structure of the CAT-metformin was relatively stable at around 30 ns, and the RMSD fluctuates at 0.2 nm (2 Å) attachment. Energy low-lying maps in the Gibbs Energy Landscape indicated low-energy conformations, as shown in Figure 9 (left). The darker color indicates the lower binding energy. The lowest energy conformation is shown in Figure 9 (right). Metformin acts on AYP-259 amino acid residue through three hydrogen bonds (3.1, 3.0, 3.0 Å). MM/PBSA further demonstrated the stability of metformin within the active pocket of the CAT protein. The total binding free energy obtained by the MM/PBSA calculation was −67.732 ± 16.655 kcal/mol.

Changes of RMSD values in MD simulation. The purple, blue, and green fold lines represent the CAT-metformin complex (CAT-Met), metformin (Met), and CAT, respectively.

Gibbs Energy Landscape (left) and CAT-Met lowest energy conformation (right). Active residues are represented by stick models, yellow dashed lines represent hydrogen bonds, and metformin is represented by stick models.
Discussion
AD is one of the common neurodegenerative diseases with progressive cognitive decline as its common clinical symptom. Metformin is a widely used drug for diabetes. It has recently been shown that diabetic patients receiving metformin have a lower risk of dementia and a slower cognitive decline.27,28 In experimental studies of non-diabetic animals, a meta-analysis 29 and clinical research13,30 confirmed that metformin benefits the cognition of animals with AD. By integrating information from multiple databases, we obtained 115 intersected targets for metformin in AD and T2D pathology. In order to further understand the interactions between these targets, we performed GO and KEGG pathway enrichment analysis. The results suggested that metformin might affect AD with T2D mainly by regulating the pathways of cancer, neurodegeneration, and longevity regulation. Simultaneously, based on the cytoHubba plug-in, TP53, TNF, VEGFA, HIF1A, IL1B, IGF1, SIRT1, ESR1, CAT, and CXCL8 were considered as possible core targets of metformin for intervention in AD and T2D. The molecular docking results showed that metformin had the best affinity for CAT.
Although the exact mechanism of action of metformin is unclear, it is well established that it does not exert its therapeutic effect through inhibition of mitochondrial complex I in vivo, as was adequately expressed by Triggle et al. 31 Below are the mechanisms at pharmacologic concentration, which is in keeping with the predicted affinity concentration of metformin for CAT, etc. (Figure 10).

Potential molecular mechanisms of metformin at pharmacological concentrations.
Metformin exists as a cation in the body and is rarely bound to hemoglobin, but it can act as a substrate for organic cation transport proteins (OCTs), which are mainly mediated by OCT1 from the blood into the liver and excreted from hepatocytes by the multidrug and MATE1.32,33 The liver is the primary organ involved in glucose metabolism, and high expression of OCT1 in the liver can promote the absorption of metformin. 34
Liver kinase B1 (LKB1) is mainly expressed in the nucleus and cytoplasm, and NR4A1 is one of the proteins that can directly bind metformin (NR4A1-metformin binding energy: −5.0 kcal/mol). In vitro studies have shown that NR4A1 plays an important role in metformin-mediated protection against vascular disorders in patients with T2D, which is independent of the effect on blood glucose. 15 Binding of NR4A1 to LKB1 in the nucleus attenuates AMPK activation. 14 However, they separated in reaction to metformin, and LKB1 was released and shuttled into the cytoplasm to activate AMPK in primary hepatocytes by increasing AMPK-catalyzed phosphorylation of the α-subunit at Thr172.14,35–37 Activation of AMPK to inhibit gluconeogenesis is an anabolic process regulated primarily through the cAMP response element binding (CREB) co-activation complex, which ultimately leads to reduced expression of glucose isomerase genes (PEPCK and G6Pase). 37 In addition, the NR4A1-metformin interaction releases NR4A1 into the cytosol, where it is translocated into the mitochondria to inhibit the production of reactive oxygen species (ROS). This action has been demonstrated to maintain endothelial function in hyperglycemia. 15 Notably, the endothelial protective effect of metformin was observed in the low micromolar range of 1–10 μM. This effect was associated with a protective effect due to a hyperglycemia-mediated reduction in mitochondrial production of ROS. Direct binding of metformin to HMGB1 inhibits its activity, which in turn inhibits its mediated inflammation. 17 It has been also found that low doses of metformin specifically activate the lysosomal AMPK through a novel PEN2-ATP6AP1 pathway,16,38 axis inhibition protein 1 (AXIN) and late endosomal/lysosomal adaptor, MAPK and MTOR activator (LAMTOR1) are required in this process.38,39
Oxidative stress has been considered to be one of the most important factors in the development of AD and T2D.10,40–43Metformin may acts directly on these targets to reduce ROS and oxidative damage (Figure 11). Free radicals are active biomolecules produced in metabolic pathways or the physiological processes of immune cells. 44 They are important components in maintaining biological homeostasis. Free radicals mainly include ROS and reactive nitrogen species. 45 In electron transfer, mitochondrial respiratory chain complexes inevitably leak electrons, and the leaked electrons interact with oxygen to form O2- and H2O2. Oxidative stress occurs when free radicals exceed human antioxidant capacity and cannot be removed in time, 46 causing cell damage. Fortunately, most biological cells have an intrinsic defense mechanism 45 that can protect them from free radical attack. 47 This process involves a variety of enzymes, such as SOD, CAT, and GPX1. The relationship between different antioxidant enzymes is shown in Figure 12. CAT can decompose H2O2 into water and oxygen to avoid cell damage. In addition to the known direct interaction of NR4A1 with metformin to increase the expression of SOD1 and GPX1 to attenuate oxidative stress and reduce cellular damage,48,49 other potential targets of metformin, CAT, TP53, and SIRT1, may also play an important role in oxidative stress. Under pathological conditions, oxidant-sensitive islet cells can cause oxidative damage under CAT inactivation or deficiency.50–52 Aβ causes increased levels of H2O2 and lipid peroxides to accumulate in cells. 53 CAT can resolve hydrogen peroxide and maintain intracellular redox homeostasis, 45 protecting cells from Aβ toxicity and oxidative damage. 53 Metformin may promote endogenous antioxidant effects by enhancing CAT effects, which is consistent with the conjecture in ref. 54
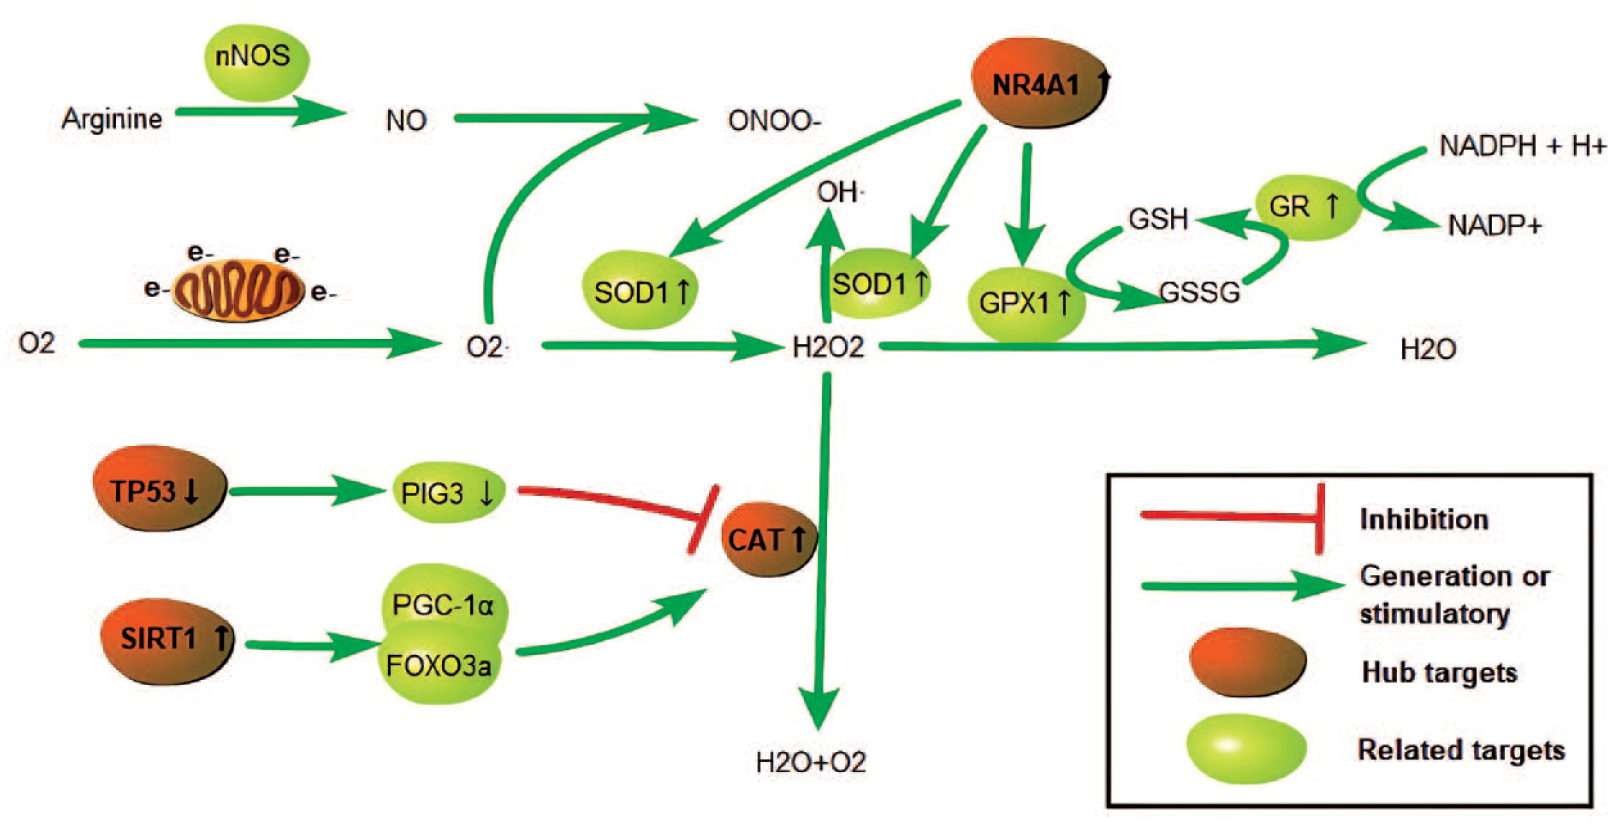
Relationship between CAT and other related antioxidant targets.
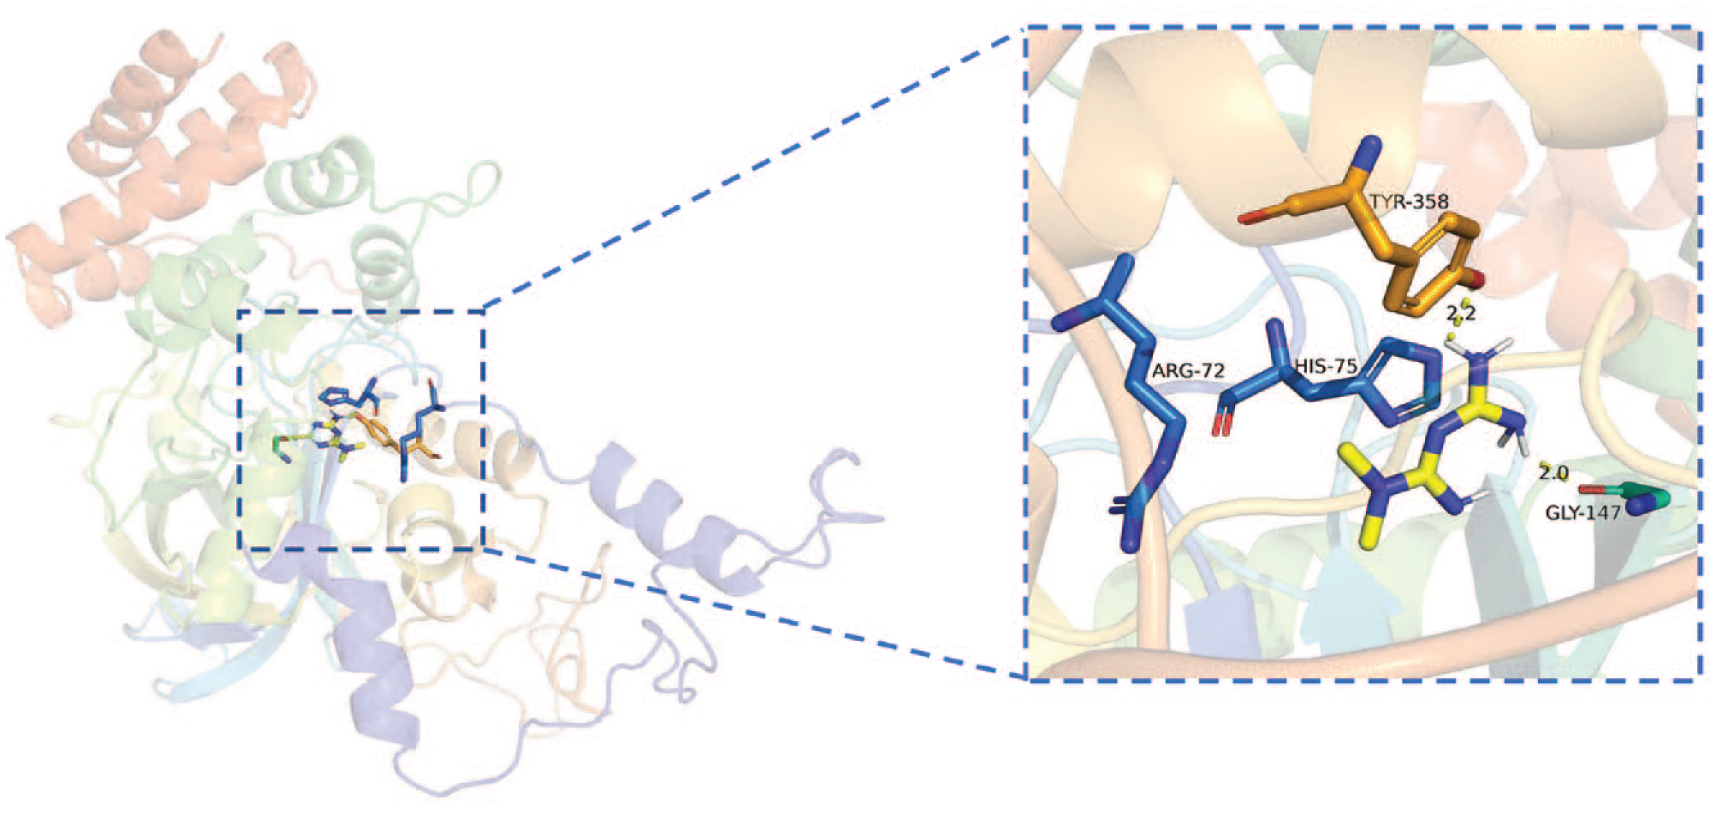
CAT-metformin (PDB ID: 3RGS).
Dai et al. found a dose-dependent enhancement of CAT activity and a reduction in ROS in the presence of liver injury. The results showed that neither the expression level of CAT protein nor the activation of AMPK was responsible for the increased CAT activity. The molecular docking results indicated that metformin might interact with CAT residues through hydrogen bonding, leading to enhanced CAT activity. 55 In their study, the binding mode of CAT-metformin in mice was simulated using a homology modeling approach (Uniprot ID: P24270) with a binding energy of −1.63 kcal/mol. In contrast, the present study simulated the binding mode of CAT-metformin in humans (Uniprot ID: P04040) with a binding energy of −6.0 kcal/mol. In addition, we repeated Dai’s computer simulation experiments. The results showed that the docking binding energy was −5.8 kcal/mol (PDB ID:3RGS). Metformin interacted with CAT through hydrogen bonding with residues TYR-358 and GLY-147 (2.2A, 2.0A) and with ARG-72 and GLY-147 residues via electrostatic interaction, as shown in Figure 12. The reason for the different results between the two is the different stencils used for modeling. In conclusion, if our simulation results are closer to the reality, it is more likely that the direct action of metformin on CAT residues is responsible for the dose-dependent enhancement of CAT activity and reduction of ROS in liver injury by metformin treatment, both in human and murine.
TP53 is a key regulator of intracellular ROS levels. 56 The relationship between TP53 and ROS is complex and mutually regulated. 57 A recent study has shown that TP53 exhibits antioxidant and pro-oxidant abilities under different stress intensities and cellular environments. 56 After genotoxic stress, high levels of TP53 and the tumor protein PIG3 synergistically inhibit CAT, leading to a shift in oxidative/antioxidative balance toward an oxidative state, which may increase apoptotic cell death, 58 and metformin may reverse this deterioration.
Another potential direct target of metformin, SIRT1, is an ‘anti-aging’ gene dependent on an AMPK-mediated increase in nicotinamide phosphoribosyltransferase. 59 The interaction of SIRT1 downstream factors PGC-1α and FOXO3a can regulate the expression of CAT, which reduces ROS and protects cells from oxidative stress. In addition, other antioxidant enzymes such as manganese superoxide dismutase and peroxiredoxin 3 are also regulated by this pathway; the mechanisms involved have been elaborated in detail by Olmos et al. 60
However, whether CAT, TP53, and SIRT1 are direct targets of metformin needs to be verified in further experiments.
In addition, an interesting phenomenon was found during our study that the ‘longevity regulatory pathway’ may be one of its co-acting mechanisms. However, there is still no evidence that metformin is anti-aging or life-extending in humans, and the evidence summarized by Mohammed et al. 61 suggests that the beneficial effects of metformin on aging and life occur primarily through indirect actions on cellular metabolism in patients with type 2 diabetes. These effects arise from its anti-hyperglycemic effect, enhanced insulin sensitivity, reduction of oxidative stress, and protective effects on endothelial cells and vascular function. In contrast, the protective effects of metformin in healthy populations are still controversial and further exploration is also necessary in the future.
Restrictions
Following are a number of issues that place some restrictions on the interpretation of our bioinformatics analysis and computer simulation approach.
Expansion of target datasets
Since the drug databases were updated earlier and in smaller numbers, we expanded these target sets as much as possible by manual search.
Explanation of molecular docking results
Selection of protein crystal structure
A Uniprot ID usually has more than one protein crystal structure, and we selected the protein crystal structure based on different characteristics, such as the resolution and the presence of eutectic ligands. The binding energy and molecular docking results obtained from different PDB ids may vary. Therefore, it is important to ensure that the proteins used in the experiments and the proteins in the calculation are of the same species when performing cellular or animal experiments.
Combined energy
Different docking softwares have different evaluation functions and docking methods. Even if the receptors and ligands are the same, the docking results may be slightly different. In the process of molecular docking, the highest binding energy is not necessarily the most correct one, and a more stable result can be selected by multiple docking. Docking can result in multiple poses and can bind to many different amino acid residues. Furthermore, molecular docking is used to predict the binding ability of the recipient ligand, and MD simulation can further verify the results of molecular docking and the equilibrium state of binding, serving as a bridge between theories and experimental results.
Conclusion
In summary, this research revealed the potential molecular mechanism of action of metformin on AD and T2D through network pharmacology, molecular docking, and MD simulation. The molecular docking results showed that metformin had the best binding effect on the CAT target. MD simulation demonstrated the stability of the CAT-metformin complex. The effects of target CAT, TP53, SIRT1, and NR4A1 in terms of oxidative stress were also investigated. Metformin exerts its effects on regulating oxidative stress, gluconeogenesis and inflammation, which may be the mechanism of action of metformin to improve the pathological features of T2D and AD. The application of network pharmacology and molecular docking provides new technologies and methods for drug research, which is useful for the efficient prediction and screening of relevant targets and pathways. However, these results are based on computer simulations and big data analysis, which needs to be further verified by cell or animal experiments.
Supplemental Material
sj-pdf-1-tae-10.1177_20420188231187493 – Supplemental material for Exploring the mechanism of metformin action in Alzheimer’s disease and type 2 diabetes based on network pharmacology, molecular docking, and molecular dynamic simulation
Supplemental material, sj-pdf-1-tae-10.1177_20420188231187493 for Exploring the mechanism of metformin action in Alzheimer’s disease and type 2 diabetes based on network pharmacology, molecular docking, and molecular dynamic simulation by Xin Shi, Lingling Li, Zhiyao Liu, Fangqi Wang and Hailiang Huang in Therapeutic Advances in Endocrinology and Metabolism
Footnotes
References
Supplementary Material
Please find the following supplemental material available below.
For Open Access articles published under a Creative Commons License, all supplemental material carries the same license as the article it is associated with.
For non-Open Access articles published, all supplemental material carries a non-exclusive license, and permission requests for re-use of supplemental material or any part of supplemental material shall be sent directly to the copyright owner as specified in the copyright notice associated with the article.