
Abstract
Background:
Evidence investigating sleep pattern in relation to bone health in elderly participants with osteoporosis remains sparse. We aimed to assess the relationship between sleep pattern incorporating five sleep characteristics (snoring, midnight waking up, insomnia, sleep duration, and daytime napping) and bone mineral density (BMD) in elderly participants with osteoporotic fracture.
Methods:
A cross-sectional study was conducted to include eligible elderly patients from the Department of Orthopedics who were admitted to hospital due to an osteoporotic fracture. Sleep pattern was constructed based on total sleep scores and categorized into healthy, intermediate, and poor pattern groups. Multivariable logistic regression model was used to assess sleep pattern in relation to risk of low BMD.
Results:
A total of 169 elderly patients with osteoporotic fracture were included in this study (mean age: 71.91 years; 87.57% females). There were 36 (21.30%), 107 (63.31%), and 26 (15.38%) patients with healthy, intermediate, and poor sleep pattern, respectively. Compared with healthy sleep pattern, no significant relationship between intermediate sleep pattern and BMD was detected [odds ratio (OR) = 1.72, 95% confidence interval (CI): 0.74, 3.97, p = 0.21), while poor pattern was significantly associated with decreased BMD (OR = 3.50, 95% CI: 1.10, 11.14, p = 0.034).
Conclusion:
The majority of elderly patients with osteoporotic fracture had unhealthy sleep pattern; poor sleep pattern was significantly related to reduced BMD when compared with healthy pattern. Further high-quality evidence is needed to assess and validate the relationship between sleep pattern and risk of low BMD in the elderly.
Introduction
Guidelines have been published to improve management of osteoporosis and prevention of fractures.1,2 In China, osteoporosis is diagnosed mainly based on the bone mineral density (BMD) measurement by dual-energy X-ray absorptiometry (DXA) and/or the existence of an osteoporotic fracture defined as a fracture due to the force of a fall from a standing height or less. 3 It is generally recommended for the elderly to keep a healthy lifestyle, take supplementation of calcium and vitamin D, and receive anti-osteoporotic treatment when necessary, for the management of osteoporosis and prevention of osteoporotic fracture. 4 However, osteoporosis remains to impose a substantial disease burden to global health, especially with the aging population. 5
Sleep characteristics including sleep duration, insomnia, obstructive sleep apnea, and daytime napping were reported to associate with BMD, falls, or osteoporotic fractures.6–10 Nevertheless, the previous studies did not consider the joint complexity and associations between the individual sleep characteristics, while participants with one sleep behavior were generally prone to own another behavior in real-world settings.11,12 Furthermore, evidence investigating sleep pattern in relation to BMD in elderly participants who experienced osteoporotic fracture was lacking and sparse in the literature.
Therefore, in this study, we aimed to assess the relationship between sleep pattern incorporating five sleep characteristics (snoring, midnight waking up, insomnia, sleep duration, and daytime napping) and BMD in elderly patients with osteoporotic fracture, based on data from a cross-sectional study. Findings may provide insights into management of osteoporosis in the elderly from the perspective of healthy sleep pattern.
Methods
Participants and setting
This cross-sectional study was conducted in a general hospital located in Zhuhai City, Guangdong Province, China, from February 2020 to September 2021. We used the consecutive sampling method to include eligible elderly patients from the Department of Orthopedics who were admitted to hospital due to an osteoporotic fracture. Patients were excluded if they had an age of <55 years or required hospitalization not because of an osteoporotic fracture. Based on the recommendation that the number of events was 10–15 times the number of independent variables in a fitted logistic regression model, 13 we anticipated that there would be approximately five to eight variables included in the model. Therefore, a total of at least 50–80 patients in the low BMD group (defined below) would be needed in this study. Data were collected from bone density examination and face-to-face interview with trained research staff.
Sleep pattern and other independent variables
Based on the collected data, five sleep characteristics were used to construct the sleep pattern, which included snoring, insomnia, midnight waking up, sleep duration, and daytime napping. Data on snoring were documented by asking patients whether they knew or their family member ever told them that they had habitual snoring. Patients’ presence of insomnia was evaluated by asking them whether they had trouble falling and/or staying asleep in the past 6 months; the frequency of insomnia (>4 times/week, 1–3 times/week, sometimes, rarely/never) was also collected when applicable. Likewise, the information on whether they had midnight waking up and the frequency (⩽ and >2 times each night) was documented during the interview. Patients estimated their daily nighttime sleep duration in recent times. They were also required to report whether they had habitual daytime napping, and if so, to report the approximate duration of napping.
To build a sleep pattern that accounted for the joint associations between the five sleep characteristics, we followed the algorithm from previous observational studies.14,15 Patients with a response of having habitual snoring received 1 point. They also received 1 point if they either had frequent insomnia (defined as with a frequency of no less than 1–3 times/week) or had frequent midnight waking up (defined as with >2 times each night). Inadequate nocturnal sleep duration (defined as <7 or >9 h/day) was assigned to 1 point. Patients received 1 point if they had an inadequate habitual daytime napping, where the inadequate napping was defined as either no habitual napping or with a napping duration of >60 min each time. Collectively, a sleep pattern was constructed based on summing up all the scores from the individual sleep characteristics. The sleep pattern score ranged from 0 to 5 points, with a higher score indicating worse sleep. A healthy sleep pattern was subsequently defined as having a score of 0 to 1 point, an intermediate pattern with a score between 2 and 3, and a poor pattern with a score of 4–5. These proposed sleep patterns could take into account the combined impact of individual sleep characteristics, and thus have the potential to reflect a more comprehensive and integrated sleep assessment than individual sleep behaviors. 16
Other independent variables included patients’ age, sex, body mass index (BMI), smoking, and drinking. Patients were asked whether they had any prior osteoporotic fracture in the past 5 years. We also collected data on whether the patients consumed any anti-osteoporotic medication before hospitalization, in which the medications included bisphosphonates, selective estrogen receptor modulators, calcitonin, parathyroid hormone, calcium, and/or vitamin D supplementation, among others.
Outcome measure
The study outcome was BMD T score assessed by DXA at the lumbar spine (L1–L4), based on the ISCD (International Society for Clinical Densitometry) recommendation. The same DXA scanner (GE Prodigy, Madison, WI, USA) was used to yield BMD measures for all the included patients. Based on the median T score as the cutoff point, we categorized patients into either high BMD or low BMD group. That is, patients with a BMD value of less than the median were considered as low BMD group, while the remaining patients were in the high BMD group.
Statistical analysis
Mean with standard deviation (SD) and frequency with percentage were used for continuous and categorical data description, respectively. Student’s t test and chi-square test were employed for crude comparison of continuous and categorical variables between high and low BMD groups.
To explore the relationship between sleep pattern and BMD, we first presented results from individual sleep characteristics to justify their face validity (Supplemental Tables 1 and 2), and displayed T scores stratified by different sleep pattern groups (Figure 1). Subsequently, we used multivariable logistic regression model as the primary analysis to assess sleep pattern in relation to risk of low BMD, taking healthy sleep pattern as reference. The association was quantified as odds ratio (OR) and its corresponding 95% confidence interval (CI). We also performed a secondary analysis to investigate the relationship between sleep pattern and continuous BMD T scores by using multivariable linear regression model, where results were shown as beta coefficient and 95% CI. All models were adjusted for age, sex, and BMI.
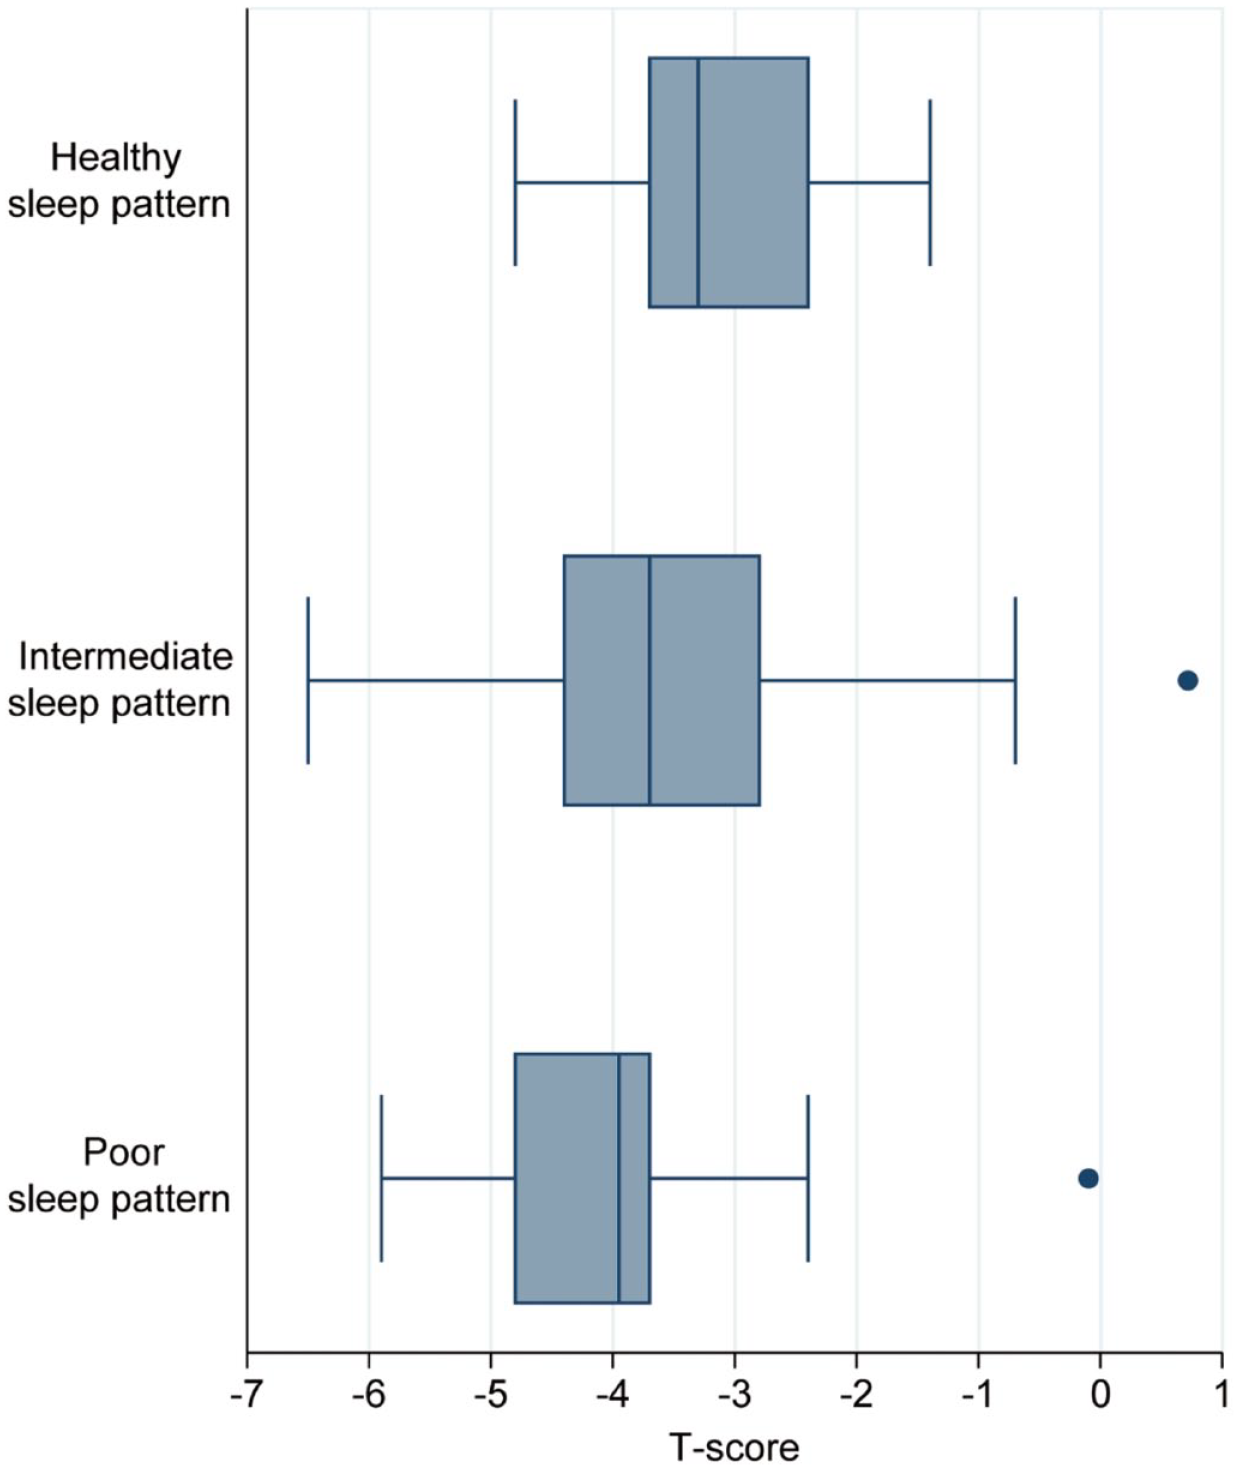
Box plots showing T scores stratified by different sleep pattern groups.
We conducted a sensitivity analysis to test the robustness of main findings by further adjusting for use of anti-osteoporotic medication, history of osteoporotic fracture, smoking, and drinking. The definition of adequate daytime napping remained inconsistent; therefore, as a sensitivity analysis, we used a different habitual napping duration (⩽30 min each time) to define adequate daytime napping and reconstruct the sleep pattern for its relation to risk of low BMD. Given that the points assigned to each individual sleep characteristics were arbitrarily determined, we performed another sensitivity analysis by employing a weighting algorithm to define sleep pattern, in which the total sleep score = (weighting1 * snoring + weighting2 * frequent insomnia + weighting3 * frequent midnight waking up + weighting4 * inadequate sleep duration + weighting5 * inadequate daytime napping) * (5/sum of the five weighting). The individual weighting for each sleep characteristic was identified from the multivariable logistic regression adjusted for age, sex, and BMI to reflect their relative importance. The total weighting sleep score also ranged from 0 to 5, with a higher score implying poorer sleep. We used the minimum p value approach to determine the cutoff points to group the weighting sleep scores into healthy, intermediate, and poor sleep pattern.17,18 First, we identified a total sleep score that had a smallest statistically significant p value in the logistic regression model adjusted for age, sex, and BMI. This step was repeated to select a second statistically significant cutoff point with a minimum p value after holding the first cutoff point fixed. Subsequently, Spearman’s correlation coefficient was used to measure the agreement between the original sleep pattern and the weighting sleep pattern.
We conducted all analyses using the STATA Version 17 (StataCorp, College Station, TX, USA). All tests were two-sided with the significance level of 0.05.
Results
A total of 169 patients with hospitalization due to an osteoporotic fracture were included in this study (Table 1). Their mean age and BMI were 71.91 years (SD: 10.26) and 22.19 kg/m2 (SD: 3.43), respectively. The majority of patients were females (87.57%). The patients had a mean total sleep score of 2.35 (SD: 1.01) and lumbar spine T score of −3.27 (SD: 1.76).
Description of patient characteristics in this study.

BMD, bone mineral density; BMI, body mass index; SD, standard deviation.
Using the median T score as the cutoff point.
Medications included bisphosphonates, selective estrogen receptor modulators, calcitonin, parathyroid hormone, calcium, and/or vitamin D supplementation, among others.
There were three patients whose BMD values were exactly equal to the median BMD of the overall patients. Therefore, these three patients were categorized as having high BMD, resulting in a total of 86 in the high BMD group and 83 in the low BMD group. When compared with patients with high BMD, those with low BMD were more likely to be females, have larger sleep scores, and a smaller BMI (p < 0.05). Table 1 also shows comparisons of individual sleep characteristics between high and low BMD groups; however, no significant difference was found.
Supplemental Table 1 displays the relationship between individual sleep characteristics and the risk of low BMD, with all the ORs of >1. Based on the total sleep scores, there were 36 (21.30%), 107 (63.31%), and 26 (15.38%) patients categorized as having healthy, intermediate, and poor sleep pattern, respectively. Figure 1 shows T scores stratified by sleep pattern groups: −2.78 (SD: 1.77) for healthy, −3.32 (SD: 1.76) for intermediate, and −3.77 (SD: 1.66) for poor sleep pattern. There was a significant trend toward lower BMD ranging from healthy to poor sleep pattern (p = 0.029). Table 2 presents the association between sleep pattern and risk of low BMD. No significant relationship between intermediate sleep pattern and BMD was detected compared with healthy pattern: OR = 1.72 (95% CI: 0.74, 3.97), p = 0.21. When compared with healthy sleep pattern, a significant relationship between poor pattern and increased risk of low BMD was observed: OR = 3.50 (95% CI: 1.10, 11.14), p = 0.034. Results from secondary analysis using multivariable linear regression revealed that poor and intermediate sleep pattern had lower T score than healthy pattern; however, the differences were not significant.
Results from multivariable regression analysis for the relationship between sleep pattern and BMD.

BMD, bone mineral density; 95% CI, 95% confidence interval.
Models adjusted for age, sex and body mass index; there were 86 and 83 patients categorized in the high and low BMD group, respectively.
Results shown as adjusted odds ratios for multivariable logistic regression and beta coefficients for multivariable linear regression analysis.
There were 36 (21.30%), 107 (63.31%), and 26 (15.38%) patients categorized as having healthy, intermediate, and poor sleep pattern, respectively.
Table 3 shows sensitivity analysis results for sleep pattern in relation to risk of low BMD. Results were largely in line with the main findings, with significantly increased (ORs ranging from 3.31 to 3.70) and nonsignificantly higher (ORs ranging from 1.25 to 1.65) risks of low BMD in poor and intermediate sleep pattern, respectively, when compared with healthy pattern.
Results from sensitivity analyses for the relationship between sleep pattern and BMD.

BMD, bone mineral density; 95% CI, 95% confidence interval; OR, odds ratio.
There were 86 and 83 patients categorized in the high and low BMD group, respectively.
Models adjusted for age, sex, body mass index, use of anti-osteoporotic medication, history of fragility fracture, smoking, and drinking; there were 36 (21.30%), 107 (63.31%), and 26 (15.38%) patients categorized as having healthy, intermediate, and poor sleep pattern, respectively.
There were 35 (20.71%), 106 (62.72%), and 28 (16.57%) patients grouped as having healthy, intermediate, and poor sleep pattern, respectively; Spearman’s correlation coefficient with sleep pattern defined by original algorithm: r = 0.75 (p < 0.001).
The cutoff points were 0.89 and 2.93; there were 42 (24.85%), 108 (63.91%), and 19 (11.24%) patients grouped as having healthy, intermediate, and poor sleep pattern, respectively; Spearman’s correlation coefficient with sleep pattern defined by original algorithm: r = 0.79 (p < 0.001).
Discussion
In this study, we explored the association between sleep pattern and BMD in elderly patients with osteoporotic fracture. It was found that the majority of patients had intermediate or poor sleep pattern. When compared with healthy pattern, poor sleep pattern was significantly related to increased risk of low BMD. Results from secondary and sensitivity analyses supported the robustness of main findings.
Several hypotheses had been proposed to interpret the relationship between sleep and bone health including biological modulation related to circadian rhythm, inflammation, and sympathetic nervous system.9,19–21 Moreover, a poor sleep pattern may generally be associated with comorbidities and unhealthy lifestyles, which could also partially explain the link between sleep pattern and BMD.22,23 There were a sizable of published studies exploring sleep characteristics in relation to BMD. Our study was in general consistent with previous research that inadequate sleep duration (including nocturnal sleep time and daytime napping)6,10,24 and impaired sleep quality (including snoring, midnight waking up, and insomnia)9,25–27 were associated with reduced bone health. There were intrinsic joint associations between individual sleep characteristics; for instance, poor sleep quality may either result from or lead to inadequate sleep duration. More specifically, one study reported that daytime napping could compensate for poor sleep quality and short nighttime sleep duration, while poor quality or short nocturnal sleep duration may require daytime napping. 28 Therefore, integrating individual sleep characteristics into a sleep pattern may provide a more comprehensive assessment of sleep in relation to bone health. However, to the best of our knowledge, most previous studies did not explore the sleep pattern in the osteoporosis literature. While the Pittsburgh Sleep Quality Index (PSQI) had been widely used in the sleep research, 29 the amount of time required for completion may compromise its use in real-world research. Therefore, a simplified sleep pattern may have the potential to enhance the acceptability and applicability in the osteoporosis research. Nevertheless, further evidence on the comparison between PSQI and sleep pattern is needed to justify the validity and generalizability of sleep pattern.
One Thai study explored the daytime napping in relation to BMD in elderly women without osteoporosis, with a negative association reported. 10 Wang et al. 30 observed that postmenopausal women with noontime napping of >60 min had a significantly higher risk of osteoporosis when compared with those without noontime napping (OR = 1.37, 95% CI: 1.06, 1.76). Unlike their findings, we found adequate daytime napping was significantly related to decreased risk of low BMD (OR = 1.11 and beta = −0.28 for those without adequate daytime napping; Supplemental Tables 1 and 2). Part of the interpretation may be due to the difference in the populations. While the previous studies either focused on postmenopausal women or elderly people without osteoporosis, our included participants were elderly patients with hospitalization because of an osteoporotic fracture. Therefore, adequate daytime napping may help enhance bone metabolism and alleviate bone loss in our frailer and older study population. However, more prospective and well-designed studies would be required to clarify whether daytime napping is beneficial to bone health in the frail elderly participants with osteoporosis.
There had been several prospective cohort studies reporting significant association between sleep pattern and risk of cardiovascular disease, mental health, and diabetes mellitus.14–16,31 A sleep pattern that could incorporate information from both sleep duration and quality may help with chronic disease risk management in the elderly, especially taking into account its high convenience and short time to complete the data collection. Individual sleep characteristic may not impose a significant impact on bone health, in which a nonsignificant association between individual sleep characteristic and risk of low BMD was observed. However, sleep pattern with the cumulative and combined effect of individual sleep characteristics showed a prominent association with bone health, providing new insights into promoting a healthy sleep pattern for osteoporosis management in the elderly from a public health perspective. Likewise, treating sleep pattern as a composite of sleep characteristics may be an alternative option for data manipulation and analysis in clinical research aiming to assess sleep in relation to outcomes, especially for those with small sample size and insufficient statistical power.
Study strengths and limitations
This study has some merits including assessing sleep as a pattern, sound methodology, and robust analysis. The construction of sleep pattern was evaluated and justified by results from individual sleep characteristics in relation to BMD and different T scores stratified by the sleep pattern groups, and by using different algorithms. Nevertheless, our data should be interpreted with caution. The cross-sectional design could not explore the causal association between sleep pattern and BMD. The data on BMD were only used for the lumbar spine T scores, while information on total body or femoral neck BMD was available. Moreover, the sample size precluded us from further investigation of subgroup or exploratory analyses. Likewise, the association between poor sleep pattern and low BMD when compared with healthy sleep pattern should be interpreted carefully, due to the small sample sizes of patients in healthy (n = 36) and poor (n = 26) sleep pattern groups. The potentially unmeasured or residual confounding and biases could not be excluded from an observational study, in which, for example, the inverse relationship between poor sleep pattern and BMD may be driven by other unquantified factors associated with metabolic dysfunction, comorbidities, or unhealthy lifestyles. Similarly, while patients with chronic pain and/or undiagnosed osteoporotic vertebral fractures were more likely to have a low BMD and a poor sleep pattern, data on chronic pain were not collected and osteoporotic vertebral fractures could not be accurately captured in this study, weakening the validity of the study results. Furthermore, we included the elderly patients with hospital admission due to an osteoporotic fracture; therefore, the findings may not be generalized to the elderly people with osteoporosis. More well-designed research, especially prospective cohort studies, is required to further evaluate and clarify the sleep pattern in relation to BMD after taking the aforementioned concerns into account.
Conclusion
Our study demonstrated that the majority of elderly patients with osteoporotic fracture had unhealthy sleep pattern. Poor sleep pattern was significantly related to decreased BMD when compared with healthy pattern. These findings from the perspective of sleep pattern may help with osteoporosis management in the elderly for the public health and clinical research. Further high-quality evidence is needed to assess and validate the relationship between sleep pattern and risk of low BMD in the elderly.
Supplemental Material
sj-docx-1-tae-10.1177_20420188221106884 – Supplemental material for Relationship between sleep pattern and bone mineral density in patients with osteoporotic fracture
Supplemental material, sj-docx-1-tae-10.1177_20420188221106884 for Relationship between sleep pattern and bone mineral density in patients with osteoporotic fracture by Haobin Zeng, Likang Li, Bo Zhang, Xu Xu, Guowei Li and Maoshui Chen in Therapeutic Advances in Endocrinology and Metabolism
Footnotes
Acknowledgements
We thank all the included participants in this study. We also acknowledge Dr Junguo Zhang and Miss Wanlin Wu for their help with data collection.
Ethics approval and consent to participate
This study was approved by the Guangdong Second Provincial General Hospital Ethics Committee (reference no. 20190717-02-YXKXYJ-KT) and all patients provided written informed consent.
Consent for publication
N/A
Author contribution(s)
Funding
The authors disclosed receipt of the following financial support for the research, authorship, and/or publication of this article: This study was financially supported by the Science and Technology Program of Guangzhou (Grant sponsor: Dr Guowei Li; Grant no. 202002030252), the Science Foundation of Guangdong Second Provincial General Hospital (Grant sponsor: Dr Guowei Li; Grant no. YY2018-002),
Conflict of interest statement
The authors declared no potential conflicts of interest with respect to the research, authorship, and/or publication of this article.
Availability of data and materials
All data can be available on reasonable request.
Supplemental material
Supplemental material for this article is available online.
References
Supplementary Material
Please find the following supplemental material available below.
For Open Access articles published under a Creative Commons License, all supplemental material carries the same license as the article it is associated with.
For non-Open Access articles published, all supplemental material carries a non-exclusive license, and permission requests for re-use of supplemental material or any part of supplemental material shall be sent directly to the copyright owner as specified in the copyright notice associated with the article.