
Abstract
Background:
The bioassay of thyroid-stimulating immunoglobulin was reported to have a similar performance to the commonly used thyroid-stimulating hormone binding inhibition assay, also known as thyroid receptor antibody assay. The normal reference range of thyroid receptor antibody levels indicates the withdrawal of anti-thyroid drugs in the recent clinical guidelines.
Methods:
A prospective, longitudinal observational study was conducted to evaluate the prognostic value of thyroid-stimulating immunoglobulin in patients with Graves’ disease.
Results:
A total of 77 patients with Graves’ disease treated with anti-thyroid drugs were in a continuous follow-up until 1 year after anti-thyroid drugs discontinuation. Commercial kits of thyroid-stimulating immunoglobulin and M22-thyroid-stimulating hormone binding inhibition assay were used and compared. Thyroid-stimulating immunoglobulin was all negative in healthy controls, Hashimoto thyroiditis, and subacute thyroiditis. Thyroid-stimulating immunoglobulin value was highest in untreated patients with Graves’ disease (p < 0.001). Under anti-thyroid drugs treatment, thyroid-stimulating immunoglobulin value decreased gradually. A total of 21 patients had positive thyroid-stimulating immunoglobulin at the end of treatment. According to clinical fate of patients with Graves’ disease after withdrawal of anti-thyroid drugs, thyroid-stimulating immunoglobulin value and positivity in patients with relapse were significantly higher than that reported in patients with remission (p = 0.001, p < 0.001). After adjustment for age, gender, initial thyroid receptor antibody, initial thyroid-stimulating immunoglobulin, and thyroid receptor antibody at the end of treatment, the odds ratio of positive thyroid-stimulating immunoglobulin for the risk of relapse was 33.271 (95% confidence interval: 4.741–233.458, p < 0.001) and odds ratio of quantitative thyroid-stimulating immunoglobulin was 1.009 (95% confidence interval: 1.002–1.015, p < 0.001).
Conclusion:
Thyroid-stimulating immunoglobulin is a good predictor of relapse in patients with Graves’ disease treated with anti-thyroid drugs. It might be safer to discontinue anti-thyroid drugs when thyroid-stimulating immunoglobulin and thyroid receptor antibody were both negative.
Keywords
Background
Graves’ disease (GD) is a common organ-specific autoimmune disease caused by the circulating antibodies to thyroid-stimulating hormone receptor (TSHR). 1 Circulating TSHR antibodies (TRAb) is a group of heterogeneous antibodies that comprises TSHR-stimulating antibody (TSAb), TSHR blocking antibody (TBAb), and neutral or cleavage antibody. TSAb and TBAb exert different immunochemical properties through the recognition of different epitopes, although with some overlapping on TSHR.2,3 And different concentrations of TSAb and TBAb are responsible for the phenotype of GD in clinic. TRAb measured by thyroid-stimulating hormone (TSH) binding inhibition assays (TBII) is the most common indicator to differentiate the etiology of thyrotoxicosis when thyroid radioactive iodine uptake (RAIU) is unavailable or contraindicated.4,5 However, TBII for TRAb measurement failed to distinguish between TSAb and TBAb. Bioassays that detect the increased or inhibited cAMP production in cell lines may overcome the limitation of TBII. A commercial kit Thyretain comprises Chinese hamster ovary (CHO) cells transfected with a chimeric TSHR, wherein a TBAb epitope on the C-terminal portion is replaced with 73 amino acid residues from the rat luteinizing hormone (LH) receptor (Mc4) that specifically detects TSAb without any interference from TBAb.6–8 In theory, TSAb measurement should be more specific in the diagnosis of GD. It was documented that the clinical diagnostic performance of thyroid-stimulating immunoglobulin (TSI) showed high and similar clinical effectiveness to that of TBII for diagnosing GD.9,10
Three commonly used treatment options are available for patients with GD, including medications, RAI therapy, and thyroidectomy. 11 Medications such as anti-thyroid drugs (ATDs) are preferred by many patients and physicians, owing to the advantages of convenience and non-invasiveness. 12 However, the relapse rate reported in patients with GD was high after the discontinuation of ATDs.13,14 Hence, an easy and specific indicator that predicts relapse in patients with GD is desirable. Studies suggested that younger age, smoking, male, pregnancy, thyroid gland size, and high titers of TRAb at the end of therapy were associated with a high relapse rate after treatment with ATDs.15–17 Patients with high titers of TRAb after the discontinuation of medication may face the risk of experiencing new hyperthyroidism and GD relapse.18,19 Around 20% of patients are known to experience relapse even with low titers of TRAb. Given specific detection of TSAb, TSI bioassay may be more useful in the management of patients with thyrotoxicosis. Some studies have evaluated and compared the efficacy of TSI and TBII in the management of patients of GD treated with ATDs.20–22 The normal reference range of TRAb levels indicates the withdrawal of ATD in the recent clinical guidelines. 5 The predictive value of TSI in patients with GD who discontinued ATD with negative TRAb value has not been documented. Furthermore, the prognostic value of TSI for the management of GD in Chinese patients has not been documented.
In this study, we compared the results of TSI bioassay and TRAb (using M22-TBII) to investigate the prognostic value of TSI from a follow-up group of patients with GD who received ATD treatment.
Methods
Study population
Participants in our study were recruited from Ruijin Hospital affiliated with Shanghai Jiao-tong University Medical School from March 2013 to May 2016 in this longitudinal observational study. Patients with new-onset GD (first diagnosed and receiving no therapy) were recruited, provided with ATD therapy, and followed up. All participants in the study recieved ATD as part of routine care. Serum TRAb concentration and TSI were measured and compared at the time of GD diagnosis (untreated), GD undertreatment, and GD at the end of treatment. The diagnosis of GD was made according to the standard criteria including clinical symptoms, increased serum concentrations of free thyroxine (FT4) and free triiodothyronine (FT3), decreased basal thyrotropin (TSH), positive TRAb, or diffusely increased thyroid RAIU when available. All patients with GD in our study were provided with ATD therapy. Under ATD treatment, patients were consecutively followed up at the endocrinology outpatient clinic in Ruijin Hospital. ATD treatment was discontinued when thyroid hormone concentrations were within the normal range and serum TRAb was lower than 1.75 IU/l twice in succession. 5 After discontinuation of ATD, patients with GD were continued to follow up every 3 months. According to the clinical fate of patients with GD after withdrawal of ATD within 12 months, patients were divided into two groups, a group without relapse and another group with relapse. Patients were considered to have relapsed if FT4 level was above the normal range, TSH level was low, or TRAb level was above 1.75 IU/l within 1 year. (The follow-up protocol was summarized in supplemental Figure 1.) A total of 112 participants were initially enrolled, 25 participants were excluded due to withdrawal from the follow-up procedure, 8 participants were excluded due to side effects of ATDs, and 2 participants were excluded due to pregnancy. Finally, 77 participants were analyzed in our study.
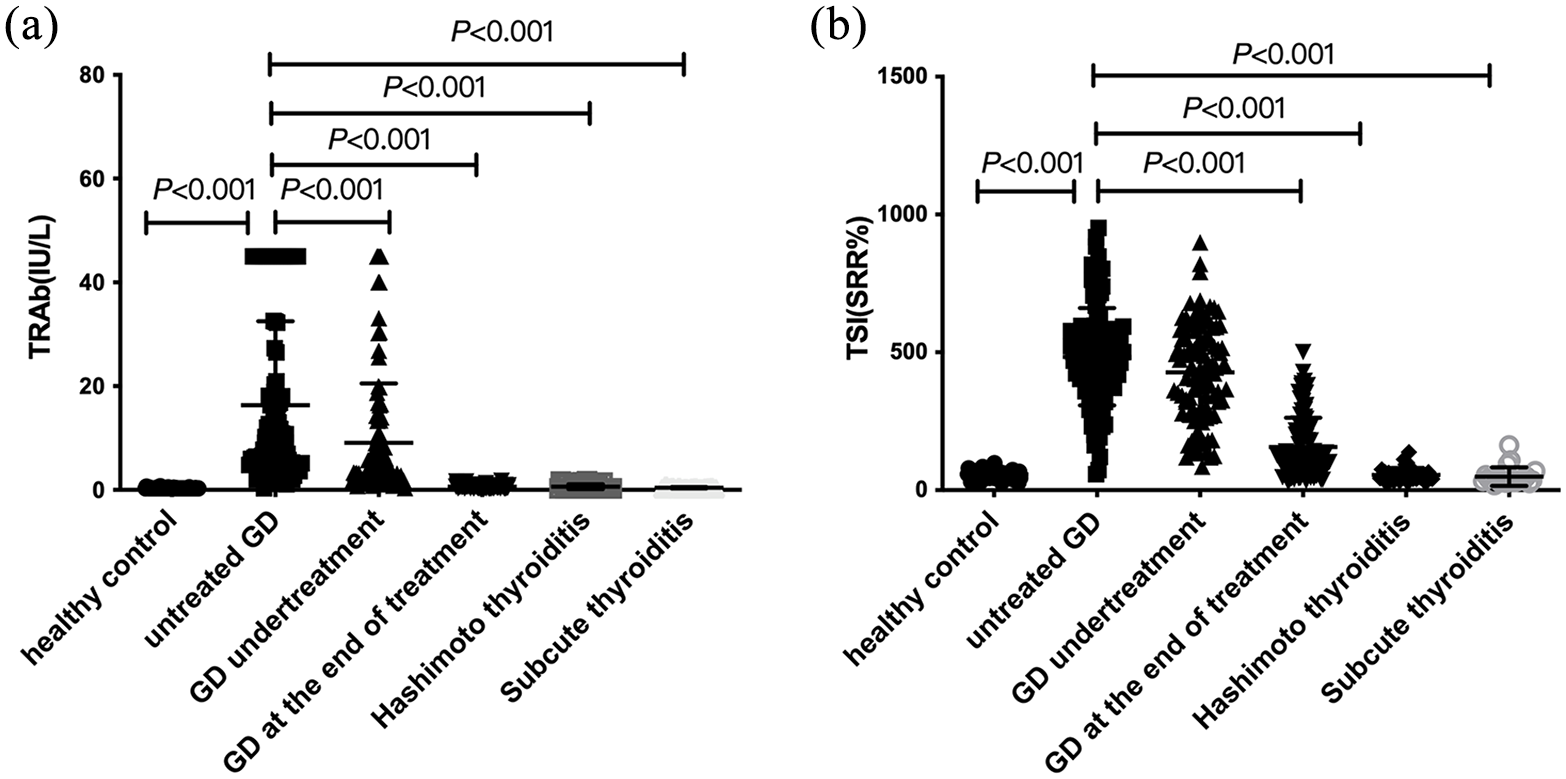
Comparison analysis of TSH-binding inhibition assay and thyroid-stimulating immunoglobulin (TSI) in healthy control and different etiologies of thyrotoxicosis. According to thyroid function and treatment, patients were divided into untreated GD group (new-onset), GD undertreatment group, and GD at the end of treatment. (a) TRAb titers using TSH-binding inhibition assay and (b) thyroid-stimulating immunoglobulin (TSI) values in healthy control and different etiology of thyrotoxicosis. p values were calculated by Mann–Whitney U test.
To validate the diagnostic efficacy of TSI bioassay in GD, we recruited healthy controls, Hashimoto thyroiditis, and subacute thyroiditis. Healthy controls were subjects with no personal and family history of thyroid disease, normal thyroid ultrasound imaging, normal thyroid function, and negative results for antibodies to thyroid peroxidase (TPOAb), thyroglobulin autoantibodies (TgAb), and TRAb. Hashimoto thyroiditis was diagnosed based on an increase of at least fivefold in the serum level of antibodies to TPOAb with or without TgAb, a heterogeneous hypoechoic pattern in thyroid ultrasound imaging, negative TRAb and, when available, a decrease in thyroid RAIU. Subacute thyroiditis was diagnosed based on clinical findings of severe neck pain and fever, elevated erythrocyte sedimentation rates (ESR), and low thyroid RAIU. All patients with Hashimoto thyroiditis or subacute thyroiditis enrolled in our study were all with increased serum concentrations of FT4 and FT3 and decreased basal TSH in serum. Thyroid function, TRAb, and TSI were measured at diagnosis. Patients with Hashimoto thyroiditis, subacute thyroiditis, and healthy control were not included in the follow-up program. Exclusion criteria were as follows: younger than 18 years old, prior treatment with surgery or radiotherapy, pregnant and lactating women, and subjects with other autoimmune diseases.
This study was conducted according to the Declaration of Helsinki and was approved by the Institutional Review Board of the Ruijin Hospital, Shanghai Jiao Tong University School of Medicine with the ethics committee approval ID 2011 (14). Written informed consent was obtained from each participant.
Thyroid function and antibody tests
Serum TSH, FT3, FT4, TPOAb, and TgAb were measured by automated chemiluminescent immunoassays (Architect i2000SR; Abbott Laboratories, Chicago, IL). The laboratory reference ranges provided by the manufacturer were used in this study: TSH 0.35–4.94 μIU/ml, FT4 9.01–19.04 pmol/l, FT3 2.63–5.70 pmol/l, TPOAb <5.61 IU/ml, and TgAb <4.11 IU/ml. Serum levels of TRAb were measured by electro-chemiluminescence immunoassays (Cobas 601 analyzer, Roche Diagnostics) with a suggested cutoff value of 1.75 IU/l.
TSI bioassay
Serum was collected from each patient and stored in sterilization EP tubes at −80°C. After that, serum samples were transferred to the laboratory for centralized measurements by skilled technicians who were unfamiliar with the design of the study. TSI was measured with the Thyretain bioassay (Quidel, CA, USA) according to the manufacturer’s instructions. 18 The results were reported as a percentage of specimen-to-reference ratio (SRR%). SRR% values were calculated according to the following formula: SRR% = [Average specimen relative light unit (RLU)/average reference control RLU] × 100. The percentage coefficient variation (CV%) was calculated according to the formula: CV% = (SD RLU specimen/Average Test RLU) × 100. The assay cutoff for SRR% provided by the manufacture is 140%. All tests were performed in triplicate.
Statistical analysis
All statistics were analyzed using SPSS Statistics v19.0 (SPSS, Inc.) and p values < 0.05 were considered significant. We summarized demographic and laboratory characteristics as medians for continuous variables, or numbers and percentages for categorical variables. Statistical difference was evaluated using Mann–Whitney U test for non-normally distributed variables. The chi-square test or Fisher’s exact test was used to test for categorical variables. Logistic regression analysis was carried out to evaluate the odds ratio (ORs) and 95% confidence interval (95% CIs) of relapse in quantitative and positive TSI group compared with negative TSI group.
Results
Comparison of TRAb and TSI in different etiologies of thyrotoxicosis
A total of 77 patients with untreated GD, 36 Hashimoto thyroiditis, 17 subacute thyroiditis, and 63 healthy controls were analyzed to validate the diagnostic value of TSI. The general characteristics of the study population are shown in Table 1. FT3, FT4 were highest and TSH was lowest in patients with untreated GD. TRAb titers in all participants are shown in Figure 1(a) and TSI values are shown in Figure 1(b). Both TRAb and TSI values were highest in the untreated GD than in healthy controls and patients with Hashimoto thyroiditis and subacute thyroiditis (all p < 0.001). The values of TSI were positive for patients with untreated GD (median SRR, 25% and 75% percentiles: 466.58%, 358.14% and 547.60%). TSI values were all negative for patients with Hashimoto thyroiditis (median SRR, 25% and 75% percentiles: 48.68%, 40.12% and 65.48%), and subacute thyroiditis (median SRR, 25% and 75% percentiles: 36.4%, 31.00% and 45.85%), as well as the healthy control (median SRR, 25% and 75% percentiles: 57.95%, 49.97% and 64.98%). TSI values gradually decreased with ATD treatment in patients with GD (Figure 1(b) and supplemental data). TSI value (median SRR, 25% and 75% percentiles: 416.98%, 278.66% and 543.23%) for patients with GD under treatment and (median SRR, 25% and 75% percentiles: 98.99%, 53.17% and 139.86%) for patients with GD at the end of treatment. TSI value for patients with GD at the end of treatment was significantly lower than patients with untreated GD (p < 0.001).
Clinical characteristics of the study population.

CV, coefficient variation; GD, Graves’ disease; RLU, relative light unit; SRR, specimen-to-reference ratio; TgAb, thyroglobulin autoantibodies; TPOAb, antibodies to thyroid peroxidase; TRAb, thyrotropin receptor antibody; TSH, thyroid-stimulating hormone; TSI, thyroid-stimulating immunoglobulin.
SRR% and CV% were calculated according to the manufacturer’s formula; SRR% = [Average specimen RLU/average reference control RLU] × 100. CV% = (SD RLU specimen/Average Test RLU) × 100. compared to healthy control.
p < 0.05; compared to untreated GD.
p < 0.05; compared to Hashimoto thyroiditis.
p < 0.05; compared to subacute thyroiditis.
p < 0.05; p value was calculated by Mann–Whitney U test.
The association of TSI with the risk of relapse in patients with GD
To investigate the association of TSI value with the risk of relapse in patients with GD, 77 patients were continued to follow up till discontinuation of ATD. A total of 77 (18 males and 59 females) patients with GD discontinued ATD treatment when serum TRAb was 1.75 IU/l or less twice in succession and thyroid hormone concentrations were within the normal range. In total, 70 (90.9%) patients were treated with methimazole and 7 (9.1%) patients were treated with propylthiouracil. A total of 21 (27.3%) patients were positive for TSI measurement at the end of treatment and 19 (24.7%) patients showed relapse within 12 months after ATDs discontinuation.
According to the clinical fate of patients with GD after withdrawal of ATD within 12 months, patients were divided into two groups, a group without relapse and another group with relapse. Their clinical characteristics are summarized in Table 2. Age and thyroid function parameters at the end of treatment, including TSH, FT3, and FT4, showed no significant difference between these two groups. Also, no significant difference was observed in the TRAb level before treatment and at the end of treatment. The average ATDs therapy duration showed no significant difference between patients with relapse and patients with remission (15.14 ± 7.56 months for relapsed patients and 16.62 ± 5.83 months for patients with remission, p = 0.467). However, the TSI level at the end of treatment was significantly higher in the relapse group (p = 0.001) but showed no significant difference from the value reported during diagnosis. Of 19 patients with relapse, 13 patients were positive for TSI at the end of treatment and 6 patients were negative for TSI. As shown in Figure 2(a), the relapse rate was significantly higher in the positive TSI group than in the negative TSI group [61.9% (13/21) versus 10.71% (6/56) respectively, p < 0.001]. Based on the cutoff value of SRR 140%, positive predictive value (PPV) and negative predictive value (NPV) for TSI in the relapse group was 61.9% (13/21) and 89.28% (50/56), respectively. As patients in our study were all TRAb negative (the cutoff value for TRAb <1.75 IU/l) upon ATD discontinuation, PPV and NPV for TRAb in the relapse group was 0% (0/77) and 75.32% (58/77), respectively.
Clinical data of patients with Graves’ disease with or without relapse at the end of treatment.

ATD, anti-thyroid drugs; CV, coefficient variation; GD, Graves’ disease; RLU, relative light unit; SRR, specimen-to-reference ratio; TRAb, thyrotropin receptor antibody; TSH, thyroid-stimulating hormone; TSI, thyroid-stimulating immunoglobulin.
SRR% and CV% were calculated according to the manufacturer’s formula; SRR% = [Average specimen RLU/average reference control RLU] × 100. CV% = (SD RLU specimen/Average Test RLU) × 100. p value was calculated by Mann–Whitney U test. The boldface in the table shows the statistical difference of the TSI value and the number of positive TSI between each group.

Higher relapse rate in positive thyroid-stimulating immunoglobulin (TSI) group at the end of anti-thyroid treatment in patients with Graves’ disease. (a) Relapse rate in positive and negative thyroid-stimulating immunoglobulin (TSI) group, respectively. p value was calculated by a chi-square test; (b) the change of TSI from the end of treatment to 1 year after stopping medication in Graves’ disease patients with relapse (n = 4) or with remission (n = 11) at the end of treatment.
To analyze the longitudinal TSI measurements in patients with relapse or with remission, we plotted TSI values at the time of ATD withdrawal and 1 year after ATD withdrawal (Figure 2(b)) and found that TSI values significantly decreased only in remission patients. On the contrary, TSI values increased in patients with relapse.
Logistic regression analysis of quantitative or positive TSI and relapse
After adjustment for age, gender, TRAb at diagnosis, TSI at diagnosis, and TRAb at the end of treatment, the odds ratio (OR) of TSI positivity (SRR > 140%) at the end of treatment for the risk of relapse was 33.271 (95% CI: 4.741–233.458, p < 0.001) and OR of quantitative TSI was 1.009 (95% CI: 1.002–1.015, p = 0.008) (Table 3).
Association of TSI measurement with relapse in Graves’ patients treated with anti-thyroid drugs.
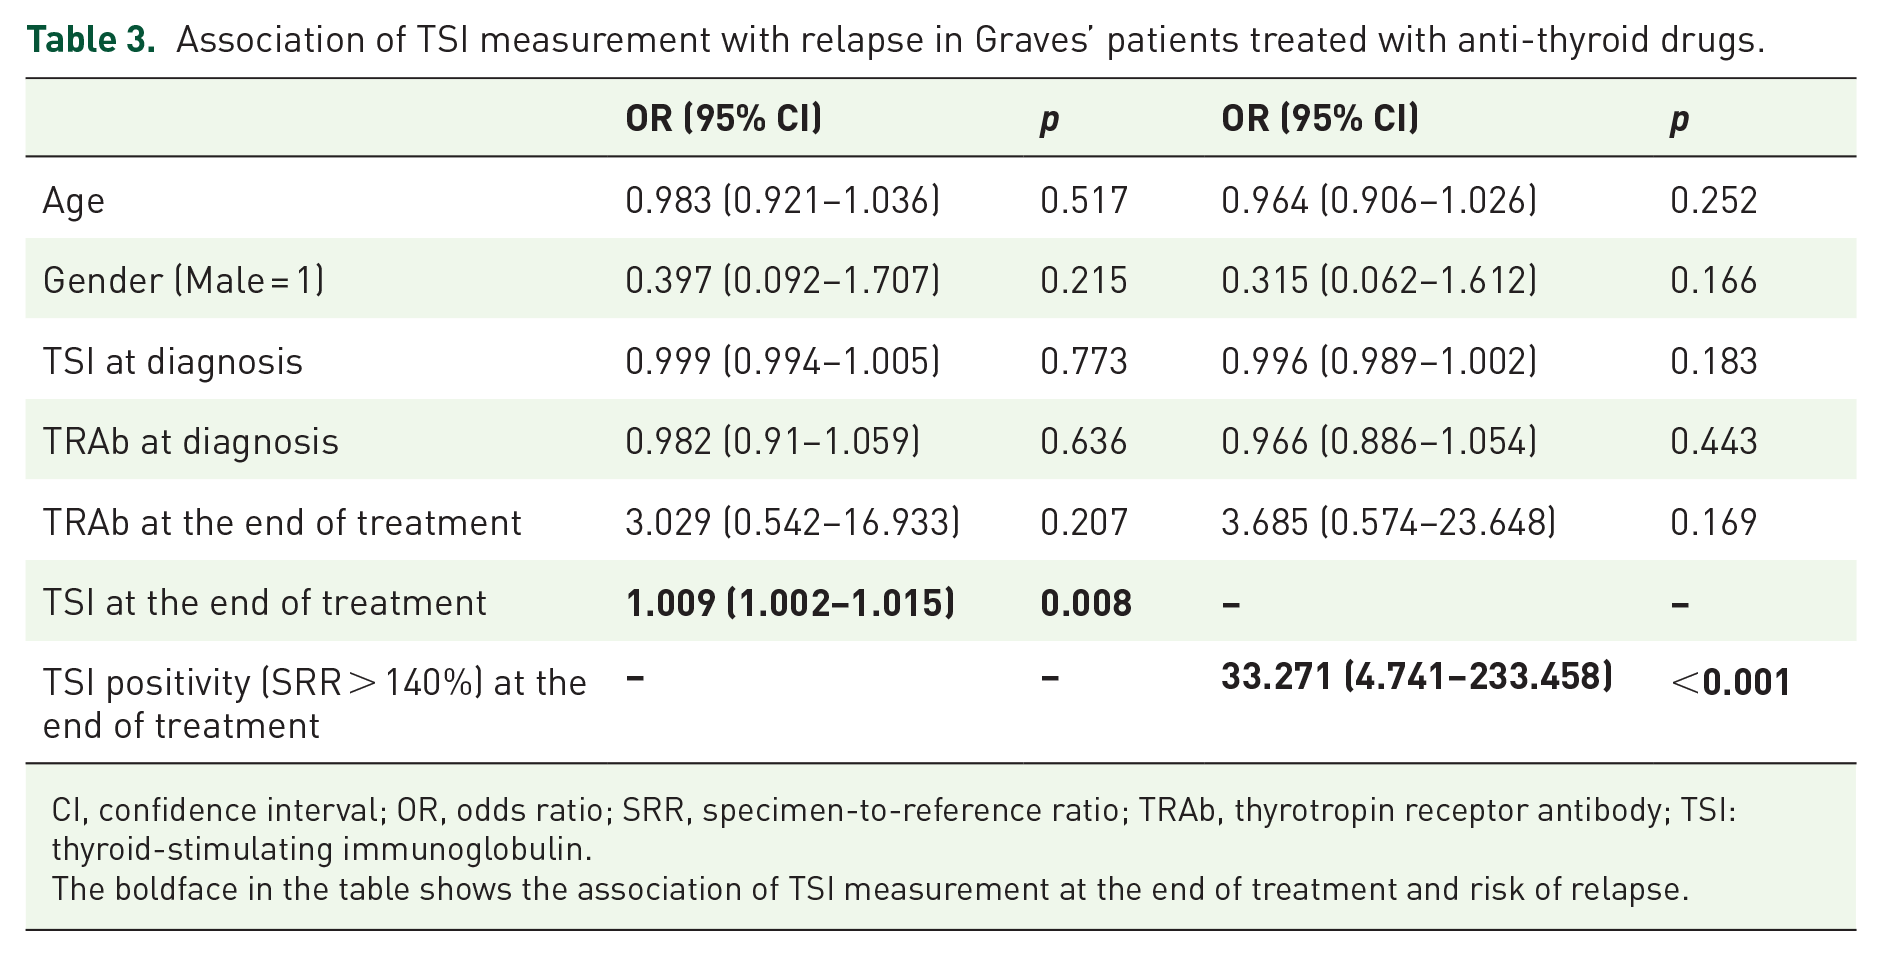
CI, confidence interval; OR, odds ratio; SRR, specimen-to-reference ratio; TRAb, thyrotropin receptor antibody; TSI: thyroid-stimulating immunoglobulin.The boldface in the table shows the association of TSI measurement at the end of treatment and risk of relapse.
Discussion
In this study, we screened patients with common etiologies of thyrotoxicosis. We found that TSI exhibits high sensitivity and specificity as TBII in patients with GD. The accurate diagnostic efficacy of TSI in patients with GD was also reported in previous literature.2,8–10,23,24
Besides, the analysis of TSI level after medication in a follow-up group of patients with GD revealed the correlation between TSI and relapse. Studies have been performed to investigate if TSI may predict relapse or remission after ATD therapy and better sensitivity and specificity have been reported. In a retrospective study conducted in 92 patients with GD who were treated with ATD in Korea, M22-TBII and Mc4-TSAb titer and positivity were significantly higher than in those with remission. 21 Based on the manufacturer’s cutoff value (1.75 IU/l for M22-TBII and 140% for Mc4-TSAb), two assays showed similar sensitivities, specificities, NPV, and PPV. However, higher sensitivity (85%) and PPV (69%) were reported with a higher Mc4-TSAb cutoff value (230%) than with the best M22-TBII cutoff value. In another 5-year follow-up prospective study conducted in 55 patients with GD, TSI (Thyretain) has a trend toward improved negative predictive value (82.6 versus 81.8% and 76.9%) and sensitivity (80 versus 77.8% and 70%) comparing Mc4, and M22 assays, respectively. 20 Before the availability of the commercial kit for Mc4-TSAb bioassay, TRAb measurement at the end of ATD therapy was considered as a useful indicator of relapse rate in patients with GD. Thus, ATD was recommended to be discontinued if TSH and TRAb levels decreased to the normal reference range reported in the recent clinical guidelines. 5 A retrospective analysis conducted in patients with GD to compare the prognostic value of TBII and TSI at ATD withdrawal (ATD were stopped irrespective of TRAb positivity in this study) showed that TSI could predict the relapse of GD. 22 However, the predictive value of TSI in patients who discontinued ATD and displayed negative TRAb value has not been documented. In our study, we followed up patients with GD until 1 year after ATD withdrawal and analyzed TSI performance in patients with relapse. TSI value and positivity at the end of treatment were significantly higher in patients with relapse than in patients with remission. TSI showed a predictive value of relapse in the GD group, with 61.9% PPV and 89.28% NPV when TRAb has lost its positive predictive value. Our data suggest that the clinical fate of relapse or remission in patients with GD after the withdrawal of ATD therapy may be predicted from the trend of TSI values, as confirmed from the logistic regression analysis. After adjustment for age, gender, TRAb at diagnosis, TSI at diagnosis, and TRAb at the end of treatment, we found that quantitative TSI and TSI positivity are independent predictors of relapse in patients with GD. These results indicated that approximately 20% of GD patients with negative TRAb turned into relapse, and the majority of these patients are with positive TSI, which suggsted ATD treatment should be prolonged for positive TSI patients.
Through the expression of Mc4 TSHR chimera in CHO cells, TSI (ThyretainTM) was reported to be more specific in detecting TSAb and may detect lower titers of TRAb. The analytical performance of TSI and TBII assays by serial dilution of certain sera found that TSI was positive at a dilution of 1:300, suggesting that TSI bioassay may detect lower levels of TSHR autoantibodies. 25 The presence of TSI may serve as the best predictor of relapse or remission in patients with GD following ATD therapy withdrawal. A minority of patients with positive TSI values at the end of ATDs therapy showed no relapse. We evaluated the tendency of TSI and found that TSI level would gradually decrease in those patients with GD with remission and TSI level would significantly increase in patients with GD with relapse. In other words, withdrawal of ATD when TSI was negative might be safer and would significantly reduce the rate of relapse in patients with GD.
The strengthening of our study was that we investigated the prognostic value of TSI measurement in patients with GD who discontinued ATD therapy with negative TRAb. It was a prospective, longitudinal observational study. All patients with GD were subject to ATD treatment and were in continuous follow-up. The limitations were that study cohort was small and the follow-up time after withdrawing from ATD treatment was only 12 months. And the results only refer to the assays used to measure TBII/TSI in our study.
Conclusion
In conclusion, our study analyzed the prognostic value of TSI bioassay in patients with GD who received ATD therapy. We demonstrated that TSI exerted advantages in the management of GD and serves as a good predictor of relapse in patients with GD who discontinued ATDs with TRAb. Withdrawal of ATD when TSI and TRAb were both negative could significantly reduce the risk of relapse.
Supplemental Material
sj-docx-1-tae-10.1177_20420188211044943 – Supplemental material for The prognostic value of thyroid-stimulating immunoglobulin in the management of Graves’ disease
Supplemental material, sj-docx-1-tae-10.1177_20420188211044943 for The prognostic value of thyroid-stimulating immunoglobulin in the management of Graves’ disease by Yulin Zhou, Mengxi Zhou, Yicheng Qi, Weiqing Wang, Xinxin Chen and Shu Wang in Therapeutic Advances in Endocrinology and Metabolism
Footnotes
Acknowledgements
We thank all participants in our study. Authors Y.Z. and M.Z. contributed equally to this manuscript.
Author contributions
All authors contributed to the study’s conception and design. Material preparation, data collection, and analysis were performed by XC, YZ, MZ, and YQ. Patient recruitments were performed by XC, YZ, MZ, WW, and SW. The first draft of the manuscript was written by XC and all authors commented on previous versions of the manuscript. All authors read and approved the final manuscript.
Conflict of interest statement
The authors declared no potential conflicts of interest with respect to the research, authorship, and/or publication of this article.
Funding
The authors disclosed receipt of the following financial support for the research, authorship, and/or publication of this article: This work was supported by the National Natural Sciences Foundation of China Grants (81570707, 81800693, and 81900714).
Supplemental material
Supplemental material for this article is available online.
References
Supplementary Material
Please find the following supplemental material available below.
For Open Access articles published under a Creative Commons License, all supplemental material carries the same license as the article it is associated with.
For non-Open Access articles published, all supplemental material carries a non-exclusive license, and permission requests for re-use of supplemental material or any part of supplemental material shall be sent directly to the copyright owner as specified in the copyright notice associated with the article.