
Abstract
Background:
Over recent years, some researchers believe that diabetic nephropathy (DN) and diabetic retinopathy (DR) both independently increase the incidence of brain diseases, such as stroke, cerebral infarction, and cerebral hemorrhage. In the present study, we used the voxel-wise degree centrality (DC) method to investigate potential changes of functional network brain activity in patients with DN and retinopathy (DNR).
Methods:
Twenty DNR patients (9 men, 11 women) and 20 healthy controls (HCs; 9 men, 11 women) were recruited; the controls were matched for age, sex, and educational background. All subjects underwent resting-state functional magnetic resonance imaging. Ophthalmoscopy, renal biopsy and single-photon emission computed tomography were used to evaluate microvascular lesions in the eye and kidney. Data were categorized using receiver operating characteristic curves, and correlation analysis was performed using Pearson’s correlation analysis.
Results:
Compared with HCs, DNR patients showed reduced mean DC values in the right inferior temporal gyrus (RITG) and left subcallosal gyrus regions (LSG) and increased mean DC values in the bilateral precuneus (BP). Moreover, mean DC in the BP was correlated with renal estimated glomerular filtration rate (eGFR; r = 0.762). The area under the curve (AUC) value was 0.829 for BP and 0.839 for RITG and LSG.
Conclusion:
DNR patients showed dysfunction in three different brain regions. The linear correlation between eGFR and mean brain DC values indicates the presence of common diabetic microangiopathy in the brain and kidney, which may provide new ideas for multiorgan microvascular lesions of diabetics.
Introduction
Diabetes mellitus is the leading cause of end-stage renal disease (ESRD) in both developed and developing countries.1–3 Worryingly, the number of cases involving diabetic nephropathy (DN) is expected to continue increasing globally. 4 According to a cross-sectional study, around 30% of diabetics develop DN, even when blood pressure and blood glucose are strictly controlled. 5 Historically, the earliest diagnostic indices for DN have been urinary albumin excretion rates (UAER) and albumin-to-creatinine ratio (ACR). However, results arising from UAER and ACR calculations are heavily influenced by other factors, including hypertension, fever, exercise, heart failure, and urinary tract infection.6,7 A previous study reported that 30–45% of diabetics with microalbuminuria developed DN within a period of 10 years. 8 According to the latest Kidney Disease Outcomes Quality Initiative (KDOQI) clinical practice guidelines, diabetic retinopathy (DR) has been added as a more sensitive indicator to the diagnostic criteria for DN. 9 DR is also a common and serious ocular complication, disturbing 40% of people with type 2 diabetes mellitus (T2DM) in the US. 10 It also remains a major cause of vision loss in western countries. 11 Patients with DR have a 52% increase in serum creatinine level, a 47% increase in the risk of ESRD, and a 33% increase in the risk of mortality compared with those without DR. 12 Nevertheless, some studies have also reported that DN can occur before the onset of DR and therefore acts as a predictor of DR.13,14
Studies have shown that DR patients have abnormal changes in gray-matter volume and abnormal brain activity. 15 The prevalence of diabetes eventually leads to an increasing incidence of complications, including nephropathy, retinopathy, and neuropathy.16–18 Some researchers believe that changes in the brain of DR patients reflect a decline in vision. 19 Besides, cognitive impairment is closely correlated with the DN in T2DM. 20 Other researchers believe that DR and DN increase the incidence of brain diseases, such as stroke, cerebral infarction, and cerebral hemorrhage. 21 However, so far, very little research has been carried out in patients with multiorgan microvascular lesions among brain, retina, and kidney, so we attempt to investigate alterations in brain function of DN and diabetic retinopathy (DNR) patients. In this study, we refer to T2DM patients with both nephropathy and retinopathy as ‘DNR’. We hypothesized that the presence of DNR could indicate a concomitant injury to the brain.
Functional magnetic resonance imaging (fMRI) has long been used to measure spontaneous neural activity in a range of diseases, including Parkinson’s and cerebral apoplexy.22–25 A previous study reported the use of MRI to investigate microstructure of the white matter.26,27 Degree centrality (DC) is a useful magnetic resonance technology that reveals connectivity of the brain network at the voxel level. 28 The definition of DC value is made by calculating the centrality of a node by adding the centrality of adjacent nodes, which can be a brain region or voxel. The higher the score, the greater the center or the importance of nodes in the functional network, because nodes are connected to their own regions with higher central values. DC differs from voxel-mirrored homotopic connectivity (VMHC), 29 and amplitude of low-frequency fluctuation (ALFF) techniques, 30 in that it provides insights into the entire brain at a functional level and exhibits advantages over other methods without defining regions. 31 The DC method has been used to analyze neural network mechanisms in patients with certain diseases, including T2DM and severe obstructive sleep apnea.32,33 In T2DM, the left lingual gyrus showed decreased average DC value, while the right insular lobe and dorsal anterior cingulate cortex showed value increase. 34 In this study, we used the voxel-wise DC method to evaluate its intrinsic centrality of the brain network and study the relationship with clinical manifestations of kidney and retina in DNR patients.
Methods
Study design and subjects
Between July 2017 and October 2018, we enrolled 20 patients with DNR (9 men and 11 women; age, 18–70 years) from the Department of Nephrology and Ophthalmology of the First Affiliated Hospital of Nanchang University. DNR was diagnosed using the following criteria: (a) at least a 5-year history of T2DM; (b) macroalbuminuria (ACR > 300 mg/g) or microalbuminuria (ACR range: 30–300 mg/g); (c) proliferative DR or nonproliferative DR; or (d) pathological examination of the kidney suggested DN. Patients were excluded if they exhibited any of the following: (a) presence of another primary, secondary, or congenital kidney disease (e.g. acute nephritis, chronic nephritis, lupus nephritis, gouty kidney, traumatic renal injury, IgA nephropathy, and renal artery disease); (b) presence of another ocular diseases (c) central nervous system diseases and psychiatric disorders (e.g. depression, bipolar disorder, and mania); and (d) cerebral apoplexy; (e) drug or alcohol abuse; (f) cardiovascular diseases.
A total of 20 healthy controls (HCs; 9 men and 11 women) were also recruited. These controls were matched for age, sex, and educational background. All HCs met the following inclusion criteria: (a) normal brain parenchyma on MRI imaging; (b) no history of neurological disease or mental disorder; (c) no systemic disease; and (d) no renal disease.
Ethical considerations
All methods used in this study complied with the tenets of the Declaration of Helsinki and were approved by the Medical Ethics Committee of the First Affiliated Hospital of Nanchang University (reference number: CDYFY-LY2019029). Prior to signing the informed consent form, all subjects voluntarily agreed to participate and were informed of the purpose and potential risks.
MRI parameters and MRI data processing
All brain MR imaging was acquired using a 3-Tesla MR scanner with 8-channel head coil (Trio, Siemens, Munich, Germany). All participants were asked to remain quiet, close their eyes and remain awake during the MRI scan. Gradient echo planar imaging (EPI) sequence was used to acquire resting-state fMRI data, and T1-weighted three-dimensional MP-RAGE sequence was used to acquire high-resolution brain structure images of each subject. MRI parameters and further information about the sequence are shown in Table 1. All MRI data were first filtered using MRIcro (www.MRIcro.com) and preprocessed using the Data Processing Assistant for Resting-State fMRI (DPARSF, rfmri.org/DPARSF), which is based on Statistical Parametric Mapping (SPM8; www.fil.ion.ucl.ac.uk/spm) and the Resting-state Data Analysis Toolkit (REST, www.restfmri.net). We obtained a total of 240 volumes. The first 10 volumes of MRI data may be affected by instability of scanners and adaptation of subjects to the surroundings, so we discarded the corresponding data. We collected and corrected the remaining 230 volumes for variation in slice acquisition times. Realignment was then used to correct for small movements of head motion. Participants with more than 2 mm maximum displacement in any direction of x, y, and z or more than 2° of angular rotation at any angle were discarded due to potential instability. Finally, we successfully obtained echo pulse sequence images with attenuation gradients. We registered the T1-weighted image with the average value of the rearranged EPI image. We calculated the transformation from natural space to the Montreal Institute of Neurology space and resampled to 3 mm × 3 mm × 3 mm voxels. By linear regression, white-matter signal, cerebrospinal fluid signal, global signal and Friston 24 parameters were regressed from the time series of all voxels. Finally, a time filter (0.01–0.08 Hz) was used to reduce the interference of low-frequency drift and high-frequency noise. More information was described previously. 33
MRI parameters on this study.

MRI, magnetic resonance imaging.
DC was obtained for each of the subjects by calculating a large number of upper threshold correlations in the voxel function network. The voxel level centrality diagram was transformed into a z score diagram using Equation 1. We analyzed differences in DC between patients with DNR and HCs using an independent two-sample t test.

in which,
Clinical characteristics
Clinical data were collected from individuals after admission, including glycated hemoglobin (HbA1c), serum creatinine, and blood pressure using an electronic sphygmomanometer. Fundus examination and visual acuity examination were also performed on all individuals. We also carried out fundus fluorescein angiograph and acquired estimated glomerular filtration rate (eGFR) from single-photon emission computed tomography (SPECT) scans in every patient in DNR group. Renal biopsy was performed on seven patients who showed a significant increase in proteinuria within 4–8 weeks to rule out other kidney diseases.
Statistical analysis
Demographic and clinical data are presented as mean ± standard deviation, and an independent-sample t test was used to compare variables between the two groups using SPSS 17.0 software (SPSS, Chicago, IL, USA). Statistical level was set at p < 0.05. For the DC values, an independent single-sample t test was conducted to determine the centrality of the whole-brain function brain network. Independent two-sample t tests were applied to compare DC data between the two groups using SPM8 (www.fil.ion.ucl.ac.uk/spm). Statistical level was set at p < 0.05 and corrected by Gaussian random field theory. The mean DC values in different brain regions of patients in each of the two groups were classified using receiver operating characteristic (ROC) curves. Correlation between brain DC values and clinical manifestations of the kidneys was carried out using Pearson correlation analysis. Statistical level was set at p < 0.05.
Results
Demographics and diabetic data
The mean duration of diabetes was 12.61 ± 5.71 years. There was a statistically significant difference between the two groups of patients in terms of HbA1c, diastolic blood pressure, and serum creatinine (p < 0.05). There were no significant differences between the two groups in terms of body mass index (p = 0.666), age (p = 0.568), and systolic blood pressure (p = 0.058). These data are presented in Table 2 and were analyzed using independent-sample t tests.
Demographic and renal data for DNR and HCs.

ACR, urine albumin/creatinine ratio; BMI, body mass index; DNR, diabetic nephropathy with retinopathy; HbA1c, glycated hemoglobin; HCs, healthy controls; N/A, not applicable; SCr, Serum creatinine; VA, visual acuity.
Renal biopsies and pathology
Figure 1 (left) shows typical diabetic glomerulosclerosis by hematoxylin-eosin staining: acellular enlargement of mesangial area (full of extracellular matrix), homogeneous thickening of glomerular basement membrane, formation and fusion of Kimmelstiel-Wilson knot. The glomerular silver staining in Figure 1 (right) shows droplet lesions in renal capsules, and compression of renal capillary lumen, typical glomerular sclerosis, and telangiectasia in capillaries.

Examples of pathological images of renal biopsy.
Imaging of the retinal fundus
Figure 2(a) and (c) shows a fundus photography and fluorescein fundus angiography of a left eye, presenting the following signs of HCs: no exudation, edema, or microaneurysm formation. The Figure 2(b) is fundus photography of a left eye, showing the following DR signs of the DNR group: retinal punctate hemorrhage, hard exudation, scattered microaneurysms formation and optic disc neovascularization. Fluorescein fundus angiography [Figure 2(d)] showed microaneurysms in the DNR group, and showed strong fluorescence at the later stage of angiography: there is visible retinal hemorrhage, occlusion of low fluorescence exudation, distorted and dilated retinal capillaries, and fluorescein leakage. The fluorescein of the optic disc was strongly stained with fluorescein leakage. No patchy perfusion was seen in the superior temporal region of the retina.

Examples of retinal fundus photography (left) and fluorescence fundus angiography (right) in the DNR patients and HC group.
Magnetic resonance imaging
The DC values of the right inferior temporomandibular (RITG) and left corpus callosum (LSG) were significantly lower in DNR patients than those in HCs; furthermore, DC values in the bilateral precuneus (BP) were also significantly higher [Figure 3(a) and (b); Table 3]. The mean value of the changed DC between DNR and HCs is shown in Figure 3(c). There were significant differences in the DCs of the RITG, the LSG, and the BP (voxel p < 0.01 and cluster-level p < 0.05 Gaussian Random Fields (GRF) correction); the red area indicates a higher mean DC value, while the blue area indicates a lower mean DC value [Figure 3(a) and (b)]. Mean DC changed between DNR and HCs [Figure 3(c)].
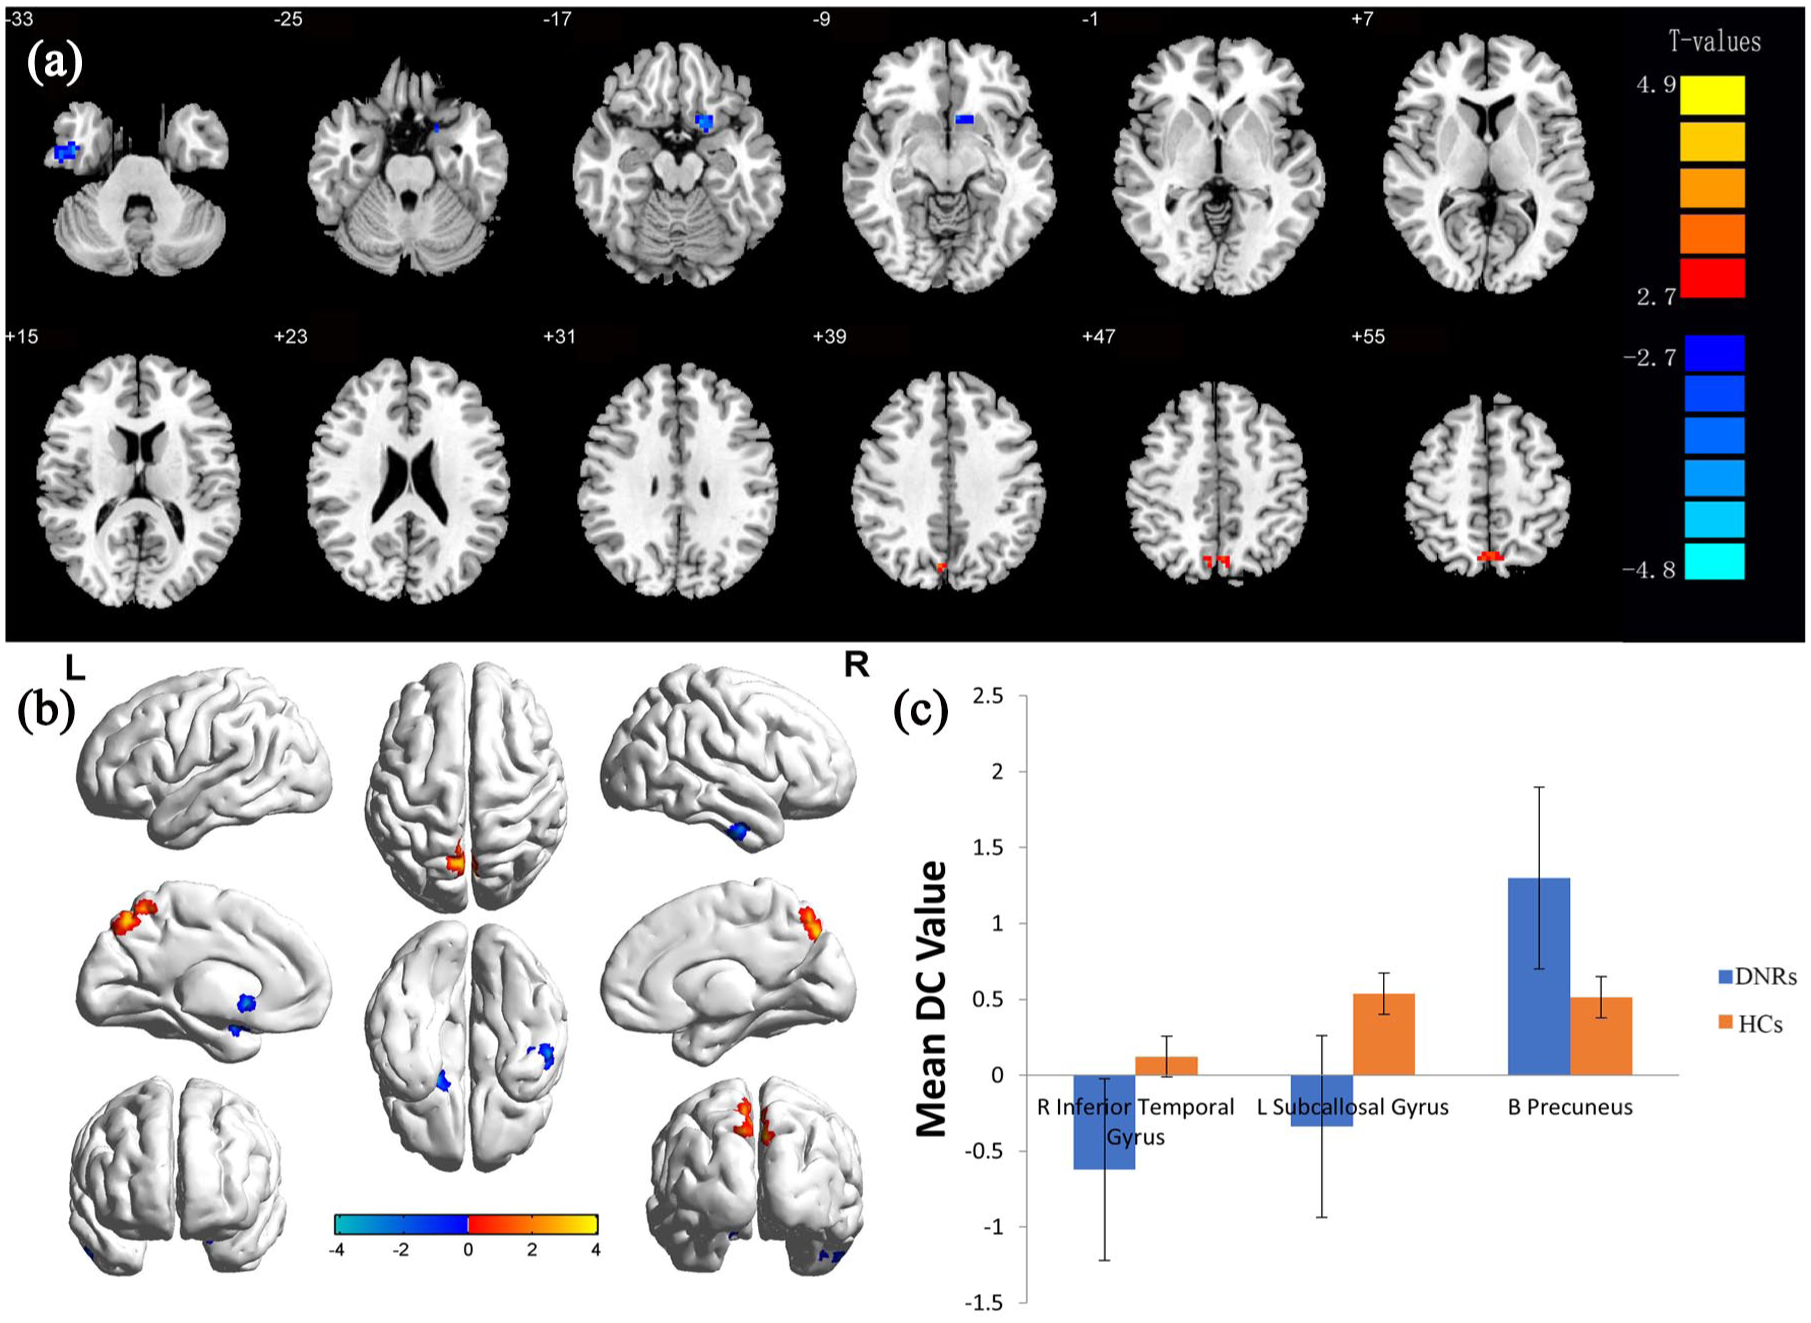
Voxel comparison of brain network centrality in the DNR group.
DC differences in brain regions between DNR and HCs.

B, both; BA, Brodmann area; DC, degree centrality; DNR, diabetic nephropathy with retinopathy; HCs, healthy controls; L, left; MNI, Montreal Neurological Institute; R, right.
Correlation analysis
In the DNR group, there was a linear correlation between the mean DC value of BP and eGFR [the latter was obtained from patients undergoing SPECT scans; r = 0.762, p < 0.0001 in Figure 4(a)]. This indicates that the mean DC value in the BP region was positively correlated with eGFR, as eGFR was obtained from patients undergoing SPECT scans. However, no linear correlation was observed between mean DC value in the BP region and the clinical manifestations of DR, such as best-corrected vision acuity (BCVA) in the right eye [r = –0.125, p = 0.789 in Figure 4(b)].
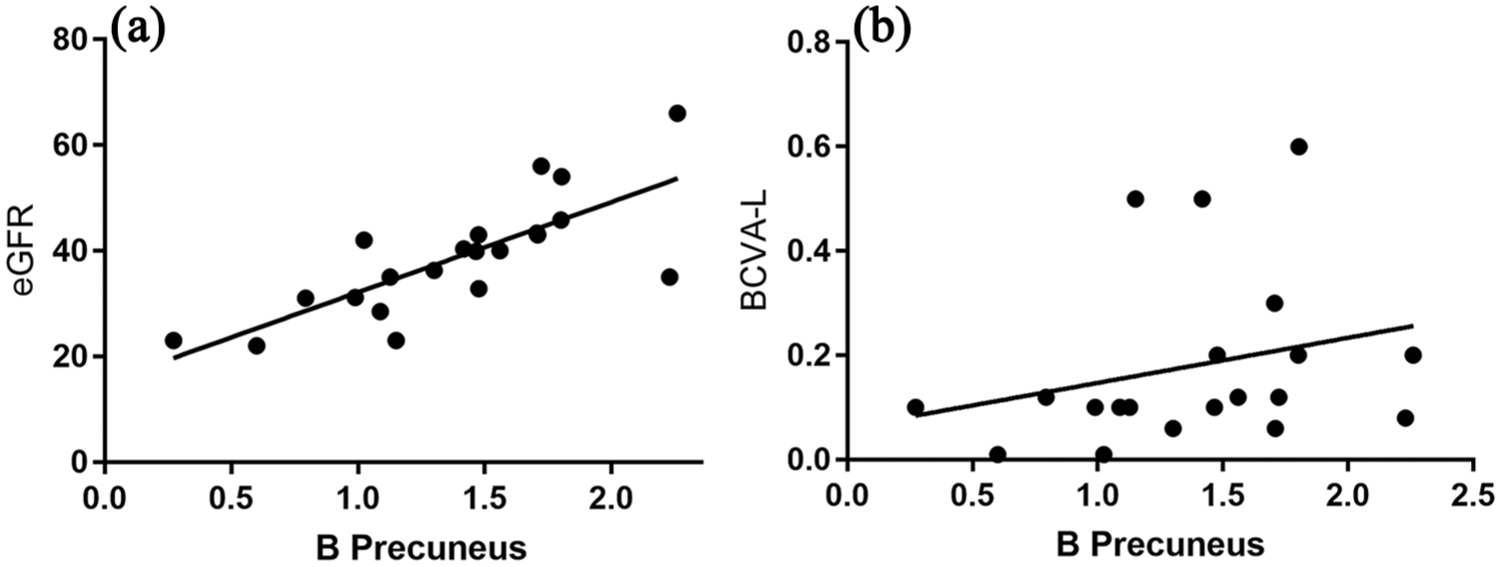
The correlation between the average degree centrality values of BP, and eGFR and BCVA.
Diagnostic value of DC in different brain regions
We hypothesized that DC differences between DNR patients and HCs would represent useful diagnostic markers. The area under the curve (AUC) represents the accuracy of the diagnosis. The AUC for the BP was 0.829 [DNRs > HCs; Figure 5(a)], while that for the RITG was 0.839; for the LSG, the AUC was 0.839 [DNRs < HCs; Figure 5(b)].

ROC curve analysis of the mean DC values for altered brain regions.
Discussion
In this study, we aimed to investigate whether brain function has changed in patients with DNR and whether there was a correlation between brain signals and clinical manifestations of the kidney and eyes in these patients. To our knowledge, this is the first study in which DC technology was applied to investigate variation in brain activation sites in T2DM patients with two organs of microvascular complications. The MR scans of DNR patients showed that the mean DC value of the brain changed significantly. Furthermore, there was a significant linear correlation between the mean DC value of the BP and renal eGFR. However, no significant correlation was found between brain values and other clinical features of the kidney or eye.
Previous fMRI research on diabetics has been mostly restricted to cognitive impairment or white-matter atrophy.35,36 Very little existing literature has described the use of DC technology to assess the severity of multiple organ microvasculature in diabetic patients. The glomerulus is a vascular globule composed of several capillaries; similar capillaries are found throughout the retina and brain parenchyma. 37 Recent papers describing autopsy results have demonstrated severe microvascular disease and neurofibrosis in the brains of patients with long-term diabetes.38,39 We recruited 20 DNR patients and 20 HCs with comparable age, sex, and educational background. Compared with HCs, DNR patients showed reduced mean DC values in the RITG and LSG, and increased mean DC values in the BP. The BP is related to motor sensation and memory; damage in this area is often seen as an early sign of cognitive impairment. The RITG, situated below the middle temporal gyrus, is crucial for visual object recognition and visual perception. 40 The left callus is located between the anterior and posterior olfactory sulcus, is part of the limbic system and is associated with visceral states and emotions. 41 In a previous study of diabetic rats, Kancherla and colleagues reported that before retinal morphological changes appeared, the integrity of the visual pathways in white-matter fibers became altered, suggesting that visual pathways in the brain were damaged at an early stage. 42 In the DNR group, the average BCVA of left and right eyes was 0.19 ± 0.16 and 0.16 ± 0.14. Compared with the HCs group, the visual acuity decreased significantly. Diabetes is known to be linked to retinal degeneration and neuropathy, which can then lead to visual and sensory impairment.43,44 Abnormal functional signals in the middle temporal region of the brain may indicate that their central visual nervous system is also impaired and damaged. From Figure 4, it is apparent that in patients with severe complications of diabetes mellitus, there was a linear relationship between the mean DC value of the BP and eGFR in patients with DN (r = 0.762, p < 0.0001). In addition, the ROC curve shown in Figure 5 revealed that the abnormal signal value of the brain exhibited robust accuracy and excellent specificity in distinguishing the two groups. Therefore, it appears that network centrality measurement of these brain regions can be used to characterize the severity of DN, at least to some extent. In a previous study, Sedaghat and colleagues investigated patients with chronic kidney disease and found that lower eGFR was independently associated with lower cerebral blood flow. 45 A possible explanation for this might be that vascular endothelial injury mediates a common pathological change in the brain and kidney. This interpretation is tenable in at least two major aspects: first, the kidney and brain share common traditional risk factors, such as hypertension and diabetes; second, the kidney and brain have similar vascular beds. In our present study, diastolic blood pressure still showed some statistical significance between the two groups. Therefore, the results of our study do not explain whether changes in brain function are caused by diabetic microangiopathy, or whether hemodynamic changes that are secondary to DN lead to changes in brain DC values. In chronic kidney disease, GFR is considered to be the best index of renal function. The linear relationship between brain abnormal signals and renal function suggests that the degree of renal microangiopathy in diabetic patients can be measured within a certain range by a brain MRI model. However, our study was unable to demonstrate a linear relationship between brain signals and other clinical manifestations of the kidney. This may be because urinary albumin and creatinine are single urine samples, which are highly volatile, and because our patients were taking antihypertensive drugs.
By pathological sections of the kidney (Figure 1) and retinal fundus photography (Figure 2), we observed that both retina and renal parenchyma had obvious microangiopathy. This was in accordance with previous observations in diabetic rats, which showed that retinal basement membrane thickening was associated with glomerular capillary basement membrane thickening. 46 In a previous paper, Chee argued that the kidney and the eye have strikingly similar developmental, physiological and pathogenic pathways. 47 In addition, the glomerular and choroidal vascular networks have analogous structures. Furthermore, the renin–angiotensin–aldosterone cascade exists in both the eyes and the kidneys. 48 Retinas and glomeruli are the most involved microvascular target organs in diabetes mellitus. In a study involving diabetic rats, Cherian found that retinal capillary basement membrane thickening was associated with thickening of the glomerular capillary basement membrane. 46 In another study, Kramer suggested that DN and DR reflected similar microvascular lesions, 49 indicating that microvascular factors made a strong contribution to this risk. Our current findings support the view of Tolonen and colleagues, in that there is a common mechanism of pathogenesis between retinopathy and nephropathy that could be targeted, thus preventing the onset of complications in patients. 50
In accordance with the present results, previous studies have demonstrated that hyperglycemia, resulting from oxidative stress, leads to thickening of the capillary basement membrane in diabetes. The basement membrane is the common microvascular structural basis of glomerular, retinal and parenchymal tissues. DN is usually accompanied by abnormal activation of the renin–angiotensin system, which leads to oxidative stress in the microvessels. In a hyperglycemic environment, angiotensin II and intracellular signaling molecules attack the basement membrane of the microvasculature, which destroys the vascular wall filtration barrier of the capillaries. 51 These diabetic vascular and neurological complications interact and intersect over an extended period of time, with side effects on the brain microvascular system. Our previous research reported that in rat mesangial cells, the angiotensin II receptor mediated oxidative stress mainly by upregulating Toll-like receptor 4 signaling. 52 Taken together, these results suggest that there are similar pathogenic mechanisms between brain damage, retinopathy, and kidney lesions in diabetic patients, which may provide new insights and options for preventative strategies for DN (see Figure 6).

Relationship between MRI images and clinical manifestations in diabetic nephropathy with diabetic retinopathy.
Limitations
Our study only included patients with T2DM microangiopathy. It was limited by the absence of a diabetic group without microangiopathy. Consequently, our results may not be applicable to type 1 diabetes or patients with DN or patients with only DR. We did not measure fasting blood sugar before MRI, which may affect the experimental results. In addition, our research sample is relatively small. We plan to enlarge the sample size combined with the endocrinology department in future research.
Conclusion
DNR patients showed dysfunction in three different brain regions. The linear correlation between eGFR and mean brain DC values indicates the presence of common diabetic microangiopathy in the brain and kidney, which may provide new ideas for multiorgan microvascular lesions of diabetics.
Supplemental Material
STROBE_checklist_v4_combined_PlosMedicine – Supplemental material for Evidence of altered brain network centrality in patients with diabetic nephropathy and retinopathy: an fMRI study using a voxel-wise degree centrality approach
Supplemental material, STROBE_checklist_v4_combined_PlosMedicine for Evidence of altered brain network centrality in patients with diabetic nephropathy and retinopathy: an fMRI study using a voxel-wise degree centrality approach by Yu Wang, Lei Jiang, Xiao-yu Wang, Weizhe Chen, Yi Shao, Qin-kai Chen and Jin-lei Lv in Therapeutic Advances in Endocrinology and Metabolism
Footnotes
Authors’ note
Thanks to YS and JL put forward the conception of this study and design the research. YW, LJ, and XW drafted the manuscript. WC, QC, and YS critically revised the manuscript and completed the submission. Yu Wang and Lei Jiang equally contribute to this work.
Funding
This research is supported by the National Natural Science Foundation of China (no.: 81660129, 81160118, 81060063); Educational Science research Foundation of Jiangxi Province (no.: GJJ160250); Science Foundation of Jiangxi Healthy Institution (no.: 20191059).
Conflict of interest statement
The authors declare that there is no conflict of interest.
Supplemental material
Supplemental material for this article is available online.
References
Supplementary Material
Please find the following supplemental material available below.
For Open Access articles published under a Creative Commons License, all supplemental material carries the same license as the article it is associated with.
For non-Open Access articles published, all supplemental material carries a non-exclusive license, and permission requests for re-use of supplemental material or any part of supplemental material shall be sent directly to the copyright owner as specified in the copyright notice associated with the article.