
Abstract
Background:
This cross-sectional study aimed to describe sex-related differences in diabetes-specific factors underlying the development of frailty in older persons with type 2 diabetes.
Methods:
Older persons aged 60–80 years were sequentially enrolled. Frailty and sarcopenia were evaluated using the validated Kihon checklist (KCL) and Asian Working Group for Sarcopenia algorithm, respectively. Physical function and characteristics were measured by trained nurses independently.
Results:
This study included 213 participants. The mean age, body mass index (BMI), and glycated hemoglobin (HbA1c) level were 70.4 years, 24.3 kg/m2, and 7.4%, respectively. Prevalence of frailty was higher in women. Social and cognitive functions were lower in the prefrailty stage, while physical function was lower in the frailty stage, although there was no decrease in skeletal muscle mass. After adjustment for age, the KCL score was significantly associated with peripheral neuropathy, diet score, and coronary artery disease (CAD); frailty, with CAD and inoccupation; prefrailty, with diet score; and sarcopenia, with living alone in men. Meanwhile, the KCL score was significantly associated with living alone and skeletal muscle percentage; prefrailty, with peripheral neuropathy; and sarcopenia, with diabetes duration, LDL-cholesterol level, diet score, and irregular lifestyle in women.
Conclusions:
Sex differences in the risk factors of frailty should be considered when selecting preventive strategies for older persons with type 2 diabetes, early in the prefrailty stage. In particular, it is important to evaluate social participation and diet therapy in men and skeletal muscle mass and psychosocial function in women.
Introduction
Frailty represents a syndrome, seen particularly in older persons, characterized by the decline in muscular reserve and function that leads to a reduced ability to cope with everyday stressors. 1 It refers not only to the physical aspects, but also to a state of dysfunction, including the deterioration of psychosomatic and social functions.
Frailty is not only associated with falls and an increased risk of long-term care but is also associated with reduced survival. 2 In addition, sarcopenia plays a role in physical frailty, and is associated with a poor quality of life, falls risk, and more often, tiredness in activities of daily living (ADLs). 3 In diabetes mellitus, the incidence of frailty and sarcopenia are further increased.4–6 Moreover, among relatively younger generations, those with diabetes have a poorer quality of life and higher mortality than those without diabetes.7–9
Current evidence has shown that frailty is strongly associated with various risk factors. Low socioeconomic status, as assessed by either lower educational or lower income levels, showed an association with higher frailty risk. 10 Psychological disorders, such as depression, affect frailty in older adults. 11 Moreover, lifestyle factors, such as low physical activity, drinking, and smoking, are contributory factors to frailty.12–14 Malnutrition is an essential lifestyle risk factor of frailty (especially physical frailty risk).15–17 However, the magnitude of the association between these factors and frailty in people with diabetes is unknown. In addition, people with diabetes must adjust to and continue with their diet, exercise, and lifestyle, as forms of treatment for glycemic control and the prevention of complications. 18 Some people with diabetes have physical problems that are specific, such as diabetic complications. However, diabetes mellitus-specific risk factors that might lead to the development of frailty are not necessarily definitive.
Furthermore, biological and psychosocial factors are responsible for sex differences in diabetes risk and outcomes. 19 Sex hormones affect behavior throughout life, and physical changes can have implications on lifestyle, social roles, and mental health. In addition, a complex interplay exists among genetic, endocrine, and social factors, which influence sex roles and sex identity. 20 Moreover, there are sex differences in comorbidities 21 and mortality.22,23 Thus, in people with frailty complicated by diabetes mellitus, sex-related differences need to be considered.
Restoring the state of prefrailty or robustness in older persons with frailty or sarcopenia is arduous. Therefore, sex-related factors of frailty that are specific to older persons with diabetes, from the stage of unimpaired basic ADLs, need to be clarified. In this study sex-related differences in characteristics and factors that influence the development of frailty were examined in older persons with type 2 diabetes.
Materials and methods
Study design and participants
This was a cross-sectional study with the following inclusion criteria: type 2 diabetes, age 60 to 80 years, and unimpaired basic ADLs (Barthel index ⩾85). The exclusion criteria were as follows: people certified for needing long-term care and support; cerebrovascular disease and peripheral artery disease; paralysis in any part of the body; severe diabetes complications, including microvascular disease and coronary artery disease (CAD); comorbidities (e.g. heart failure, liver and renal disorders, anemia, malignancy, and dementia); and depression or other psychiatric problems.
Study participants were recruited between 21 March 2017 and 28 February 2018 in the outpatient diabetes clinic of Kyoto University Hospital in Japan. The sample size was calculated based on the number of outpatient visits during the research period. After a trained group of assessors (certified diabetes educators and a diabetologist) screened for eligibility using 1320 medical records, all eligible participants were sequentially recruited on arrival for outpatient visits.
The study protocol was approved by the Kyoto University Graduate School and Faculty of Medicine, Ethics Committee (R0954) and was compliant with the principles of the Declaration of Helsinki. Written informed consent was obtained from all the participants before they took part in the research.
Instruments
Participants’ demographic characteristics
Demographic characteristics, including age, sex, academic background, family structure, work status, irregular lifestyle (irregular bedtimes or irregular eating habits), drinking habits, and smoking habits were obtained from medical records and a general questionnaire. Body composition was measured using bioelectrical impedance methods. All data were collected by certified-nurse diabetes educators.
Diabetes-related factors
Diabetes duration, treatment, complications, and blood test results were obtained from medical records. Hypoglycemia was confirmed by reviewing the self-monitored blood glucose record or hypoglycemia episodes during the last 3 months. Hypoglycemia was defined as a blood glucose ⩽70 mg/dl.24,25 Diabetes self-management performance was measured using the Summary of Diabetes Self-Care Activities Measure (SDSCA).26–29 The higher the subscale mean score, the higher the level of self-care practice.
Frailty
Frailty was evaluated using the Kihon checklist (KCL), developed and validated by the Japanese Ministry of Health, Labor, and Welfare; and widely used in Japan.30–32 Recently, the KCL was translated into other languages, and used in various countries.33–35 This comprehensive questionnaire is used to assess multiple domains, including the physical, psychological, functional, and social statuse of older adults without disabilities. A higher score in each KCL domain indicates a higher risk of requiring support or care in that domain. KCL scores ⩾8 and ⩾4 points were defined as frailty and prefrailty, respectively. 30 We defined sarcopenia according to the Asian Working Group for Sarcopenia criteria.36,37
Physical functions
We assessed walking speed, one-leg-balance stand time, grip strength, timed up-and-go (TUG) time, body mass index (BMI), and body composition. An 11-m walkway was used to measure participant’s usual walking speed, which was calculated over a 5-m distance between the 3 and 8-m marks on the 11-m walkway. The one-leg balance stand time was measured by asking each participant to stand as long as possible, up to 120 seconds, with their eyes open. Grip strength was measured with a digital hand dynamometer (TKK5401, Takei Scientific Instruments Co., Ltd., Japan). Participants stood with their wrist in a neutral position and their elbow flexed at 90°. The TUG test shows the time taken in a sequence of actions to stand from an armless chair, walk 3 m, turn, walk back, and sit down on a chair.
Statistical analysis
Data are expressed as mean ± standard deviation for continuous variables or number (percentage) for categorical variables unless otherwise noted. The Student’s t test was used to compare continuous variables, while the Chi-square and Fisher’s exact tests were used for comparison of the categorized variables according to sex. Tukey multiple comparison tests were used to compare KCL score, physical function, and body composition with frailty, prefrailty, and robustness, respectively.
A multiple linear regression analysis using a forward variable selection method was performed to evaluate the factors associated with the KCL score. Logistic regression analyses using a forward variable selection method were performed to evaluate factors associated with frailty (versus prefrailty), prefrailty (versus robustness), and sarcopenia (versus nonsarcopenia). Independent variables were selected from the participants’ demographics and diabetes-related factors on the basis of hypothesis testing or correlations relevant to the KCL score, frailty, prefrailty, and sarcopenia. Variables with a p value <0.2 were considered for inclusion in the regression models. Multiple linear and logistic regression analyses were adjusted for age.
For all analyses, p values <0.05 were considered statistically significant. Data analyses were performed using SPSS statistics, version 24.0 (IBM Japan, Japan).
Results
Participants’ characteristics
Of 231 eligible participants, 215 were enrolled in the study. A total of eight participants were excluded because of needing long-term care (n = 3), severe comorbidities (dementia, n = 2; malignancy, n =1; history of toe amputation, n = 1), and depression (n = 1); eight refused, and two were excluded because of incomplete data. Finally, 213 participants’ (108 men and 105 women) data were analyzed (Table 1).
Participants’ demographics.
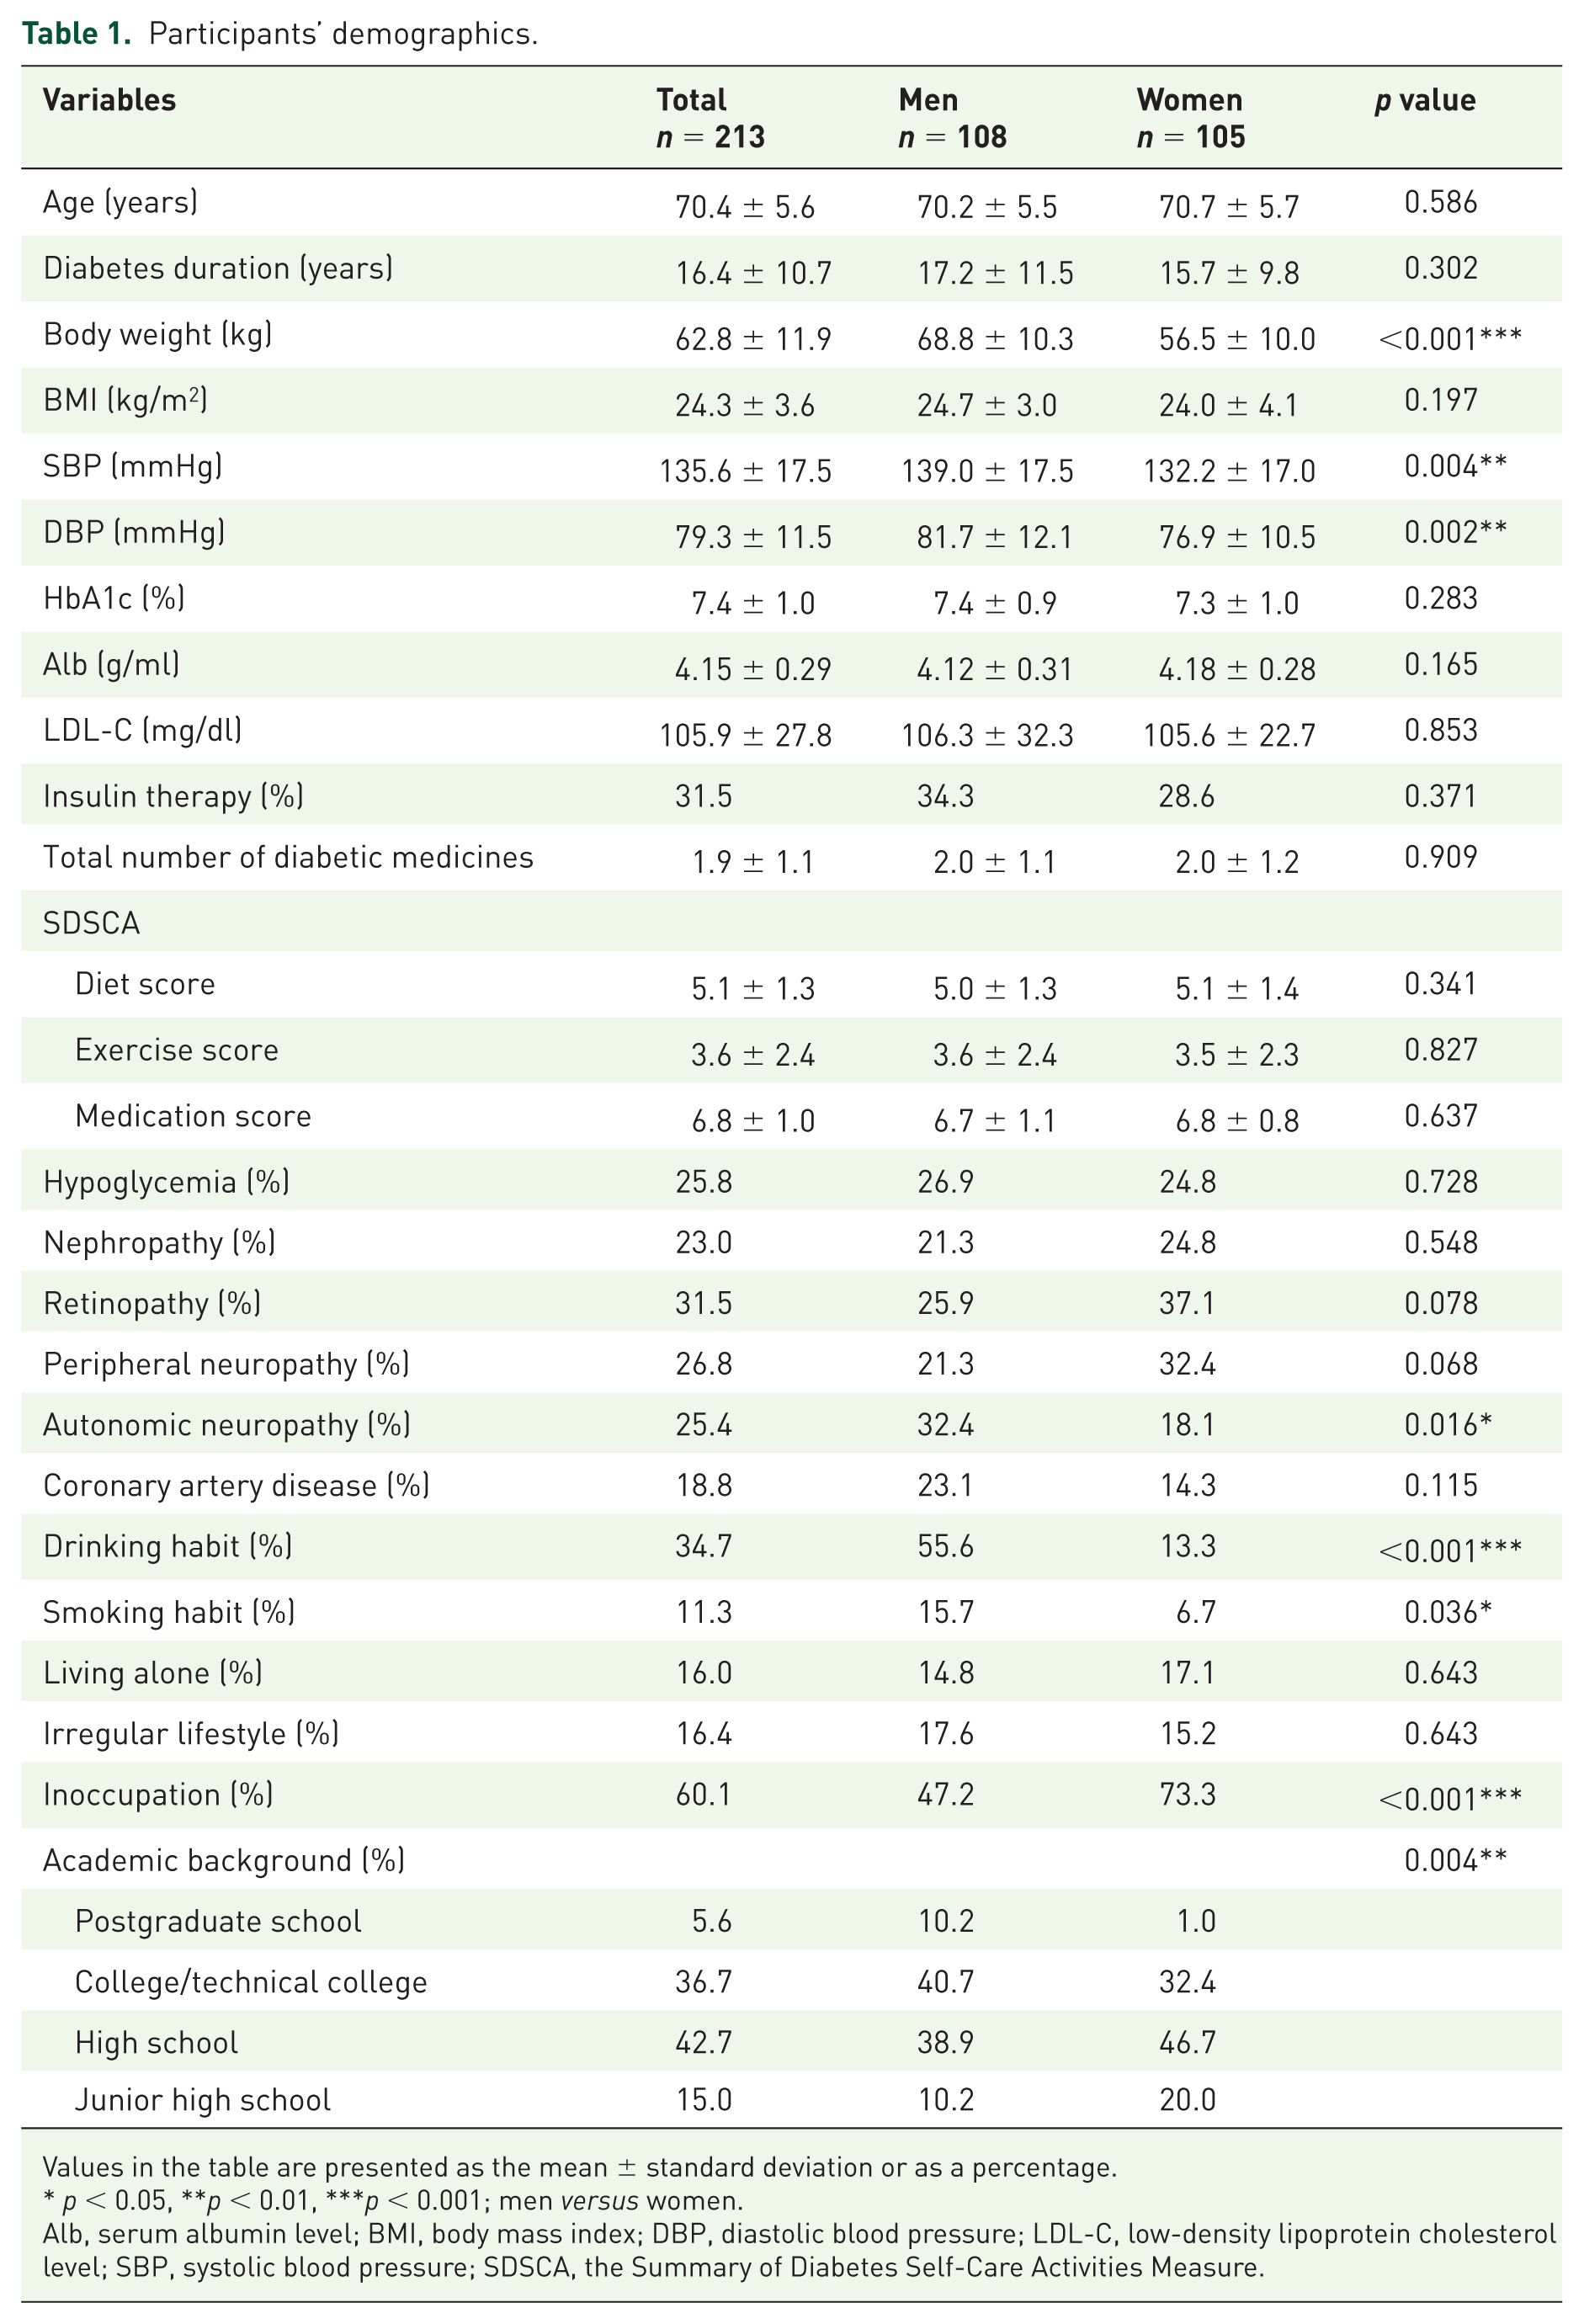
Values in the table are presented as the mean ± standard deviation or as a percentage.
p < 0.05, **p < 0.01, ***p < 0.001; men versus women.
Alb, serum albumin level; BMI, body mass index; DBP, diastolic blood pressure; LDL-C, low-density lipoprotein cholesterol level; SBP, systolic blood pressure; SDSCA, the Summary of Diabetes Self-Care Activities Measure.
The mean ages of the participants were 70.2 ± 5.5 years (men) and 70.7 ± 5.7 years (women). In addition, the mean diabetes duration, BMI, systolic/diastolic blood pressure (SBP/DBP), glycated hemoglobin (HbA1c) level, serum albumin level (Alb), and low-density lipoprotein cholesterol (LDL-C) level in men and women were as follows: 17.2 ± 11.5 versus 15.7 ± 9.8 years; 24.7 ± 3.0 versus 24.0 ± 4.1 kg/m2; 139.0 ± 17.5/81.7 ± 12.1 versus 132.2 ± 17.0/76.9 ± 10.5 mmHg (p = 0.004/p = 0.002); 7.4 ± 0.9% (57 ± 9.8 mmol/mol) versus 7.3 ± 1.0% (56 ± 10.9 mmol/mol); 4.12 ± 0.31 versus 4.18 ± 0.28 g/ml; and 106.3 ± 32.3 versus 105.6 ± 22.7 mg/dl, respectively.
Diabetes therapy and self-management scores evaluated using the SDSCA were not significantly different between the sexes. Regarding diabetic complications, autonomic neuropathy prevalence was significantly higher in men than in women (32.4% versus 18.1%; p = 0.016); however, the prevalence of other diabetes complications was not significantly different between the sexes.
The prevalence of lifestyle-related factors, including drinking (p < 0.001), smoking (p = 0.036), and occupation (p < 0.001), was higher in men than in women. The education level was also higher in men (p = 0.004); however, the prevalence of living alone and irregular lifestyle was not significantly different between the sexes.
Prevalence of frailty and sarcopenia
The KCL score and frailty prevalence were significantly higher in women than in men (p = 0.011 and p = 0.039, respectively; Table 2). The prevalence of sarcopenia was similar (p = 0.674) in men (20.4%) and women (18.1%). In addition, sarcopenia prevalence was significantly higher in men and women with frailty, but not significantly different between participants with prefrailty and those in a state of robustness robustness (Table 3).
Prevalence of frailty and sarcopenia.

Values in the table are presented as the mean ± standard deviation or as a percentage.
p < 0.05, **p < 0.01, ***p < 0.001; men versus women.
Grip strength <26 kg in men and <18 kg in women; Walking speed ⩽0.8 m/s.
Skeletal muscle mass index ⩽7 kg/m2 in men and ⩽5.4 kg/m2 in women.
Participants who were diagnosed with low physical performance in diagnostic step 1.
%BF, percentage of body fat; %SMM, percentage of skeletal muscle mass; KCL, Kihon checklist; SMI, skeletal muscle mass index; TUG, timed up-and-go test.
Comparison of the Kihon checklist score (frailty index), physical functions, and body compositions between frailty, prefrailty, and robust men and women.
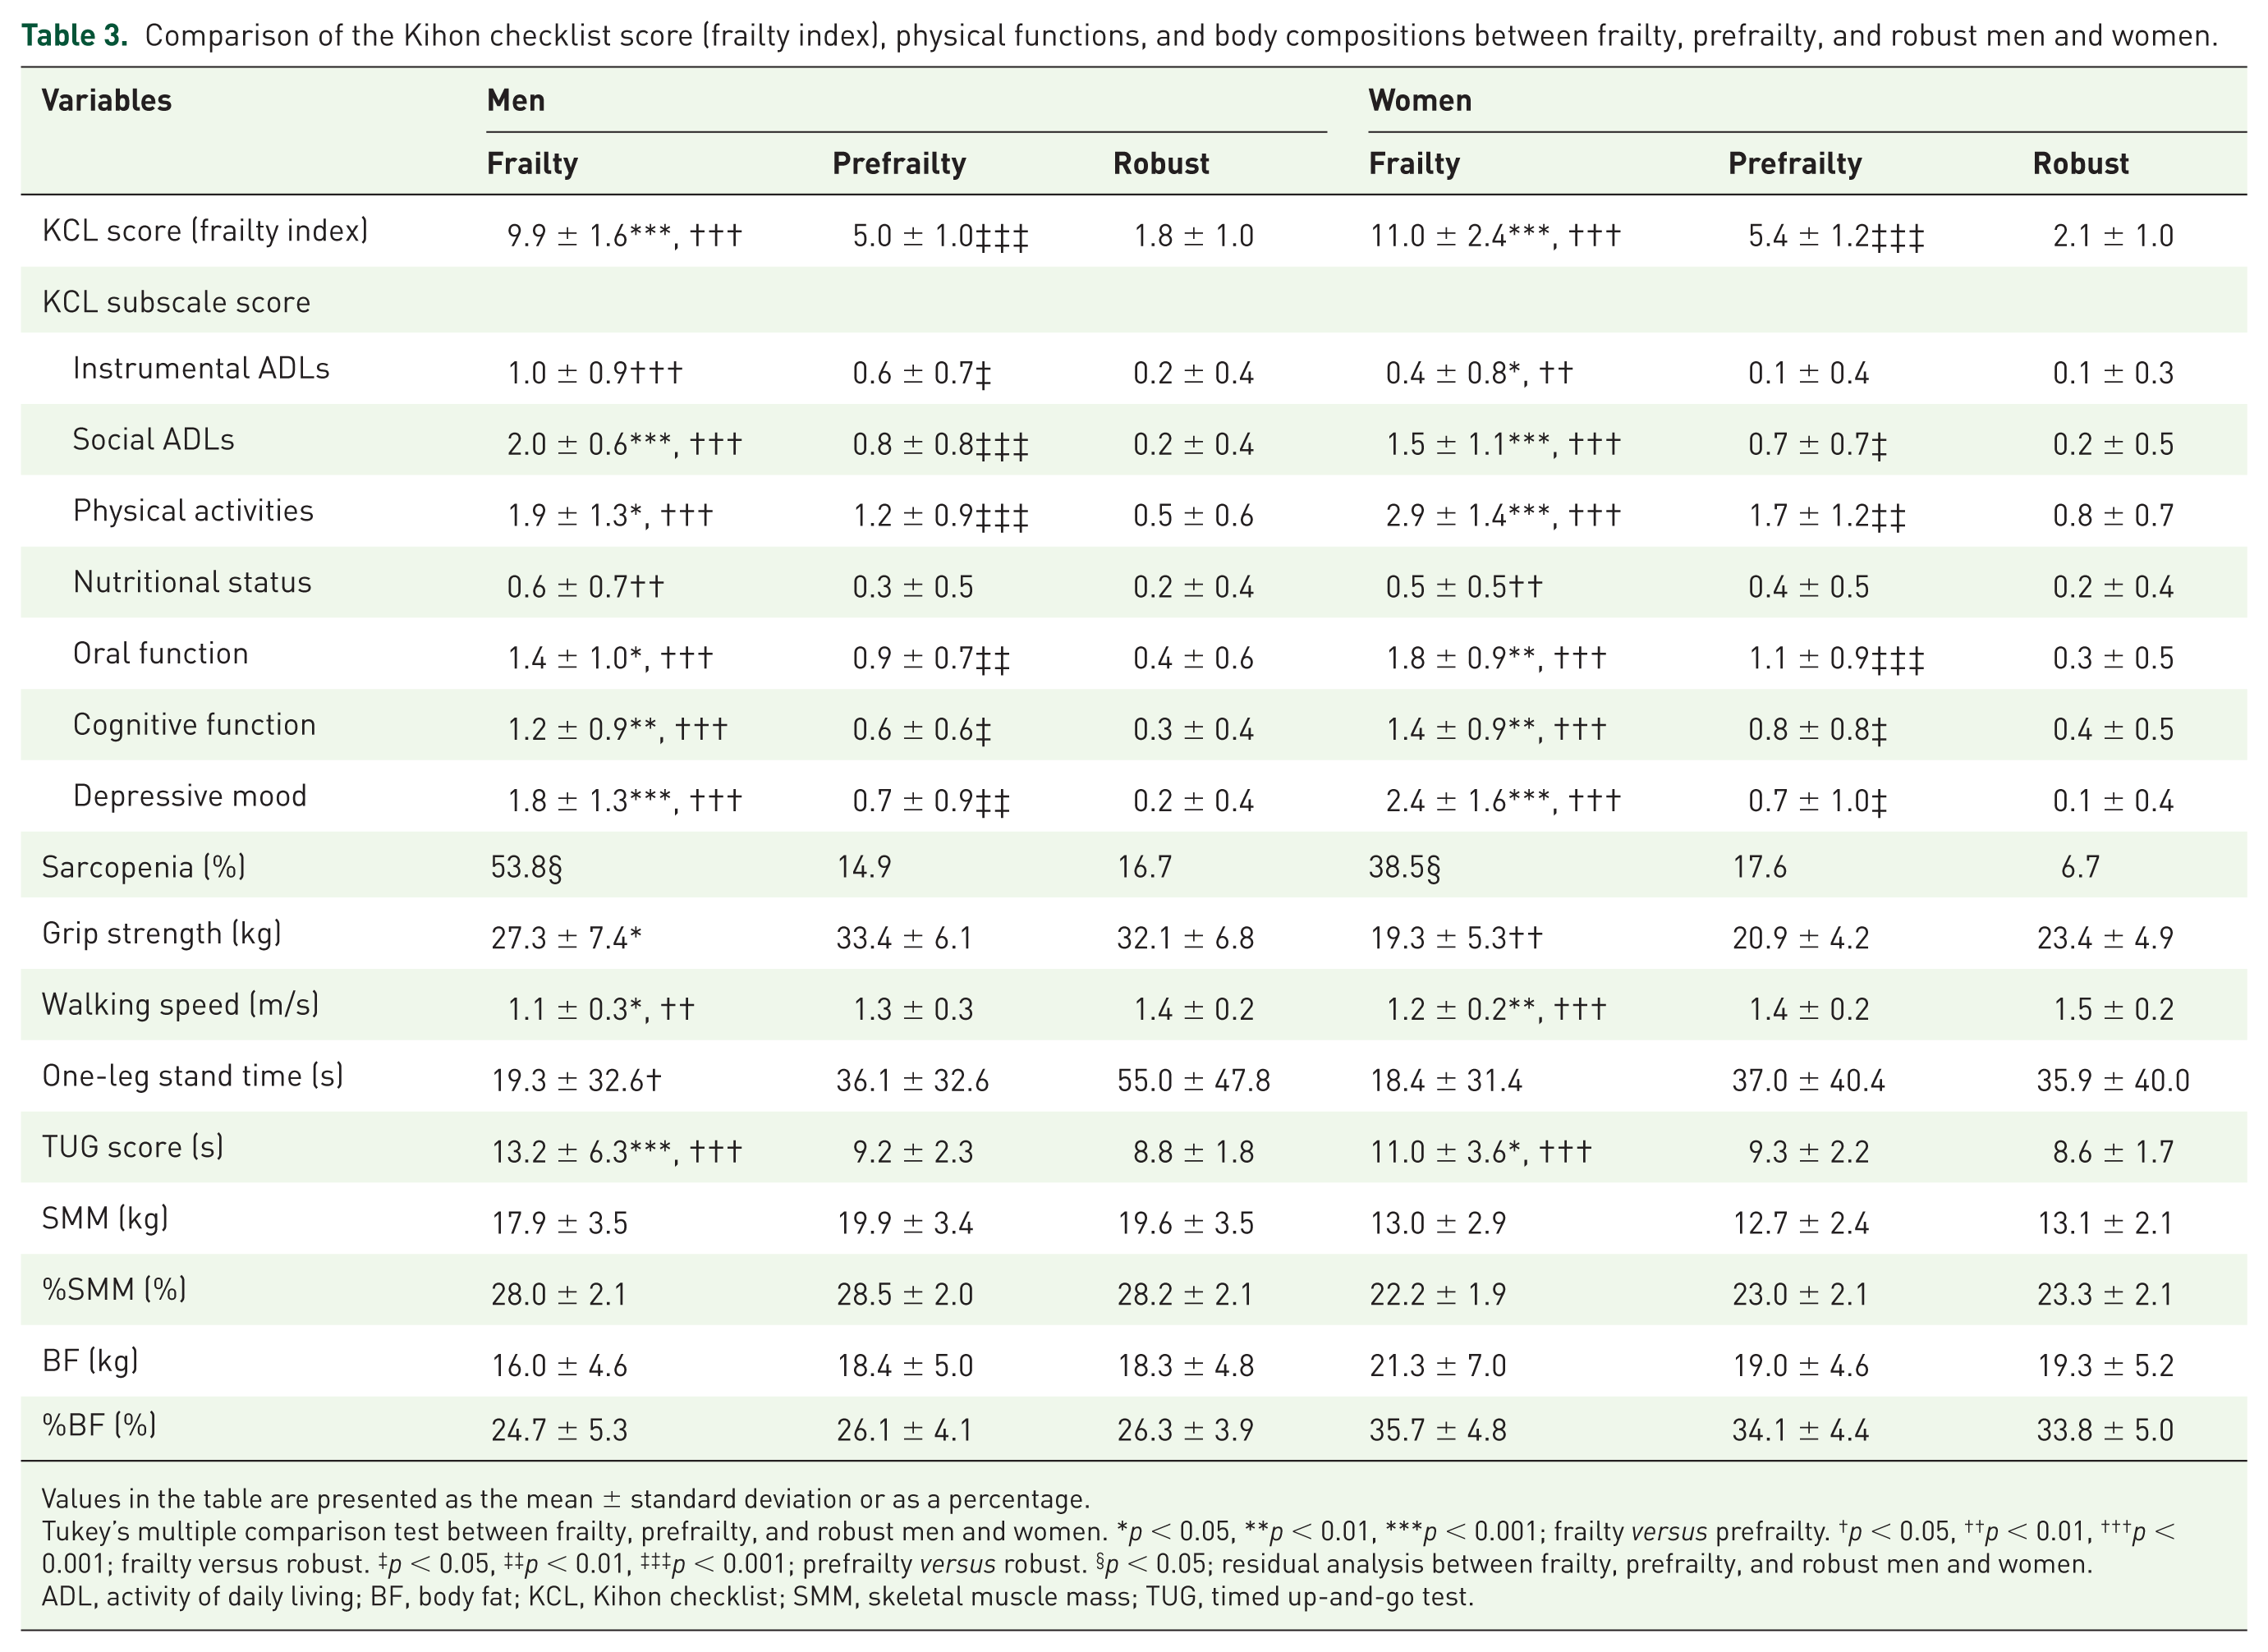
Values in the table are presented as the mean ± standard deviation or as a percentage.
Tukey’s multiple comparison test between frailty, prefrailty, and robust men and women. *p < 0.05, **p < 0.01, ***p < 0.001; frailty versus prefrailty. †p < 0.05, ††p < 0.01, †††p < 0.001; frailty versus robust. ‡p < 0.05, ‡‡p < 0.01, ‡‡‡p < 0.001; prefrailty versus robust. §p < 0.05; residual analysis between frailty, prefrailty, and robust men and women. ADL, activity of daily living; BF, body fat; KCL, Kihon checklist; SMM, skeletal muscle mass; TUG, timed up-and-go test.
Features of frailty and sarcopenia
Features of frailty were evaluated on the basis of the KCL subscale scores. Social ADLs, physical activity, oral function, cognitive function, and depressive mood scores were significantly higher in frailty than in prefrailty, and in prefrailty than those in the robust groups for both men and women (Table 3). The instrumental ADL (IADL) score was significantly higher in frailty and prefrailty than in robustness, in men. However, the scores were significantly higher in frailty than in prefrailty and robustness in women. The nutritional status score was significantly higher in those with frailty than in those with prefrailty and robustness, in both men and women.
Regarding physical function, walking speed was significantly slower, while the TUG time was significantly longer, in both men and women with frailty than in those with prefrailty and robustness. Grip strength was significantly weaker in men with frailty than in those with prefrailty, and in women with frailty than in those with robustness, but not with prefrailty (Table 3). Interestingly, the volume and percentages of skeletal muscle and body fat did not differ among frailty, prefrailty, and robustness in both sexes (Table 3). The distribution of the diagnostic reasons for sarcopenia is presented in Table 2. Approximately 95% of both men and women with sarcopenia were diagnosed because of a decrease in grip strength.
Factors related to KCL score, frailty, prefrailty, and sarcopenia in men
The results of the bivariate analysis are shown in Supplementary Table S1. After adjusting for age in the multiple linear regression analysis, the KCL score was significantly associated with peripheral neuropathy [β = 1.29, 95% confidence interval (CI): 0.06–2.53, p = 0.040], diet score [β = −1.02, 95% CI: −1.46 to −0.58, p < 0.001), and CAD (β = 2.29, 95% CI: 1.10–3.49, p < 0.001; Table 4, Figure 1(a)]. After adjusting for age in the logistic regression analysis, frailty was significantly associated with CAD [odds ratio (OR) = 6.31, 95% CI: 1.52–26.19, p = 0.011] and inoccupation (OR = 5.06, 95% CI: 1.12–22.83, p = 0.035); prefrailty was significantly associated with LDL-C level (OR = 0.92, 95% CI: 0.85–0.98, p = 0.044) and diet score (OR = 0.56, 95% CI: 0.36–0.89, p = 0.013); sarcopenia was significantly associated with living alone [OR = 3.80, 95% CI: 1.10–13.13, p = 0.035; Table 4, Figure 1(a)].
Factors associated with the Kihon checklist score (frailty index), frailty, prefrailty, and sarcopenia.

Adjustment factor: age. *p < 0.05, **p < 0.01, ***p < 0.001.
multiple linear regression analysis, blogistic regression analysis.
per 5 years increase, dper 5% increase, eper 5 mg/dl increase.
%SMM, Percentage of skeletal muscle mass; CI, confidence interval; KCL, Kihon checklist; LDL-C, low-density lipoprotein cholesterol; OR, odds ratio.

Diabetes-specific factors of frailty and sarcopenia in (a) men and (b) women.
However, the rates of statin prescription in the robust, prefrailty, and frailty groups were 27.1%, 42.6%, and 53.8%, respectively. After adjusting for age and statin prescription, the significant association between LDL-C level and prefrailty disappeared, whereas the significant association between diet score and prefrailty was maintained (OR = 0.53, 95% CI: 0.33–0.85, p = 0.008).
Factors related to KCL score, frailty, prefrailty, and sarcopenia in women
The results of the bivariate analysis are shown in Supplementary Table S2. After adjusting for age in the multiple linear regression analysis, the KCL score was significantly associated with the percentage of skeletal muscle mass (%SMM; β = −1.90, 95% CI: −3.77 to −0.03, p = 0.046) and living alone [β = −2.02, 95% CI: −3.96 to −0.07, p = 0.043; Table 4, Figure 1(b)]. After adjusting for age in the logistic regression analysis, no factors remained significantly associated with frailty; prefrailty was significantly associated with peripheral neuropathy (OR = 3.09, 95% CI: 1.16–8.21, p = 0.024); sarcopenia was significantly associated with diabetes duration (OR = 1.43, 95% CI: 1.01–2.03, p = 0.042), LDL-C level (OR = 0.85, 95% CI: 0.72–0.99, p = 0.039), diet score (OR = 4.28, 95% CI: 1.75–10.44, p = 0.001), and irregular lifestyle [OR = 11.08, 95% CI: 1.09–112.52, p = 0.042; Table 4, Figure 1(b)].
The rates of statin prescription in the robust, prefrailty, and frailty groups were 62.2%, 55.9%, and 65.4%, respectively. After adjusting for age and statin prescription, the significant association between sarcopenia and LDL-C level (OR = 0.82, 95% CI: 0.68–0.98, p = 0.027), diabetes duration (OR = 1.44, 95% CI: 1.01–2.05, p = 0.045), diet score (OR = 4.82, 95% CI: 1.90–12.24, p = 0.001), and irregular lifestyle (OR = 18.69, 95% CI: 1.96–178.36, p = 0.011) was maintained.
Discussion
In this study, we examined the characteristics and diabetes-related factors of frailty according to sex in older persons with type 2 diabetes who could perform basic ADLs. Both men and women showed a gradual, significant decrease in social ADLs, physical activity, and oral, cognitive, and psychological function from robustness to frailty. The IADL level was significantly lower in the prefrailty and frailty stages in men and in the frailty stage in women. Physical function was not significantly different between those in a state of robustness and those in prefrailty, but it was much lower in those with frailty than in those with prefrailty. Meanwhile, sarcopenia prevalence was higher in those with frailty. However, no significant difference in body composition was found, depending on the degree of frailty.
In men, peripheral neuropathy and CAD were positively associated with the KCL scores, but diet therapy showed a negative association. Progressive factors, from prefrailty to frailty, involved CAD and inoccupation, while improvement factors, from prefrailty to robustness, involved diet therapy. Sarcopenia-related factors were age and living alone.
On the other hand, in women, %SMM and living alone were negatively related to the KCL score. Peripheral neuropathy was a related factor of prefrailty. None of the related factors of frailty showed significance. The factors related to sarcopenia included diabetes duration, diet therapy, and irregular lifestyle, while a higher LDL-C level was negatively associated with sarcopenia.
Frailty consists of the following three aspects: physical, psychological, and social frailties. Physical frailty was more frequently observed in those with frailty than in both men and women with prefrailty. The prevalence of sarcopenia was higher in frailty than in robustness and prefrailty. This is the first report to demonstrate that physical, psychological, and social frailty simultaneously existed at the time of sarcopenia diagnosis in type 2 diabetes. Importantly, as psychological and social functions were already reduced in the prefrailty stage in both men and women, a preventive strategy to address frailty should be introduced early, from the prefrailty stage.
Identifying older persons with prefrailty may be the first step in introducing early stage preventive strategies for frailty in older persons with type 2 diabetes. This study clarified that people with type 2 diabetes need comprehensive geriatric assessment. Several methods for evaluating frailty have been developed, and the KCL score was also considered a highly useful tool for comprehensive assessment in diabetes. On the other hand, body composition and BMI are unsuitable for frailty screening in type 2 diabetes, owing to their unremarkable association with frailty. This is partly because the participants’ mean BMI in this study was >24 kg/m2 in both men and women, as previously reported, 38 whereas in the general older population in Japan, it is approximately 23 kg/m.2,39 Another important finding in this study was that approximately 95% of sarcopenia cases in both men and women were determined by measuring grip strength. Hence, grip strength should be considered the most important screening method for frailty in daily practice.
Factors that promoted frailty and sarcopenia differed between the sexes. In men, the factors identified were social lifestyle-related factors, such as inoccupation and living alone. In a previous report, being married was cited as an improvement factor of frailty. 40 Many solitary men do not have partners to talk to or consult with. 41 In Japan, most older persons have not participated in social or volunteering activities, compared with those in other countries. 42 As inoccupation or living alone in men tend to be regarded as factors that lead to social isolation, providing these men with opportunities for social participation appears important.
On the other hand, living alone was an improvement factor of frailty in older women. Women tend not to be isolated, even if living alone, because they have acquaintances to talk with, regardless of the presence or absence of family. 41 In contrast, the performance level of IADL did not change in women, despite a decline in physical activity and cognitive function.
Among factors related to diabetes treatment, diet therapy is a risk factor of sarcopenia in women. Among older women with diabetes, dietary intake tends to decrease with age, 43 and body weight loss tends to be greater than in middle-aged women, owing to diet and exercise therapy. 44 Care should be exercised with dietary regimens for glycemic control to ensure that patients have adequate energy and the necessary nutrients. However, diet therapy was effective in men. Deviation from diets and excessive intake are likely to occur in men. 43 Correction of excessive energy intake and nutrient imbalance by diet therapy is considered appropriate for frailty prevention.
The literature has shown that cardiovascular events can be prevented by lowering LDL-C levels. However, LDL-C is also an indicator of nutritional status. The participants’ LDL-C level in this study did not deviate significantly from the target range. However, a low LDL-C level was a related factor of sarcopenia in women. Furthermore, in men, it was difficult to evaluate the association between LDL-C level and frailty because of the higher administration of statins in people with frailty (53.8% versus 42.6% in prefrailty versus 27.1% in robustness) and an association between CAD and frailty. Nevertheless, appropriate diet therapy are important for both women and men.
According to previous reports, targeted community-dwelling adults, with poor glycemic control have higher risk of frailty46,47 and reduced physical ability of the lower limbs.47,48 Meanwhile, an observational study in community-dwelling nursing home-eligible older persons with diabetes showed that a higher HbA1c level was associated with reduced functional decline or death. 49 In the present study, a relationship between glycemic control and frailty was not identified. This may be partly due to diabetes treatments provided by diabetes specialists and relatively good glycemic control.
Among the factors related to diabetic complications, peripheral neuropathy was a risk factor of frailty in men and of prefrailty in women. Peripheral neuropathy has been reported as a factor that accelerates muscle weakness and muscle mass decrease in older persons with type 2 diabetes.50–52 In addition, peripheral neuropathy is characterized by postural balance impairment, 53 slower and less effective balance responses, 54 walking speed reduction, 55 and fall risk. 56 Unsteadiness in walking not only hinders independent living in individuals with type 2 diabetes, but is also related to depression. 57 Furthermore, it is a risk factor of mortality. 58 In individuals with peripheral neuropathy, comprehensive functional evaluation, including physical function, and prevention of frailty and sarcopenia are necessary.
Although SDSCA was evaluated, a limitation of this study is that dietary content was not analysed. However, it is important to evaluate the self-management behaviours, which indicate whether a patient is making an effort to control their blood glucose levels. Second, although we included a large number of patients from a broad area, this study was conducted at a single center.Whether similar results would be obtained in other facilities or other areas remains unknown. Thus, we plan to analyze data using community-based study samples to determine whether the current result can be generalized. Third, because this study included elderly people aged 60–80 years with type 2 diabetes, it should be determined whether this result can be applied to the general population of people with type 2 diabetes, including younger generations.
In conclusion, sex differences in risk factors of frailty should be considered when selecting preventive strategies for older persons with type 2 diabetes, early in the prefrailty stage. In particular, it is important to evaluate social participation and diet therapy in men and skeletal muscle mass and psychosocial function in women.
Supplemental Material
Supplemental_Files_DM-Frail_TAEM – Supplemental material for Sex-related differences in frailty factors in older persons with type 2 diabetes: a cross-sectional study
Supplemental material, Supplemental_Files_DM-Frail_TAEM for Sex-related differences in frailty factors in older persons with type 2 diabetes: a cross-sectional study by Akiko Nishimura, Shin-ichi Harashima, Kiminori Hosoda, Hidenori Arai and Nobuya Inagaki in Therapeutic Advances in Endocrinology and Metabolism
Footnotes
Acknowledgements
A.N. and S.H. developed the concept, designed the study, conducted analysis and interpretation of data, and drafted the manuscript. K.H., H.A. and N.I. made substantial contributions to the conception, design, and interpretation of data and participated in drafting the manuscript and revising it critically. All authors reviewed and approved the drafts of the manuscript.
Funding
This work was supported by JSPS KAKENHI Grant Number JP18K17483.
Conflict of interest statement
The authors declare that there is no conflict of interest.
Supplemental material
Supplemental material for this article is available online.
References
Supplementary Material
Please find the following supplemental material available below.
For Open Access articles published under a Creative Commons License, all supplemental material carries the same license as the article it is associated with.
For non-Open Access articles published, all supplemental material carries a non-exclusive license, and permission requests for re-use of supplemental material or any part of supplemental material shall be sent directly to the copyright owner as specified in the copyright notice associated with the article.