
Abstract
Objectives
Observational studies have suggested a unidirectional association between frailty and diabetes; however, their causal relationship remains unclear. This study aimed to investigate the bidirectional causal associations between frailty and diabetes to provide more definitive evidence.
Methods
We conducted a two-sample Mendelian randomization study using genome-wide association study data to examine the bidirectional causal relationship between frailty—measured by the frailty index and Fried Frailty Phenotype—and diabetes, including type 2 diabetes mellitus, type 1 diabetes mellitus, fasting glucose, fasting insulin, and glycated hemoglobin. The inverse variance–weighted method was used for the primary analysis. Pleiotropy was assessed using the Mendelian randomization–Egger intercept and Mendelian randomization–PRESSO methods. Sensitivity analyses were performed using the leave-one-out approach and Cochran’s Q test to ensure robustness of the findings.
Results
Type 2 diabetes mellitus was significantly associated with both the frailty index (β = 0.029, 95% confidence interval: 0.014–0.043, p = 6.00 × 10⁻⁵) and the Fried Frailty Phenotype (β = 0.025, 95% confidence interval: 0.016–0.033, p = 2.78 × 10⁻⁹). Type 1 diabetes mellitus demonstrated a weaker positive association with the Fried Frailty Phenotype (β = 0.004, 95% confidence interval: 0.0004–0.009, p = 0.031). Among diabetes-related clinical traits, only glycated hemoglobin demonstrated significant associations with both the frailty index (β = 0.049, 95% confidence interval: 0.031–0.067, p = 7.39 × 10⁻⁸) and the Fried Frailty Phenotype (β = 0.013, 95% confidence interval: 0.001–0.024, p = 0.021). Reverse Mendelian randomization analyses indicated that frailty was significantly associated with an increased risk of type 2 diabetes mellitus and higher levels of glycated hemoglobin, but not with type 1 diabetes mellitus. Sensitivity analyses indicated no significant evidence of pleiotropy or heterogeneity (p > 0.05), supporting the reliability of the results.
Conclusions
Our findings suggest a bidirectional causal relationship between frailty and both type 2 diabetes mellitus and glycated hemoglobin. However, the association between type 1 diabetes mellitus and frailty remains inconclusive and requires further research. These results provide important evidence to guide the prevention and clinical management of frailty and diabetes.
Keywords
Introduction
Frailty, a common multifactorial pathological state among older adults, is a complex clinical condition strongly associated with aging. With the ongoing demographic shift toward an aging population, frailty—resulting from the progressive decline of multiple physiological systems—has become increasingly prominent. 1 A systematic review reported that the global prevalence rates of frailty and prefrailty among community-dwelling older adults are 13.6% and 30.9%, respectively. 2 The core characteristics of frailty primarily manifest as the body’s reduced ability to maintain homeostasis and a marked decline in resistance to internal and external environmental stressors. 3 This condition greatly increases the incidence of adverse health events and the risk of disease in older adults and other susceptible populations. Frailty has been recognized as one of the major challenges that urgently need to be addressed in the current global public health system. 4
Similarly, diabetes is considered a serious global public health concern, with its prevalence increasing significantly over the past few decades. According to the International Diabetes Federation data, the worldwide prevalence of diabetes among individuals aged 20–79 years was 10.5% (approximately 536.6 million) in 2021. 5 This figure is projected to rise to 12.2% by 2045, with the number of affected individuals reaching 783.2 million. Diabetes not only affects the patients’ quality of life but is also closely associated with the occurrence of various complications—including cardiovascular diseases, renal, retinal, and neurological diseases—significantly increasing the burden on healthcare systems. 6
Multiple epidemiological studies have reported an association between diabetes and frailty risk.7–9 A study conducted among elderly Chinese individuals demonstrated that among 18,010 people living with diabetes, 22.7% were classified as frail and 58.5% as prefrail. 10 People living with diabetes had a 1.6-fold higher risk of frailty than those not living with diabetes. 11 There is some evidence that frailty increases the risk of diabetes. A prospective cohort study from the UK Biobank revealed that prevention or mitigation of frailty may lower the risk of type 2 diabetes mellitus (T2DM). The study found that changes in frailty status over time were associated with the risk of developing T2DM. 12 Additionally, other studies have reported associations between diabetes-related clinical indicators and frailty. 9 However, due to the potential for reverse causation and confounding factors, there remains a dearth of direct empirical evidence establishing a causal link between diabetes, its associated metabolic markers, and frailty.
Mendelian randomization (MR) is a novel statistical method based on the principles of Mendelian genetics. It uses randomly assigned genetic variations to account for genetic factors, allowing for a more accurate assessment of the correlations between genes, environmental factors, and diseases. 13 This method has been widely applied in genetic and epidemiological research.14,15 A recent MR study investigated the associations between cardiovascular and metabolic diseases and frailty and reported an association between T2DM and frailty. 16 However, the reverse association between T2DM and frailty and the relationship between type 1 diabetes mellitus (T1DM) and frailty have not been fully explored. Moreover, the associations between diabetes-related clinical indicators and frailty remain uncertain. Therefore, a bidirectional MR analysis was conducted in this study to explore the relationship between frailty, diabetes, and relevant indicators.
Materials and methods
Study design
This study adopted a bidirectional MR approach, as depicted in Figure 1, using large-scale data from genome-wide association studies (GWAS). Data from the FinnGen consortium were initially analyzed to explore potential associations between diabetes and frailty. Preliminary findings were then validated using data from the MRC Integrative Epidemiology Unit (IEU) GWAS and the DIAGRAM Consortium to strengthen the robustness of the conclusions. Moreover, the potential associations between diabetes-related clinical indicators (including glycated hemoglobin (HbA1c), fasting glucose (FG), and fasting insulin) and frailty were analyzed. The reporting and analysis of this study followed the Strengthening the Reporting of Observational Studies in Epidemiology Using Mendelian Randomization (STROBE-MR) checklist. All data were publicly available, and the original study had obtained ethical approval and informed consent from the participants. 17 This study was conducted in accordance with the ethical principles of the Helsinki Declaration of 1975, as revised in 2024.

Overview of the bidirectional MR analysis. MR: Mendelian randomization.
Data sources
Data on the frailty index (FI) were obtained from a recent GWAS meta-analysis conducted by the UK Biobank and the Swedish TwinGene consortium. 18 The dataset included 175,226 individuals of European ancestry, with a sex distribution of 90,061 women and 85,607 men, aged 41–93 years. The FI was used to quantify the degree of frailty based on the concept of health-deficit accumulation. It is calculated by dividing the number of health deficits by the total number of measured deficits, with a minimum threshold of 30. The deficits encompass a broad spectrum, including symptoms, disabilities, and diseases. Thus, the FI scores range from 0 to 1, where 0 indicates the absence of frailty and 1 signifies the highest level of frailty. 19
Data on the Fried Frailty Score (FFS) were obtained from the UK Biobank, which contained a comprehensive dataset of 386,565 participants. 20 The FFS assigns individuals a score ranging from 0 to 5 based on specific criteria such as unintentional weight loss, a sense of exhaustion, diminished physical activity levels, reduced gait speed, and decreased grip strength. Notably, no single universally accepted definition or metric for frailty exists. 21 Nonetheless, the FI and FFS are recognized as two of the most established frailty assessment methods. Despite being conceptually distinct, both methods effectively identify the determinants of frailty and accurately classify individuals as frail and nonfrail.
Diabetes-relevant data were obtained from multiple GWAS statistics or meta-analyses. The aggregated GWAS data from the FinnGen database were analyzed preliminarily, which included data from 49,101 cases and 370,829 controls for T2DM and 2947 cases and 450,786 controls for T1DM. 22 For validation analysis, T2DM data were obtained from the DIAGRAM Consortium, an international research collaboration focused on the genetics of T2DM, which included data from 19,119 cases and 423,698 controls. 23 A T1DM GWAS meta-analysis by Forgetta et al. 24 included a comprehensive dataset from 12 European cohorts comprising 9266 cases and 15,574 controls. Data on diabetes-related indicators can be extracted from publicly accessible GWAS datasets. 24 All data and methods are summarized in Table S1.
Selection of instrumental variables (IVs)
For the IVs used in the MR analysis, three key assumptions were required:
Relevance: the selected single nucleotide polymorphisms (SNPs) must be strongly associated with the exposure (diabetes), ensuring the validity of the IVs. Exclusivity: the IVs should influence the outcome (frailty) only through the exposure (diabetes) and not be directly associated with the outcome itself. Independence: the SNPs must not be associated with confounders or influenced by the outcome (frailty).
Based on these assumptions, SNPs meeting the genome-wide significance threshold (p < 5 × 10⁻⁸) were selected as candidate IVs. 6 To account for potential confounding due to linkage disequilibrium (LD), we applied PLINK to remove SNPs in LD (r2 < 0.001, within a genetic distance of 10,000 kb). 25
To minimize bias from weak instruments, the strength of IVs was assessed using the F-statistic, calculated as follows: F = R2 × (N − 2)/(1 − R2), where R2 = 2 ×EAF × (1 − EAF) × β2, with EAF representing the effect allele frequency, β the estimated SNP effect, and N the GWAS sample size. IVs with an F-statistic >10 were considered sufficiently strong, while those with F <10 were excluded. 26
MR analysis
The inverse variance–weighted (IVW) method was used as the primary analysis, with MR-Egger regression and the weighted median method as supplementary analyses. 27 The IVW technique is central to MR analysis, combining the Wald ratios from individual SNPs using a meta-analytic approach. This method is based on the assumption of no horizontal pleiotropy, ensuring the accuracy of the assessment when IVs influence the outcome only through a specific exposure. The weighted median method synthesizes data across multiple genetic variants into a unified causal estimate, maintaining consistency provided that most weights are derived from valid IVs. Conversely, the MR-Egger regression method detects directional pleiotropy among genetic variants and provides robust causal effect estimates even in the presence of potential pleiotropy. 28
Sensitivity analysis
Various methods were used to assess and appraise the heterogeneity and stability of the results. The Cochran’s Q test, derived from the IVW estimation, was used to detect heterogeneity among the IVs, with a p-value threshold of less than 0.05 indicating significant variability. The MR-Egger method analyzed the potential horizontal pleiotropy of SNPs; a nonsignificant intercept near zero indicates no pleiotropy, while a significant deviation indicates pleiotropy. 29 The MR-Egger method was utilized to further scrutinize potential horizontal pleiotropy; a nonsignificant intercept near zero indicates the absence of pleiotropy, while a significant deviation suggests its presence. 30 The MR-PRESSO method was used to accurately locate and correct outliers and horizontal multieffect residuals to improve the reliability of MR analysis. 31 The “leave-one-out” cross-validation method was used to evaluate the influence of individual SNPs by iteratively excluding one and reanalyzing the remaining SNPs, thereby quantifying each SNP’s contribution to the overall causal effect. 32 Scatter, funnel, and forest plots were used to further illustrate the MR analysis outcomes.
Statistical analysis
The results were presented as odds ratios (ORs) and beta coefficients (β). An OR greater than 1 indicates a positive association, suggesting that the exposure may increase the risk of the outcome, whereas an OR less than 1 indicates an inverse association, suggesting a potential risk reduction. For continuous outcomes, a positive β value indicates that the exposure is associated with an increase in the outcome measure, while a negative β value indicates a decrease.
All analyses were conducted via R software (version 4.3.1) using the packages Two Sample MR, Mendelian Randomization, MR-PRESSO, and Radial MR. Statistical significance was defined as p < 0.05.
Results
Selection of IVs
After eliminating LD, SNPs were screened based on F-statistics and adjusted for allele conditions. The numbers of SNPs associated with T2DM and FI were 110 and 303, and the numbers of SNPs associated with T2DM and FFS were 97 and 354, respectively. The numbers of SNPs associated with T1DM and FI were 19 and 23, and the numbers of SNPs associated with T1DM and FFS were 11 and 25, respectively. Regarding diabetes-related clinical indicators, the numbers of SNPs related to HbA1c, FG, and fasting insulin were 264, 54, and 26, respectively. These SNPs were used as IVs in this study. In the reverse analysis, the number of SNPs for FI and FFS with diabetes and related indicators ranged from fewer than 6 to 27. All selected SNPs had F-statistics greater than 10, indicating sufficient instrument strength and reliable statistical power, thereby minimizing weak instrument bias. Detailed information on the selected SNPs is provided in Table S2.
Causal relationship between diabetes and frailty
In the FinnGen database, the IVW method showed that T2DM was positively associated with FI (β = 0.029, 95% confidence interval (CI): 0.014–0.043, p = 6.00E-05) and FFS (β = 0.025, 95% CI: 0.016–0.033, p = 2.78E-09). T1DM was not significantly associated with FI (β = 0.001, 95% CI: −0.009 to 0.011, p = 0.842) but was positively associated with FFS (β = 0.004, 95% CI: 0.0004–0.009, p = 0.031) (Table 1). Repeated analyses supported these findings, showing significant positive associations between T2DM, FI, and FFS. However, in the validation analysis, the association between T1DM and FI was reversed compared with the initial results (Table 2).
MR analysis between frailty and T1DM and T2DM.

CI: confidence interval; FFS: Fried Frailty Score; FI: frailty index; GWAS: genome-wide association study; IVW: inverse variance weighted; MR: Mendelian randomization; Nsnp: number of single nucleotide polymorphisms; OR: odds ratio; SE: standard error; T1DM: type 1 diabetes mellitus; T2DM: type 2 diabetes mellitus.
MR analysis of the association between T1DM and T2DM with frailty.
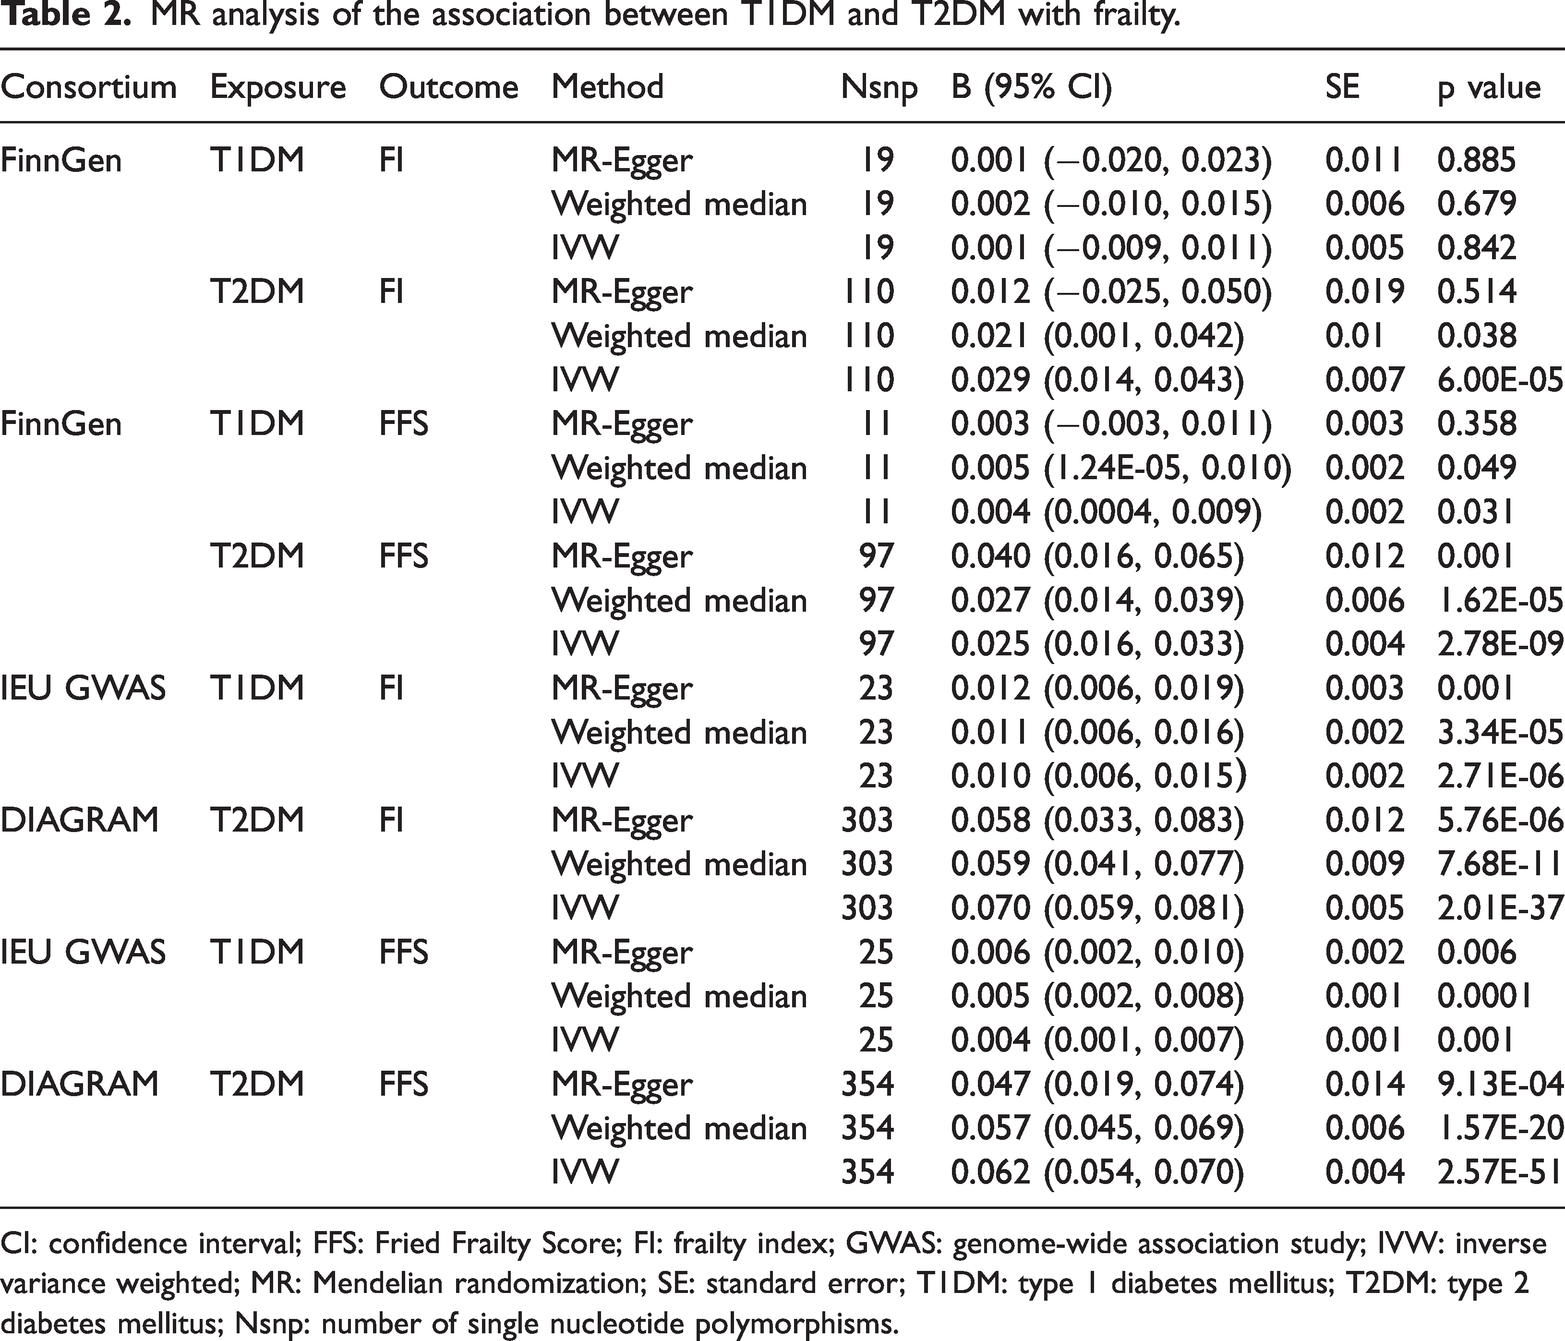
CI: confidence interval; FFS: Fried Frailty Score; FI: frailty index; GWAS: genome-wide association study; IVW: inverse variance weighted; MR: Mendelian randomization; SE: standard error; T1DM: type 1 diabetes mellitus; T2DM: type 2 diabetes mellitus; Nsnp: number of single nucleotide polymorphisms.
Sensitivity analysis
We conducted a comprehensive set of sensitivity analyses to ensure the robustness of our findings, including MR-Egger intercept analysis, MR-PRESSO, funnel plot assessment, Cochran’s Q test, and leave-one-out analysis. Both MR-PRESSO and MR-Egger methods yielded nonsignificant p-values (p > 0.05) for T2DM and T1DM, indicating no evidence of horizontal pleiotropy and suggesting that the observed associations were unlikely to be confounded by shared factors influencing both exposure and outcome.
The results of Cochran’s Q test, as summarized in Table S3, indicated no statistically significant heterogeneity among the included SNPs (p > 0.05), supporting the consistency of the effect estimates. Furthermore, leave-one-out analysis confirmed the stability of the results: sequential omission of individual SNPs did not materially alter the causal estimates, demonstrating that no single variant disproportionately influenced the associations.
These convergent findings underscore the reliability of our MR results and strengthen confidence that the observed causal effects are independent of pleiotropy or undue influence from any single SNP. A detailed description of the leave-one-out analysis is provided in Supplementary Document 1.
Causal relationship between frailty and diabetes
In addition to analyzing the effects of diabetes on frailty, reverse analyses were conducted to explore the potential impact of frailty on the development of diabetes. The results revealed significant positive correlation between the FI and FFS with T2DM. IVW revealed an OR of 1.967 (95% CI: 1.512–2.560, p = 4.62E-07) for FI and an OR of 3.898 (95% CI: 2.922–5.200, p = 2.15E-20) for FFS with T2DM. The FI was associated with T1DM (OR: 4.609, 95% CI: 1.52–13.968, p = 0.006); however, no significant association was observed between FFS and T1DM (OR: 1.025, 95% CI: 0.440–2.388, p = 0.431). However, the wide confidence interval for FI and T1DM suggests that this association is less reliable. Further repeated analyses reinforced these findings, confirming a significant association between frailty and T2DM but not T1DM. Detailed results are presented in Table 1.
Sensitivity analysis
Although the previous section addressed sensitivity analyses for the effects of diabetes on frailty, we herein present the corresponding analyses for the reverse direction (frailty on diabetes). We further evaluated the robustness of the reverse MR analyses with FI and FFS as exposures. MR-PRESSO and MR-Egger regression yielded nonsignificant p-values (p > 0.05), indicating no evidence of horizontal pleiotropy. This suggests that the observed associations were unlikely to be confounded by shared factors influencing both frailty and diabetes. Cochran’s Q test results (Table S4) showed no significant heterogeneity among the included SNPs (p > 0.05). Leave-one-out analysis additionally confirmed the stability of the results: sequential exclusion of individual SNPs did not materially alter the causal estimates, indicating that no single variant exerted undue influence. Collectively, these findings demonstrate that the reverse MR results are robust and not driven by pleiotropy or any single SNP. Supplementary Document 1 provides visual representations of the leave-one-out analyses.
Association between diabetes-related clinical indicators and frailty
After analyzing GWAS summary statistics, the clinical indicator SNPs associated with diabetes were identified as IVs. This selection comprised 54 SNPs related to FG, 264 SNPs to HbA1c, and 26 SNPs to fasting insulin. IVW indicated a significant causal relationship between HbA1c and frailty (β = 0.049, 95% CI: 0.031–0.067, p = 7.39E-08), although no association was observed for the other indicators. In reverse causality analysis, frailty was not significantly associated with FG or fasting insulin, but a robust positive association was again observed with HbA1c (β = 1.200, 95% CI: 1.115–1.291, p = 1.18E-06). Detailed results are presented in Supplementary Document 2.
Sensitivity analysis
Heterogeneity analyses revealed no significant differences between frailty and glycemic indicators, including FG, HbA1c, and fasting insulin. Pleiotropy analyses also provided no evidence that multiple genetic pathways confounded these associations. Supporting data are available in Supplementary Documents 1 and 2. The MR-Egger intercept analysis further confirmed the absence of horizontal pleiotropy in the associations between frailty and glycemic indicators. After excluding outliers, MR-PRESSO validation also supported these results, indicating that FG, fasting insulin, and HbA1c did not exert significant horizontal pleiotropic effects on frailty. Reverse MR analyses similarly demonstrated no evidence of heterogeneity or pleiotropy between frailty and the glycemic indicators, as detailed in Supplementary Documents 1 and 2.
Discussion
This study employed a bidirectional two-sample MR approach to investigate the causal relationships between frailty, T1DM, T2DM, and diabetes-related clinical indicators. Our findings suggest that T2DM is causally associated with increased frailty, while the association between T1DM and frailty remains inconclusive and requires further investigation. Among the clinical biomarkers assessed, HbA1c emerged as a key indicator, demonstrating consistent bidirectional associations with frailty. Reverse MR analyses suggested that frailty increases the risk of T2DM, but not T1DM. Sensitivity analyses confirmed the robustness and reliability of these results. To the best of our knowledge, this is the first MR study to provide genetic evidence supporting a bidirectional association between diabetes, HbA1c, and frailty.
These results further confirm the bidirectional association between T2DM and frailty, providing new genetic evidence relevant to the prevention of both conditions. This addresses the limitations of previous observational studies, which identified only a unidirectional association between T2DM and frailty while eliminating the influence of confounding factors.8,9,33–36 For example, a study using data from the China Health and Retirement Longitudinal Study reported that as the prevalence of diabetes increased, the likelihood of severe frailty in people living with diabetes also increased. 7 Similarly, a meta-analysis of 32 observational studies found that diabetes increases the risk of frailty in older adults. 11 Additionally, Wu et al. 12 reported that T2DM patients who were frail or near-frail were more likely to develop diabetic microvascular problems. Another longitudinal cohort study involving middle-aged and older Chinese adults found that frailty (frailty phenotype and FI) was significantly associated with the risk of T2DM and dyslipidemia. 37 The sensitivity analysis further confirmed the robustness of the results. Our current study establishes the relationship between T2DM and frailty. Early identification of frailty in older adults and people living with diabetes is crucial. Older adults, especially those with diabetes, who were once frail, are more likely to be hospitalized for physical dysfunction, reduced quality of life, and significantly increased risk of hypoglycemia and mortality. The international diabetes management guidelines recommend that frailty identification and assessment be integrated into routine diabetes management. 33 They further recommend setting more lenient HbA1c targets for frail older patients, along with enhanced prevention and monitoring of hypoglycemia risks. Therefore, frailty should be considered a core factor when setting glycemic control targets for people living with diabetes. Frailty in older adults and people living with diabetes should be screened and evaluated in real-world clinical settings.
However, it is worth noting that this study did not identify a causal association between T1DM and frailty. In addition to the potential differences in phenotype definitions and pathophysiological mechanisms, these results may have been partially influenced by survival bias. T1DM is an early-onset, lifelong disease characterized by complex management and significantly reduced life expectancy. Therefore, individuals with T1DM who survive to middle and old age and are included in the frailty GWAS dataset of this study may represent a survival advantage group shaped by natural selection. This subgroup may delay frailty progression through long-term glycemic control (such as sustained HbA1c standards). Conversely, individuals with T1DM at higher risk of frailty due to poor glycemic control may have died prematurely and thus were not included in the study sample. This systematic bias can obscure or underestimate the true causal effect of T1DM on frailty, potentially resulting in weak or nonsignificant associations at the genetic level. This finding further underscores the complexity of the relationship between T1DM and frailty. Future research should adopt methodological strategies such as competing risk models or dynamic designs based on incident cohorts to correct for such biases and elucidate the potential causal relationship between the two.
Several mechanisms have been proposed to explain the causal link between diabetes and frailty. Chronic inflammation, oxidative stress, and metabolic syndrome are key contributors to frailty.38,39 Furthermore, diabetes-related microvascular and macrovascular complications—such as retinopathy, nephropathy, and neuropathy—may lead to progressive functional decline through multiple pathways, ultimately resulting in frailty.40–43 Concurrently, frailty itself may influence diabetes progression through multiple mechanisms. Frail individuals often exhibit reduced physical activity, decreased muscle mass, impaired immune function, and malnutrition, all of which may exacerbate diabetes progression. 44 Notably, this bidirectional relationship pattern is common between frailty and multiple comorbidities, with prior MR studies supporting bidirectional causality between frailty and several cardiac and psychiatric disorders.16,45
Additionally, the results revealed a significant association between HbA1c and frailty, consistent with the findings of a cross-sectional study conducted in Brazil, further validating the close relationship between the two variables. 46 However, no causal relationship was observed between other indicators (such as FG and fasting insulin) and frailty in this study. This discrepancy can be explained as follows: 1. HbA1c, a marker of long-term blood glucose control, better reflects long-term average blood glucose levels and their underlying biological mechanisms than single measurements of FG or postprandial glucose. 47 FG and fasting insulin levels are more influenced by immediate dietary intake, stress responses, or short-term lifestyle changes, making their association with frailty less significant. 2. The results of observational studies may be biased by factors such as confounding variables or reverse causality. Therefore, for people living with diabetes, effective glycemic control, particularly maintaining HbA1c within the target range, is crucial for preventing and delaying the progression of frailty. However, the HbA1c setting goals should be individualized, particularly for older patients. For frail individuals, efforts should focus on improving frailty status, such as increasing high-quality protein intake and engaging in resistance exercises tailored to patients’ preferences and endurance.
One of the major strengths of this study is the use of the MR design, which minimizes the influence of unmeasured confounding and enhances the reliability of causal inferences regarding the bidirectional association between diabetes and frailty. The application of a discovery–replication framework further enhances the credibility of our findings.
Nevertheless, several limitations should be acknowledged. First, the GWAS datasets used were primarily derived from European populations, limiting the generalizability of our results to other ethnic groups (e.g. Asian or African). Differences in genetic background, lifestyle, and susceptibility to diabetes and frailty across populations warrant further research in diverse cohorts. Second, the FI and Fried phenotype used in this study are composite measures that partially rely on subjective assessments. Consequently, residual confounding may persist, and genetic instruments cannot fully eliminate these influences, posing challenges to the robustness of causal inference. Third, although our sensitivity analyses supported the robustness of the results, subtle pleiotropic effects cannot be completely ruled out, as they may be distributed across the genome. Finally, the GWAS datasets lacked stratified analyses by sex, age, or disease duration, which may have limited the exploration of subgroup-specific effects and the influence of disease progression.
Conclusion
This MR study suggests a significant bidirectional causal association between genetically predicted T2DM and frailty. The relationship between T1DM and frailty remains uncertain and warrants further investigation. Among diabetes-related clinical indicators, HbA1c demonstrated particularly strong and consistent associations with frailty. These findings provide novel genetic evidence for the complex interplay between diabetes, its clinical markers, and frailty. For individuals living with diabetes, comprehensive management strategies—including lifestyle interventions and appropriate pharmacological treatment—may help optimize glycemic control, slow disease progression, and reduce frailty risk. Early assessment of frailty or prefrailty is also recommended, with interventions such as nutritional support, structured exercise programs, and social support to prevent or delay the onset and progression of diabetes. Future research should further clarify the underlying physiological mechanisms linking diabetes and frailty and develop targeted interventions to mitigate the combined health burden of these two highly prevalent conditions in older adults. Although some of the observed effect sizes were modest, they may still have meaningful clinical and public health implications, given the widespread prevalence of frailty and diabetes in aging populations.
Supplemental Material
sj-pdf-1-imr-10.1177_03000605251381463 - Supplemental material for Assessment of relationships between frailty and diabetes: A two-sample Mendelian randomization study
Supplemental material, sj-pdf-1-imr-10.1177_03000605251381463 for Assessment of relationships between frailty and diabetes: A two-sample Mendelian randomization study by Lan Zhang, Shanshan Cui, Sha Liu, Cong Fu, Yan Qin, Yawei Liu and Shengfang Yao in Journal of International Medical Research
Supplemental Material
sj-pdf-2-imr-10.1177_03000605251381463 - Supplemental material for Assessment of relationships between frailty and diabetes: A two-sample Mendelian randomization study
Supplemental material, sj-pdf-2-imr-10.1177_03000605251381463 for Assessment of relationships between frailty and diabetes: A two-sample Mendelian randomization study by Lan Zhang, Shanshan Cui, Sha Liu, Cong Fu, Yan Qin, Yawei Liu and Shengfang Yao in Journal of International Medical Research
Supplemental Material
sj-pdf-3-imr-10.1177_03000605251381463 - Supplemental material for Assessment of relationships between frailty and diabetes: A two-sample Mendelian randomization study
Supplemental material, sj-pdf-3-imr-10.1177_03000605251381463 for Assessment of relationships between frailty and diabetes: A two-sample Mendelian randomization study by Lan Zhang, Shanshan Cui, Sha Liu, Cong Fu, Yan Qin, Yawei Liu and Shengfang Yao in Journal of International Medical Research
Supplemental Material
sj-pdf-4-imr-10.1177_03000605251381463 - Supplemental material for Assessment of relationships between frailty and diabetes: A two-sample Mendelian randomization study
Supplemental material, sj-pdf-4-imr-10.1177_03000605251381463 for Assessment of relationships between frailty and diabetes: A two-sample Mendelian randomization study by Lan Zhang, Shanshan Cui, Sha Liu, Cong Fu, Yan Qin, Yawei Liu and Shengfang Yao in Journal of International Medical Research
Footnotes
Acknowledgments
We would like to thank the UK Biobank, the FinnGen database, and the DIAGRAM Consortium for providing publicly available genome-wide association study (GWAS) summary data used in this study. We are grateful to the participants and researchers of these studies for their invaluable contributions. No AI tools were used in the preparation or editing of this manuscript.
Author contributions
Study conceptualization: ZL and CSS. Study design: ZL and CSS. Data acquisition: LS. Data analysis: LS and FC. Manuscript preparation: ZL and LYW. Manuscript revision: LYW and YSF. Literature review: ZL, CSS, and QY. All authors have read and approved the final submitted article.
Data availability statement
This study utilized publicly available summary-level data from genome-wide association studies (GWAS). All data sources are as follows:
Exposure and outcome data: Obtained from the IEU Open GWAS database.
Additional data: Sourced through the FinnGen Consortium and DIAGRAM Consortium.
The original studies from which these datasets were derived had received ethical approval and informed consent from participants. No additional ethical review was required for this secondary analysis, as it did not involve individual-level data or new sample collection.
Declaration of conflicting interests
The authors declare no competing financial interests or personal relationships that could have influenced the work reported in this paper.
Ethics statement
This study used only publicly available summary-level genome-wide association study (GWAS) data (FinnGen, IEU GWAS, and DIAGRAM Consortium). No new individual-level data were collected, and no direct contact with human participants occurred. The Institutional Review Board of Hebei University Affiliated Hospital, Clinical Medical College Ethics Committee, confirmed that this secondary data analysis is exempt from ethical review. All original GWAS had previously obtained ethical approval and informed consent from the participants.
Funding
This work received support from National Natural Science Foundation of China (Grant No.82103181), Natural Science Foundation of Hebei Province (Grant No. H2023201018), Scientific Research Project of the Hebei Administration of Traditional Chinese Medicine (Grant No. 2024071, 2025060), and Hebei University 2025 Undergraduate Innovation Training Program Project (Grant No. 202410075034).
Supplemental material
Supplemental material for this article is available online.
References
Supplementary Material
Please find the following supplemental material available below.
For Open Access articles published under a Creative Commons License, all supplemental material carries the same license as the article it is associated with.
For non-Open Access articles published, all supplemental material carries a non-exclusive license, and permission requests for re-use of supplemental material or any part of supplemental material shall be sent directly to the copyright owner as specified in the copyright notice associated with the article.