
Abstract
Objectives
This study aimed to investigate the correlation between homeostasis model assessment of insulin resistance (HOMA-IR) and non-alcoholic fatty liver disease (NAFLD) in the non-diabetic population and establish its diagnostic efficacy.
Methods
This observational study involved participants divided into NAFLD and non-NAFLD groups, and baseline data were analyzed. Univariate and multivariate logistic regression analyses were used to correlate HOMA-IR with the risk of NAFLD. Receiver operating characteristic (ROC) curves were used to evaluate the diagnostic efficacy of HOMA-IR for NAFLD. Subgroup analyses of non-obese individuals were performed.
Results
Overall, 2234 non-diabetic participants were included. The HOMA-IR was significantly higher in the NAFLD group than in the non-NAFLD group. Multivariate logistic regression analysis showed that HOMA-IR was a strong and independent risk factor for NAFLD after correcting for confounding factors. The area under the ROC curve (AUC) value of HOMA-IR for predicting NAFLD was 0.792. In the non-obese non-diabetic population, HOMA-IR was an independent risk factor for increased risk of lean NAFLD after correcting for confounding factors. The AUC value of HOMA-IR for predicting lean NAFLD was 0.770.
Conclusions
HOMA-IR is independently associated with the risk of NAFLD in the non-diabetic and non-obese non-diabetic populations and has good diagnostic value.
Keywords
Introduction
Non-alcoholic fatty liver disease (NAFLD) has become the most common chronic liver disease worldwide. 1 NAFLD is closely associated with the risk of developing a variety of extrahepatic complications, such as type 2 diabetes mellitus (T2DM), cardiovascular disease, and dementia. It is also increasingly recognized as a hepatic component of metabolic syndrome. 2 T2DM is a major risk factor for NAFLD. A meta-analysis of 80 studies from 20 countries found that the overall prevalence of NAFLD in patients with T2DM was 55.5%. 3 In turn, NAFLD increased the risk of developing T2DM. 4 Obesity plays a key role in NAFLD, but lean NAFLD is a common but easily overlooked disease. 5 Therefore, detecting patients with NAFLD among the non-diabetic population is of great significance for the early prevention and treatment of NAFLD and diabetes. Insulin resistance is an important characteristic of NAFLD. The insulin resistance index determined using the homeostasis model assessment of insulin resistance (HOMA-IR) is generally used to evaluate insulin resistance in clinical practice. The aim of this study was to explore the correlation between HOMA-IR and the risk of NAFLD in a non-diabetic population and establish its diagnostic value.
Materials and methods
Study participants
This was an observational study with data from people undergoing health examinations at the Guangzhou Cadre Health Management Center. The participants were randomly selected from 2021 to 2022. Patients with any of the following were excluded from the study: (1) a history of diabetes or taking diabetes medication; (2) a history of viral hepatitis, autoimmune hepatitis, liver malignancy, drug-induced liver disease, or hepatolenticular degeneration; (3) a history of excessive drinking; (4) severe liver or kidney insufficiency; (5) incomplete clinical data. All enrolled participants provided written informed consent. This study was approved by the Ethics Committee of Guangzhou Cadre Health Management Center, Guangdong Province, China (No. K2022-07, approval date: 1 August 2022). All patient details have been de-identified here. This study report complies with STROBE guidelines. 6
Test method
The name, sex, age, current medical history, past medical history, and recent medication information were collected from each patient. Their height and body weight were measured. The body mass index (BMI) was calculated as the weight (kg) divided by the height squared (m2). Participants with BMI ≥25 kg/m2 were deemed obese and participants with BMI <25 kg/m2 were considered non-obese. The participants fasted for 10 to 12 hours before blood was drawn. Venous blood was drawn the next morning to detect levels of fasting blood glucose (FBG), triglyceride (TG), total cholesterol (TC), high density lipoprotein cholesterol (HDL-C), low density lipoprotein cholesterol (LDL-C), insulin, γ-glutamyl transpeptidase (γ-GT), alanine aminotransferase (ALT), aspartate aminotransferase (AST), and uric acid (UA). The insulin resistance index was calculated as follows: HOMA-IR = FBG (mmol/L) × fasting insulin (µU/mL)/22.5. The “lean NAFLD” group included non-obese patients with NAFLD, while the “obese non-NAFLD” group included obese patients who did not have NAFLD. NAFLD was diagnosed by two experienced physicians using computed tomography (CT).
Statistical analysis
Statistical analysis was performed using IBM SPSS Statistics for Windows, version 25.0 (IBM Corp., Armonk, NY, USA). Data for continuous variables that were not normally distributed are shown as median and interquartile range. The Mann–Whitney U test was used to analyze differences between two groups. Continuous variable data that were normally distributed are shown as mean ± standard deviation. The independent sample t-test was used for comparison between groups. Categorical data are shown as percentages. The chi-square test was used for comparisons between groups. Using the quartiles of HOMA-IR, four groups were established: Q1 ≤ 1.76; 1.76 < Q2 ≤2.52; 2.52 < Q3 ≤3.70; 3.70 < Q4. Logistic regression analysis was used to assess the association between HOMA-IR and the risk of NAFLD in the overall population and in non-obese subgroups. Odds ratios (ORs) and 95% confidence intervals (CIs) were calculated with Q1 as the dummy variable. The diagnostic value of HOMA-IR for NAFLD was determined using receiver operating characteristic (ROC) curve analysis. A P-value <0.05 showed that the difference was statistically significant and a P-value <0.001 showed that the difference was remarkable statistically significant.
Results
Comparison of baseline data between the non-NAFLD and NAFLD groups
In total, 2234 participants who had no history of diabetes or were taking diabetes medication were included in the study. There were 1681 men and 553 women between 25 and 85 years old. The overall prevalence of NAFLD in this study was 17.7%. Among the 981 obese participants, 281 had NAFLD, while 700 were non-NAFLD cases. A total of 1253 non-obese participants, including 114 lean NAFLD and 1139 non-NAFLD cases, were identified. Compared with the non-NAFLD group, the NAFLD group showed a significant elevation in BMI, higher number of men, more hypertension cases, and significantly increased levels of FBG, HOMA-IR, UA, TG, AST, ALT, and γ-GT (P < 0.05). The HDL-C and LDL-C levels in the NAFLD group were significantly lower than those in the non-NAFLD group (P < 0.05). No significant difference in age or TC levels was found between the two groups (Table 1).
Comparison of baseline data between the non-alcoholic fatty liver disease (NAFLD) and non-NAFLD groups.

BMI, body mass index; FBG, fasting blood glucose; HOMA-IR, homeostasis model assessment of insulin resistance; UA, uric acid; TG, triglyceride; TC, total cholesterol; HDL-C, high density lipoprotein cholesterol; LDL-C, low density lipoprotein cholesterol; AST, aspartate aminotransferase; ALT, alanine aminotransferase; γ-GT, γ-glutamyl transpeptidase.
Analysis of the prevalence of NAFLD with HOMA-IR quartiles in the overall non-diabetic population
The prevalence of NAFLD increased with higher HOMA-IR levels. The prevalence of NAFLD was 3.9%, 6.4%, 19.2%, and 41.2%, in Q1 to Q4, respectively. The risk of NAFLD was significantly increased in the Q3 and Q4 groups compared with the Q1 group (P < 0.001), as shown in Table 2.
Univariate analysis of the relationship between homeostasis model assessment of insulin resistance (HOMA-IR) and non-alcoholic fatty liver disease (NAFLD) in the overall population.

OR, odds ratio; CI, confidence interval.
Comparison of baseline data between the lean NAFLD and obese non-NAFLD groups
The lean NAFLD group had significantly higher levels of FBG, HOMA-IR, TG, TC, and ALT, as well as lower BMI and fewer men, than the obese non-NAFLD group (P < 0.05) (Table 3).
Comparison of baseline data between the lean non-alcoholic fatty liver disease (NAFLD) group and obese non-NAFLD group.
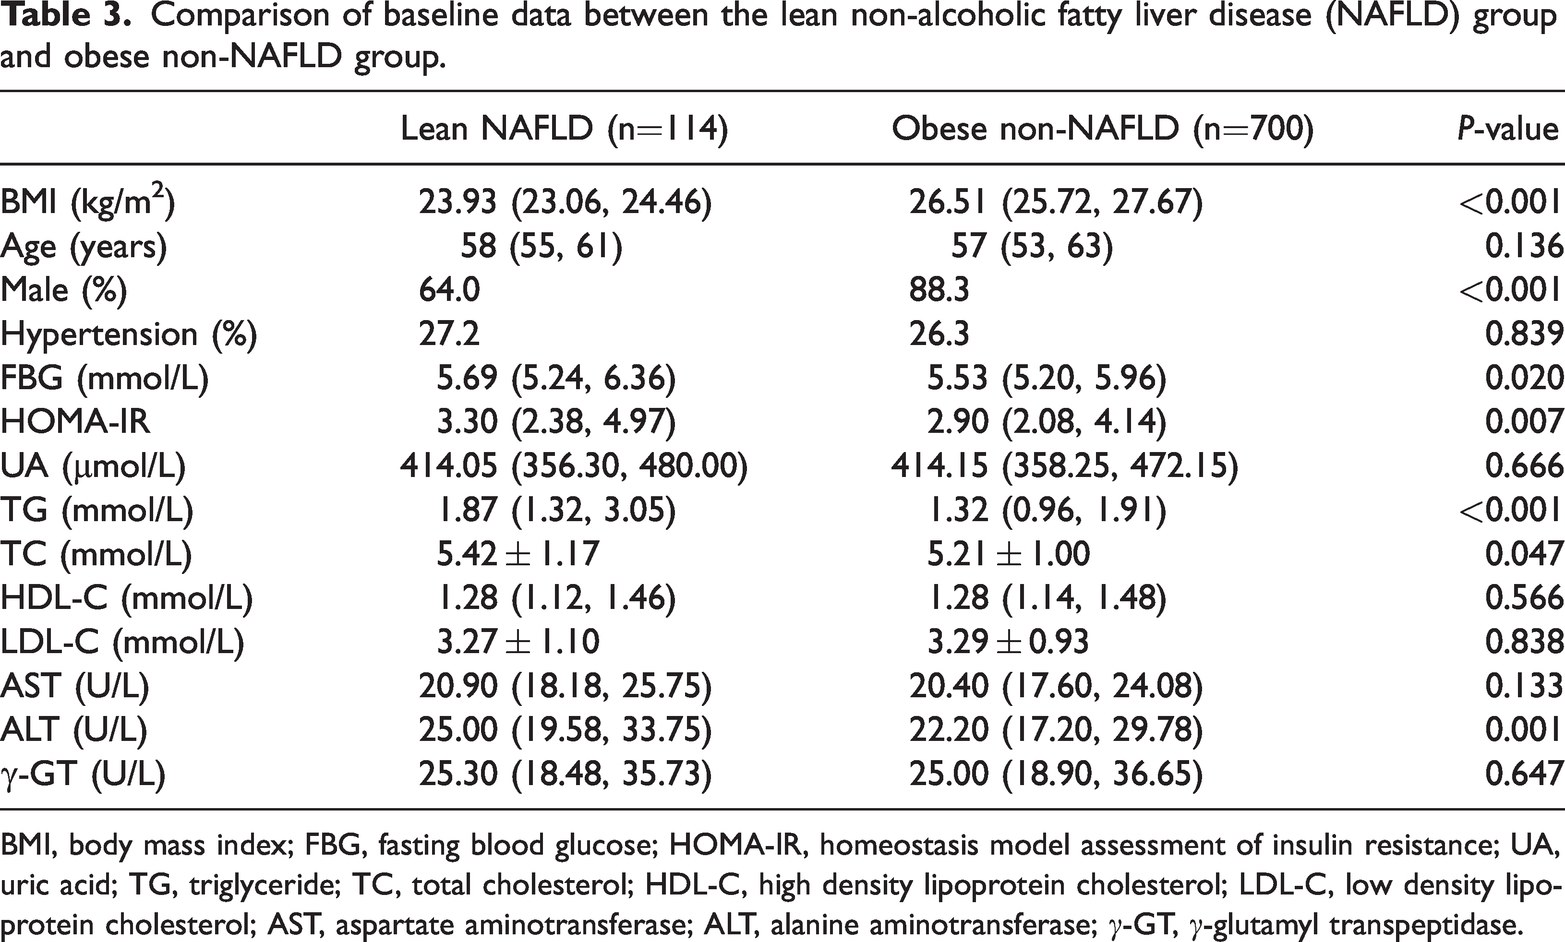
BMI, body mass index; FBG, fasting blood glucose; HOMA-IR, homeostasis model assessment of insulin resistance; UA, uric acid; TG, triglyceride; TC, total cholesterol; HDL-C, high density lipoprotein cholesterol; LDL-C, low density lipoprotein cholesterol; AST, aspartate aminotransferase; ALT, alanine aminotransferase; γ-GT, γ-glutamyl transpeptidase.
Logistic regression analysis of HOMA-IR and the risk of NAFLD in the overall population and non-obese subgroup
In the overall population, univariate logistic regression analysis showed that HOMA-IR was significantly associated with the risk of NAFLD (OR: 1.656, 95% CI = 1.553–1.767, P < 0.001), as shown in Table 2. Multivariate logistic regression analysis results suggested that HOMA-IR remained an independent risk factor for increased risk of NAFLD after adjusting for age, BMI, and sex in Model 1 (OR: 1.496, 95% CI = 1.394–1.606, P < 0.001). After FBG, TG, AST, and HDL-C were adjusted using Model 1, HOMA-IR was still an independent risk factor for increased risk of NAFLD (OR: 1.315, 95 % CI = 1.214–1.424, P < 0.001). Compared with in the Q1 group, the risk of NAFLD in the Q3 and Q4 groups was 3.027- and 5.057-fold higher, respectively (P < 0.001), as shown in Table 4.
Multivariate analysis of the risk of non-alcoholic fatty liver disease (NAFLD) in the overall population.

HOMA-IR, homeostasis model assessment of insulin resistance; OR, odds ratio; CI, confidence interval.
Non-obese participants showed the same trend as the overall population. In the multivariate logistic regression analysis, after adjusting for age, BMI, and sex in Model 1, HOMA-IR was an independent risk factor for increased risk of lean NAFLD (OR: 1.864, 95% CI = 1.609–2.159, P < 0.001). After FBG, TG, AST, and HDL-C were adjusted using Model 1, HOMA-IR remained an independent risk factor for increased risk of lean NAFLD (OR: 1.574, 95% CI = 1.332–1.859, P < 0.001). Compared with in the Q1 group, the risk of NAFLD in the Q3 and Q4 groups was 2.385- and 4.287-fold higher, respectively (P < 0.05), as shown in Table 5.
Multivariate analysis of the risk of lean non-alcoholic fatty liver disease (NAFLD) in the non-obese subgroup.
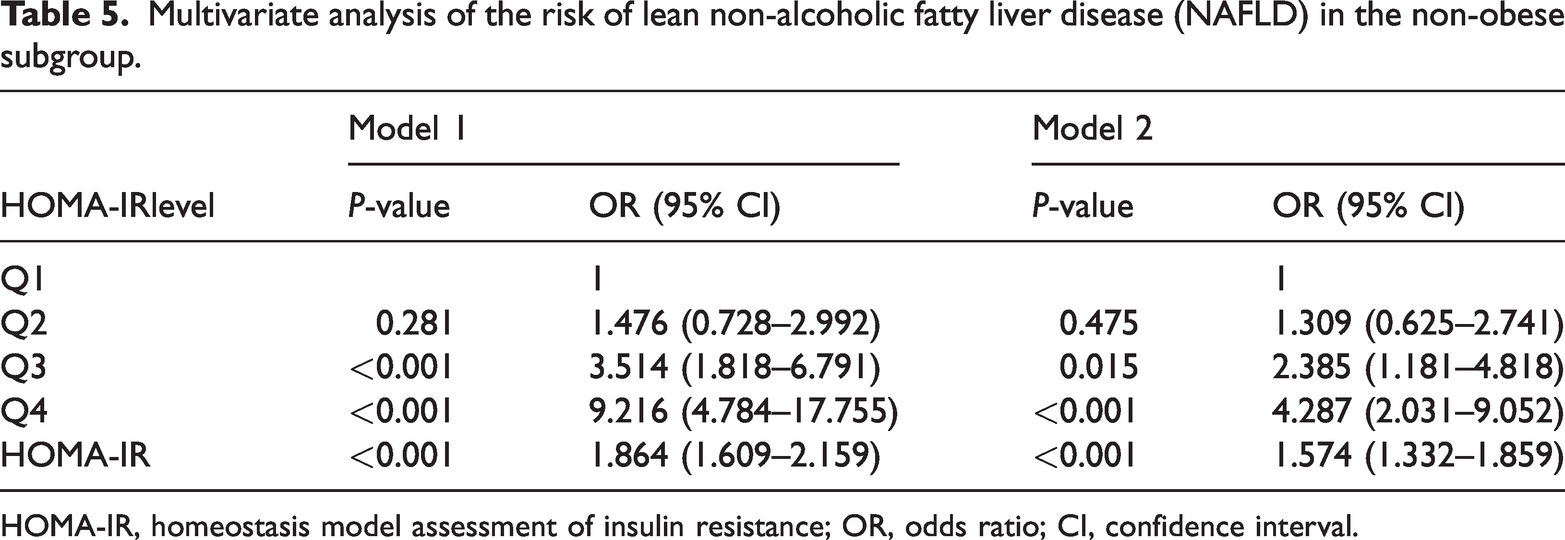
HOMA-IR, homeostasis model assessment of insulin resistance; OR, odds ratio; CI, confidence interval.
Role of HOMA-IR in diagnosing NAFLD in the non-diabetic and non-diabetic, non-obese populations
The diagnostic value of HOMA-IR for NAFLD in the non-diabetic and non-diabetic, non-obese populations was evaluated using the ROC curve. The area under the ROC curve (AUC) value of HOMA-IR for predicting NAFLD among the overall non-diabetic population was 0.792 (95% CI = 0.768–0.817), corresponding to the optimal cut-off value of 3.13. Its sensitivity was 73.4% and its specificity was 72.9%. The AUC value of HOMA-IR was 0.770 (95% CI = 0.723–0.818) for predicting lean NAFLD in non-diabetic patients, and the corresponding optimal cut-off was 2.77. Its sensitivity was 65.8% and its specificity was 75.8% (Table 6).
Area under the curve (AUC) values for homeostasis model assessment of insulin resistance (HOMA-IR) for non-alcoholic fatty liver disease (NAFLD).

CI, confidence interval.
Overall, HOMA-IR was significantly higher in the NAFLD group than in the non-NAFLD group. Multivariate logistic analysis showed that HOMA-IR was a strong and independent risk factor for NAFLD and lean NAFLD after correcting for confounding factors in the non-diabetic population.
Discussion
Traditionally, NAFLD is often associated with obesity. However, the prevalence of lean NAFLD ranges from 8% to 19% in Asia. 7 A meta-analysis found that lean participants with NAFLD were significantly less metabolically unhealthy compared with the obese and overweight participants with NAFLD. FBG levels were significantly lower in participants with lean NAFLD than in overweight and obese participants, 8 suggesting that it may not be reliable to assess NAFLD using FBG values. A study of past smokers found that elevated FBG levels showed a strong association with NAFLD risk regardless of weight gain. 9 Hong et al. found that FBG variability was positively associated with NAFLD incidence in the non-diabetic population. This correlation was also observed in individuals with a normal BMI, 10 suggesting that blood glucose variability may be an indicator of NAFLD risk. However, data acquisition is tedious and time-consuming for this.
HOMA-IR is calculated using FBG and fasting insulin levels and reflects the level of insulin resistance. Previous research has suggested that insulin resistance plays an important role in the development of NAFLD and related diseases, such as dementia.11,12 A prospective study of elderly women showed that participants with HOMA-IR > 2.6 had a 47% higher probability of cognitive dysfunction. 13 However, several previous studies have investigated the relationships between insulin resistance markers and NAFLD, but their results have not been fully consistent.14–17 The lack of corroboration may be related to several factors. First, some reports used liver enzyme levels or liver ultrasound to diagnose NAFLD, but liver enzymes are not a robust parameter for diagnosing NAFLD.16,18,19 In a study of living donor liver transplants, ultrasound could not detect steatosis when present in less than 10% of hepatocytes. 20 Ultrasound is often performed independently by a single physician, and diagnostic error may exist between physicians. Second, some studies included both diabetic and non-diabetic participants, with the use of anti-diabetic drugs affecting insulin secretion and therefore the results. 21 Finally, many past studies have had small sample sizes.
This study has several advantages. First, the CT results were reported by two experienced physicians, thus minimizing potential diagnostic error. Additionally, this study used HOMA-IR as a marker of insulin resistance. HOMA-IR is the most common method for detecting insulin resistance, with strong correlations observed with results using the gold standard hyperinsulinemic-euglycemic clamp test. 22 Both the European and Chinese NAFLD guidelines require the use of HOMA-IR as a surrogate for assessing insulin resistance in non-diabetic patients.23,24 However, the optimal cut-off for HOMA-IR-based diagnosis of NAFLD in a large non-diabetic population has yet to be determined in China. Another advantage is that this study excluded the diabetic population to avoid any effect of anti-diabetic drugs on insulin measurements. We also investigated a large sample size, with a total of 2234 participants included.
Among the overall non-diabetic population, a higher metabolic risk was found in the NAFLD group, such as having a higher BMI, hypertension, increased levels of FBG, UA, and TG, as well as lower HDL-C (all P < 0.001). The HOMA-IR value of the NAFLD group was significantly higher than that of the non-NAFLD group, with a greater prevalence of NALFD as HOMA-IR increased. This increased risk was more pronounced with higher levels of HOMA-IR (Q3 and Q4 groups) than with lower HOMA-IR (Q1 group). After adjusting for age, BMI, sex, FBG, TG, AST, and HDL-C, HOMA-IR remained an independent risk factor for NAFLD, suggesting that HOMA-IR is a reliable indicator of NAFLD risk in non-diabetic populations.
The metabolic risk of NAFLD cannot be fully established using BMI alone. Compared with obese non-NAFLD, lean NAFLD individuals had lower BMI, but higher HOMA-IR levels and increased levels of metabolic risk factors, such as TG, FBG, and TC. HOMA-IR was found to be an independent risk factor for lean NAFLD in both Models 1 and 2, indicating that HOMA-IR may be a good predictor of non-diabetic lean NAFLD.
Because of racial differences and wide ranging comorbidities, no uniform standards for the normal HOMA-IR range or diagnostic cut-off value for NAFLD in the population are available. 24 A Finnish study showed that a HOMA-IR value of 2.0 corresponds to normal liver fat content (< 5.56%). 25 An examination of 108 participants in Iran showed that the optimal HOMA-IR cut-off in NAFLD was 1.75 (sensitivity of 87.0% and specificity of 81.5%), 26 while a German study found that the median HOMA-IR in non-diabetic participants was 1.54 (1.13/2.19). 27
In this study, the AUC value of HOMA-IR for predicting NAFLD in the non-diabetic population was 0.792 (95% CI = 0.768–0.817), corresponding to an optimal cut-off value of 3.13, with a sensitivity of 73.4% and specificity of 72.9%. The optimal cut-off for non-diabetic lean NAFLD was 2.77 (sensitivity of 65.8% and specificity of 75.8%), suggesting that HOMA-IR can be used to establish clinical diagnosis. Work by Gutierrez et al. showed that the optimal cut-off for distinguishing NAFLD from non-NAFLD using HOMA-IR in T2DM was 4.5, 28 which was quite different from the cut-off found in the present study. This may be from the strong positive correlation between FBG and insulin concentration in non-diabetic individuals, which is disrupted once the insulin concentration begins to decline in the progression to diabetes. 25
Our study has a few limitations. Metabolic dysfunction-associated fatty liver disease (MAFLD) could not be diagnosed here because data involving abdominal circumference and high-sensitivity C-reactive protein (hs-CRP) were not collected, limiting further studies of the association of metabolic factors with fatty liver disease. Additionally, this was a single-center study. Follow-up work is needed to address these limitations.
Serum biomarkers are preferred for large-scale screening studies because of the high costs associated with the available imaging modalities. Here, we found HOMA-IR to be a non-invasive tool for diagnosing NAFLD in Chinese non-diabetic patients, with an optimal diagnostic cut-off value of 3.13 (sensitivity of 73.4% and specificity of 72.9%). The optimal cut-off for lean NAFLD in non-diabetic patients was 2.77 (sensitivity of 65.8% and specificity of 75.8%). Our results have important clinical implications. HOMA-IR may be the first choice for large-scale NAFLD screening studies and may be widely used in the identification and subsequent management of patients with NAFLD.
Footnotes
Acknowledgements
We thank our colleagues at the Guangzhou Cadre Health Management Center, especially to the scientific research management department.
Author contributions
PZ designed the study and drafted the manuscript. XY and PZ analyzed the data. SC was responsible for study conceptualization. LH and XC made substantial contributions to data acquisition. All authors approved the final version of the manuscript.
Data availability statement
The data that support the findings of this study are available upon request from the corresponding author. These data are not publicly available because of privacy or ethical restrictions.
Declaration of conflicting interest
The authors declare that there is no conflict of interest.
Funding
This work was supported by the Guangzhou Municipal Science and Technology Project (funding numbers 202102080649 and 202102080634).