
Abstract
Context:
Chemerin is one of the adipokines that regulate fat metabolism. High-sensitivity C-reactive protein (hs-CRP) may be considered as a cardiovascular risk predictor. Measuring intima-media thickness of the CCA (C-IMT) is a well-evidenced tool for the detection of early stages of atherosclerosis. We aimed here to study both serum chemerin and hs-CRP as markers of subclinical atherosclerosis in Egyptian patients with type 2 diabetes, who are angiographically free of coronary artery disease (CAD).
Subjects and methods:
This cross-sectional study was conducted on 180 subjects divided into two groups: Group A included 90 type 2 diabetic patients without CAD and group B including 90 nondiabetic control subjects. All study subjects were having normal coronary angiography. Serum chemerin, homeostasis model assessment for insulin resistance (HOMA-IR), glycated haemoglobin (HbA1c), lipid profile, hs-CRP as well as C-IMT were assessed in all study subjects.
Results:
There was a statistically significant difference between the 2 groups regarding serum chemerin level, HOMA-IR, hs-CRP and C-IMT; being higher in the diabetic patients than in the control group (p = 0.006, 0.024, 0.040 and <0.001, respectively). There was positive correlation between serum chemerin level and waist-to-hip ratio (WHR), HOMA-IR, hs-CRP and C-IMT. Carotid intima-media thickness was positively correlated with patients’ WHR, blood pressure, HbA1c, diabetes duration as well as hs-CRP, and negatively correlated with ankle-brachial index (ABI). Linear regression analysis showed that HbA1c, serum chemerin and hs-CRP were independently affecting C-IMT. Serum hs-CRP was positively correlated with HbA1c and HOMA-IR (p = 0.006 and 0.032, respectively), and negatively correlated with HDL-cholesterol level (p = 0.018).
Conclusion:
Both serum chemerin and hs-CRP could be considered as markers of subclinical atherosclerosis, and hence, may be utilized for the early detection of macrovascular disease, in Egyptian patients with type 2 diabetes.
Keywords
Introduction
Type 2 diabetes has a sixfold increased risk of macrovascular disease compared with that of nondiabetic subjects, making cardiovascular disease a common cause of morbidity and mortality in diabetic patients [Cho et al. 2008]. Atherosclerosis is considered as a central pathological mechanism in the development of macrovascular diabetic complications. It starts very early and progresses throughout life, with firm evidence suggesting that chronic inflammation may play a vital role in the development of atherosclerosis [de M. Bandeira et al. 2013].
Abdominal obesity is associated with low-grade inflammation, as the visceral adipose tissue acts as an endocrine organ secreting bioactive substances, collectively termed adipokines [Poulos et al. 2010]. Adipokines regulate adipose-tissue function, influence glucose metabolism and influence energy balance at the systemic level [Pardo et al. 2010]. Secretion of high adipokine levels in obese subjects contributes to the development of a chronic inflammation state that impairs normal adipose-tissue function [Baldasseroni et al. 2013]. Adipokines demonstrate different properties: some have pro-inflammatory activity and enhance insulin resistance and others have anti-inflammatory properties and an insulin-sensitizing effect [Kotnik et al. 2011]. Insulin resistance arises from two mechanisms: secretion of adipokines and excessive lipolysis and release of free fatty acids from adipose tissue [Nagle et al. 2009]. Data suggest that accumulation of fat in the abdominal area is the cause of reduced insulin sensitivity and impairment of the insulin-signalling pathway [Donath and Shoelson, 2011].
Chemerin, one of the adipokines, was found to enhance insulin signalling, to increase insulin-stimulated glucose transport, and to regulate insulin sensitivity in the adipose tissue. On the other hand, chemerin was identified for its role in inducing insulin resistance from studies on human skeletal muscles [Wang et al. 2013]. It has three types of receptors: chemokine-like receptor 1 (CMKLR1), serpentine chemokine (CC motif) receptor-like 2 (CCRL2), and G protein-coupled receptor 1 (GPR1). All of these receptors bind chemerin with high affinity, but the downstream functional consequences of ligand binding are quite different [Monnierm et al. 2012].
Chemerin has pro-inflammatory chemo-attractant properties through binding to its receptors. Also, it regulates adipogenesis and adipocyte metabolism so it may contribute to adipocyte expansion in obese individuals [Goralski et al. 2007; Park et al. 2008]. The chemerin level has been shown to increase in obese subjects and correlates with obesity markers, so its alteration may have a pathological relevance to adipose dysfunction-associated disorders like dyslipidaemia and insulin resistance [Yang et al. 2010]. That is why studying the relationship between chemerin and atherosclerosis, as well as insulin resistance, is increasingly an important research point to focus on [Goralski et al. 2007].
C-reactive protein (CRP), an acute phase reactant, is currently considered an independent risk factor for atherosclerosis and hypertension. The CRP level rises in patients with hypertension and this predicts the development of cardiovascular disease [Fernandes and Assreuy, 2008]. CRP has many functions as it marks antigens for phagocytosis, stimulates cytokine release from leukocytes, binds C1, leading to activation of the classical complement pathway and causing the release of the intracellular adhesion molecule-1 and vascular adhesion molecule-1 from endothelial cells, that are associated with the development of atherosclerosis and coronary heart disease [Pasceri et al. 2000]. Currently, CRP is not only considered a passive marker of inflammation but it affects the vascular system as well [Schachter, 2003]. It has been suggested that CRP is one of the novel risk factors of cardiovascular disease in diabetic patients [Hayden and Reaven, 2000; Pearson et al. 2003].
Carotid intima-media thickness (C-IMT) was reported to be an indicator of cardiovascular disease and also a useful marker to monitor in early stages of atherosclerosis. It correlates positively with the severity of coronary atherosclerosis. Being a noninvasive and easy procedure, measuring C-IMT has a widely accepted use as an early marker of atherosclerosis. In addition to its value in the diagnosis of peripheral artery disease (PAD), the ankle brachial index (ABI) can also be used to as a marker of atherosclerosis, with an inverse relationship between ABI and risk of cardiovascular disease [Touboul et al. 2007].
We aimed here to study both serum chemerin and high-sensitivity CRP (hs-CRP) as markers of subclinical atherosclerosis in Egyptian patients with type 2 diabetes who are angiographically free of coronary artery disease (CAD).
Subjects and methods
Our cross-sectional study was conducted on 180 male subjects, recruited from outpatient clinics and the Cardiology Department at Alexandria University, Egypt, who were divided into two groups: Group A included 90 type 2 diabetic patients without evidence of coronary artery disease (CAD) and group B included 90 healthy, nondiabetic control subjects. All study subjects were recruited from those undergoing coronary angiography for a justified indication (e.g. unexplained chest pain with normal noninvasive cardiac work up) at Alexandria University Cardiology Department, and proved to be angiographically free of CAD. Exclusion criteria included those with a history of acute coronary syndrome, unstable angina, myocardial infarction, history of recent infection within the last two months, or other endocrinal or metabolic diseases.
After giving their signed informed consent, all study participants were subjected to a full medical history assessment and complete physical examination, including measurement of body mass index (BMI), waist circumference (WC), waist-to-hip ratio (WHR) and ABI using handheld Doppler. Laboratory assessment included fasting serum glucose, serum insulin level, glycated haemoglobin (HbA1c), lipid profile and hs-CRP. Homeostasis Model Assessment 2 (HOMA2) calculator was used to estimate insulin resistance (HOMA2-IR) [HOMA Calculator, 2009]. Serum chemerin level was measured in fasting blood samples using the ELISA technique. Venous blood samples were collected from the antecubital vein into vacuum tubes. Sampling was done in the morning after an overnight fasting of 12 hours. The serum chemerin level was measured using the chemerin ELISA assays kit (BioVendor Laboratorni Medicina, Czech Republic). Human chemerin ELISA standard quality controls and samples were incubated in microtitration wells precoated with polyclonal antihuman chemerin antibody. After a 60-minute incubation followed by washing, biotin-labelled polyclonal antihuman chemerin antibody was added and incubated with the captured chemerin for 60 minutes. After another washing, streptavidin-HRP conjugate was added. After 30 minutes incubation and the last washing step, the remaining conjugate was allowed to react with the substrate solution, then the reaction was stopped by addition of an acidic solution (H2SO4) and absorbance of the resulting yellow product was measured spectrophotometrically at 450 nm. The absorbance was proportional to the concentration of chemerin. A standard curve was constructed by plotting absorbance values versus chemerin concentrations of standards, and concentrations of unknown samples were determined using this standard curve. [Bozaoglu et al. 2007].
Carotid artery ultrasound was performed for all study subjects to measure the C-IMT. Ultrasonographic scanning of the carotid arteries was performed using Philips ClearVue 350 (PHILIPS, USA) at a transducer frequency of 7–12 MHz. Extracranial carotid arteries in the neck were scanned bilaterally in the longitudinal and transverse planes that provided images of the common carotid artery (CCA), the carotid bulb, and parts of the internal and external carotid arteries. Experienced ultrasonographers performed scanning. C-IMT was defined as the distance from the leading edge of the first echogenic line to the leading edge of the second echogenic line on the scans, with the first line representing the lumen–intimal interface and the second line representing the collagen-containing upper layer of the adventitia. The site with the greatest thickness in the longitudinal plane was detected along the vessel from the CCA to the internal carotid artery bilaterally [Magnussen et al. 2012]. Based on the recommendations of the American Society of Echocardiography Carotid Intima-Media Thickness Task Force, the best images of the distal 1 cm of CCA far wall from each of three angles have been selected as complementary angles that better represent overall wall thickness. Triplicate measurement of C-IMT was performed to ensure consistency and accuracy, and then the mean C-IMT values from far walls of right and left CCAs (mean–mean) were calculated [Stein et al. 2008].
Statistical analyses of the data
Data were fed to the computer and analysed using IBM SPSS software package version 20.0. Qualitative data were described using number and percent. Quantitative data were described using minimum and maximum, mean and standard deviation, and median. Comparison between different groups regarding categorical variables was tested using the Chi-square test. The distributions of quantitative variables were tested for normality using the Kolmogorov–Smirnov test, the Shapiro–Wilk test and the D’Agostino test, and a histogram and QQ plot were used for vision tests. If it revealed normal data distribution, parametric tests were applied. If the data were abnormally distributed, nonparametric tests were used. For normally distributed data, comparison between two independent populations was done using the independent t-test. Correlations between two quantitative variables were assessed using the Pearson coefficient. Multivariate linear regression was assessed. Significance of the obtained results was judged at the 5% level.
Results
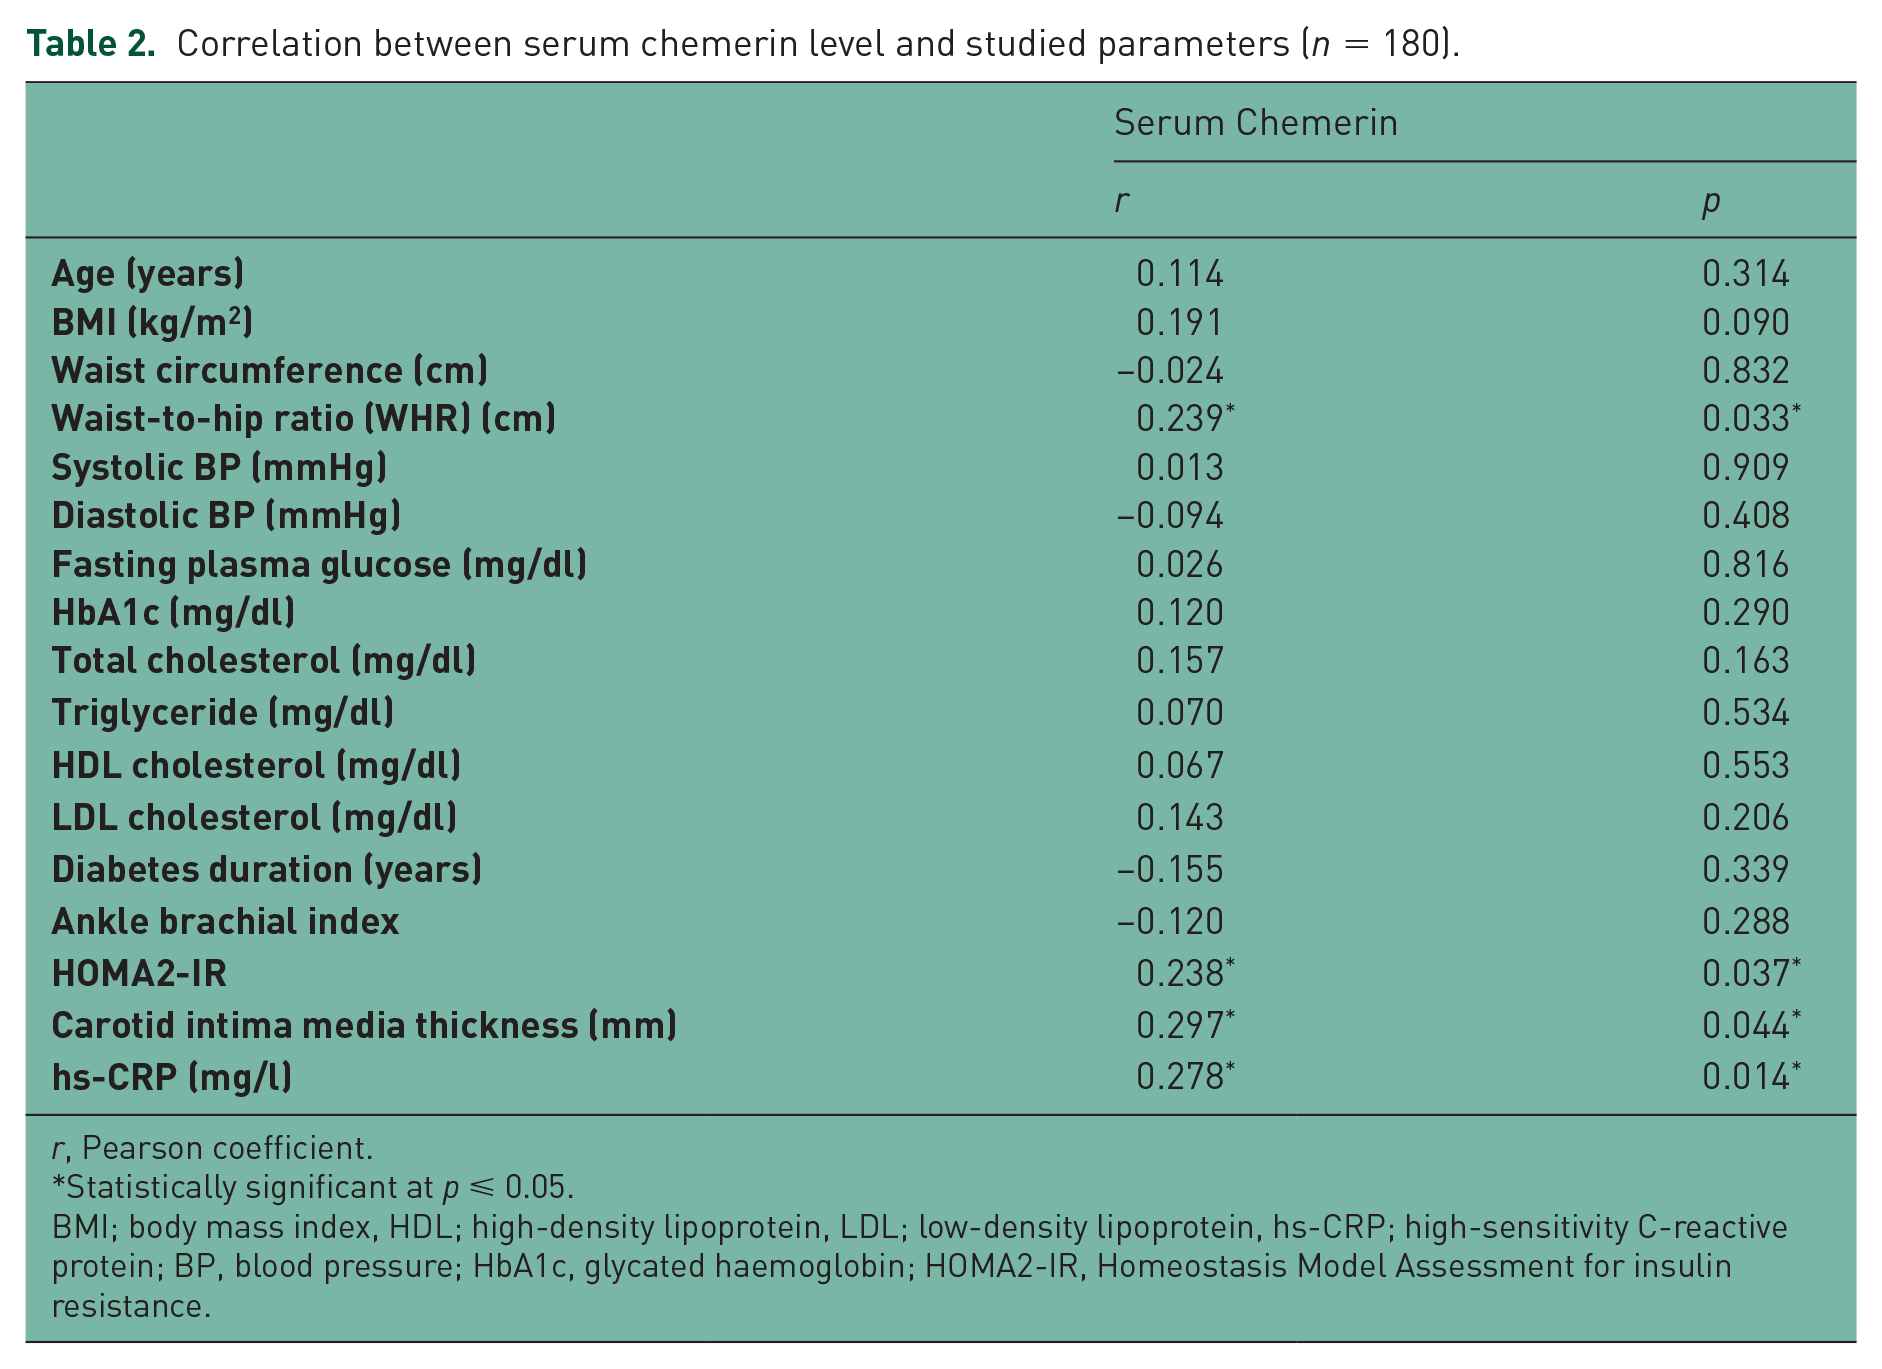
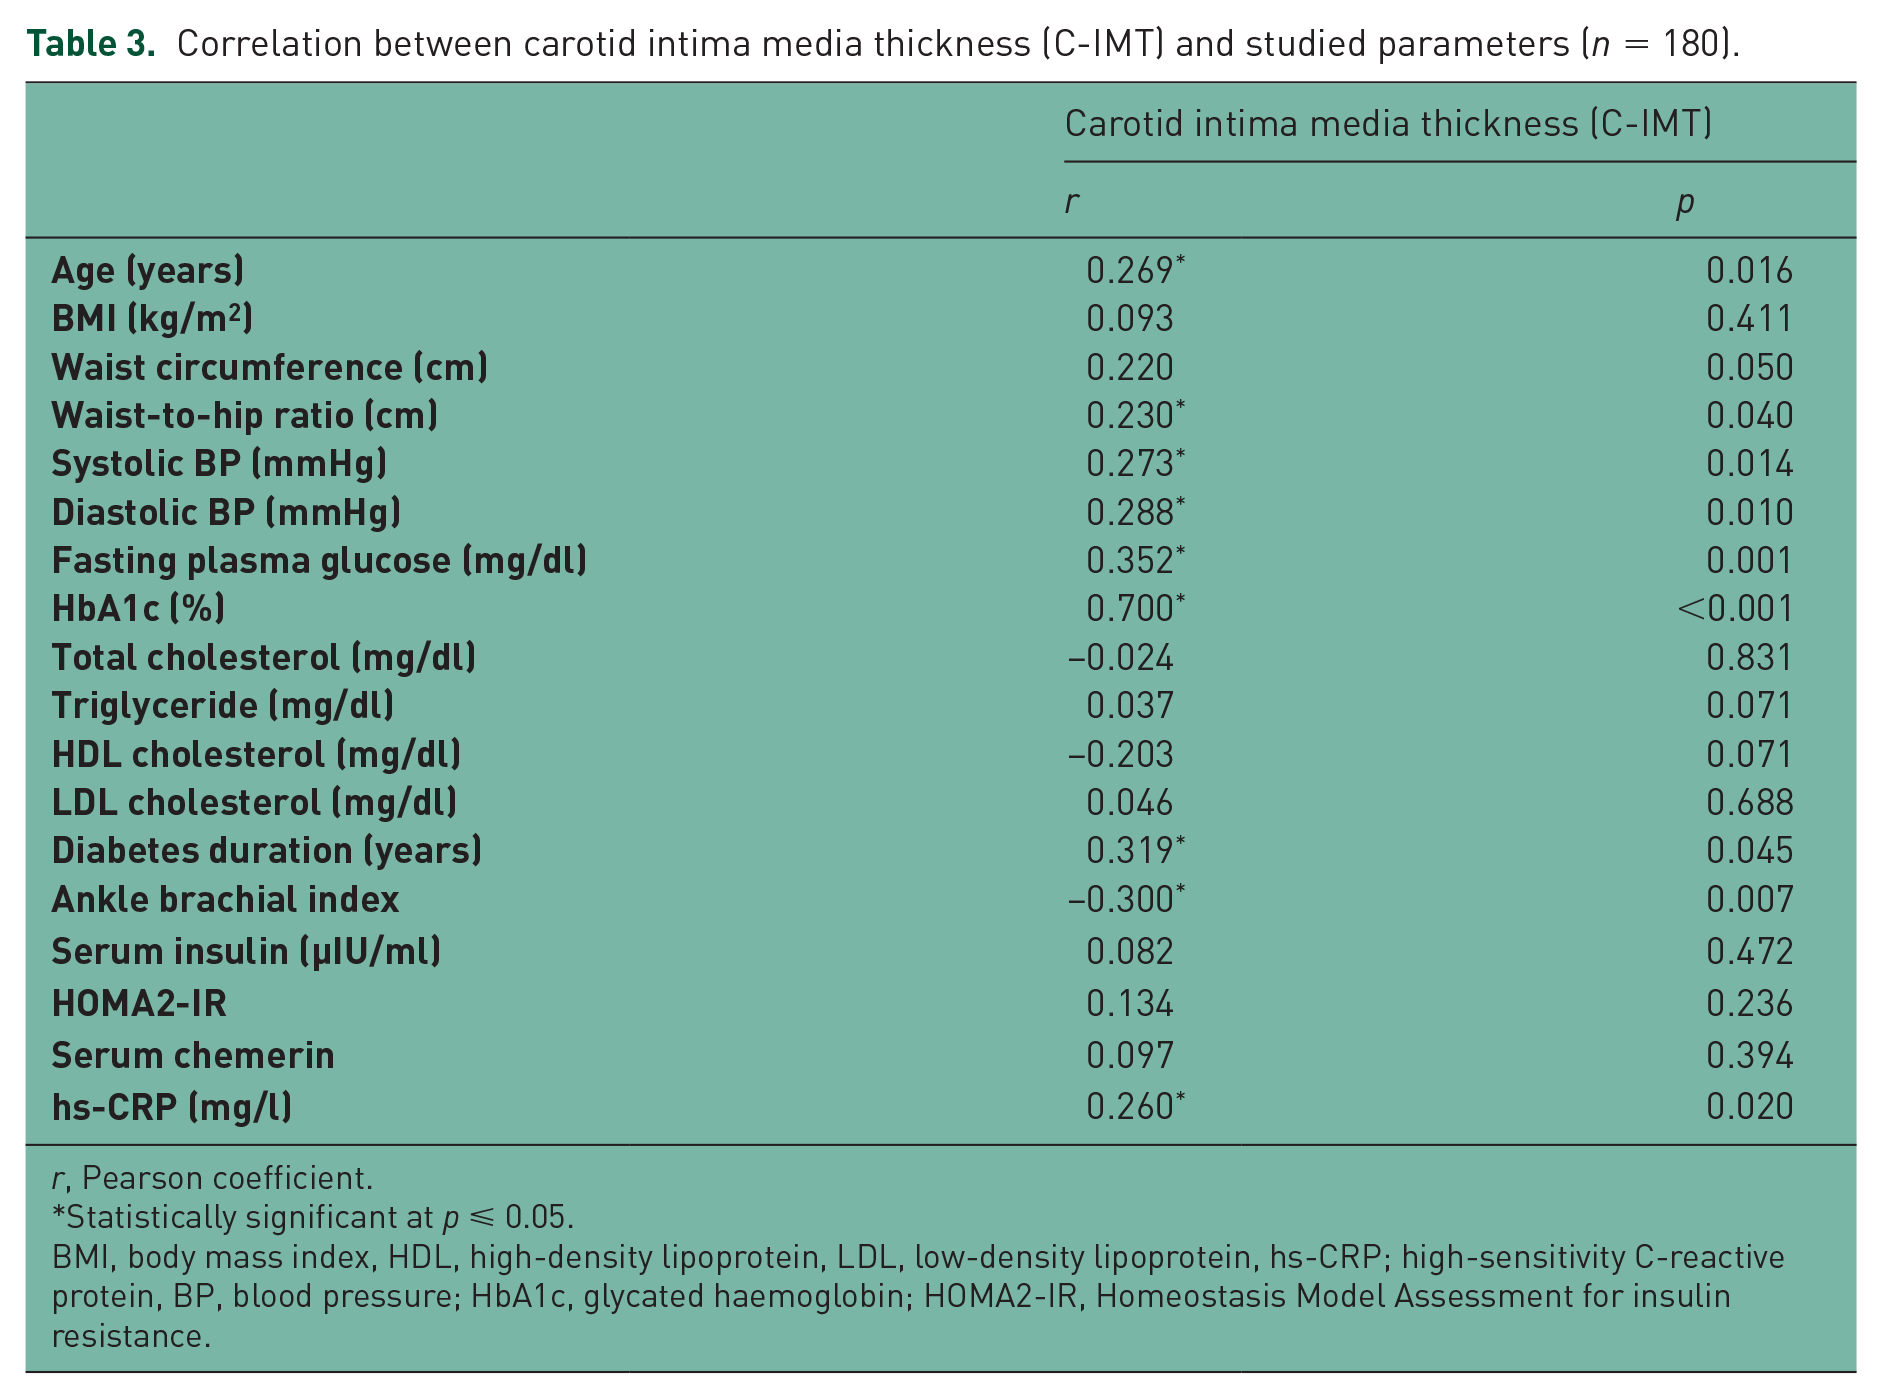
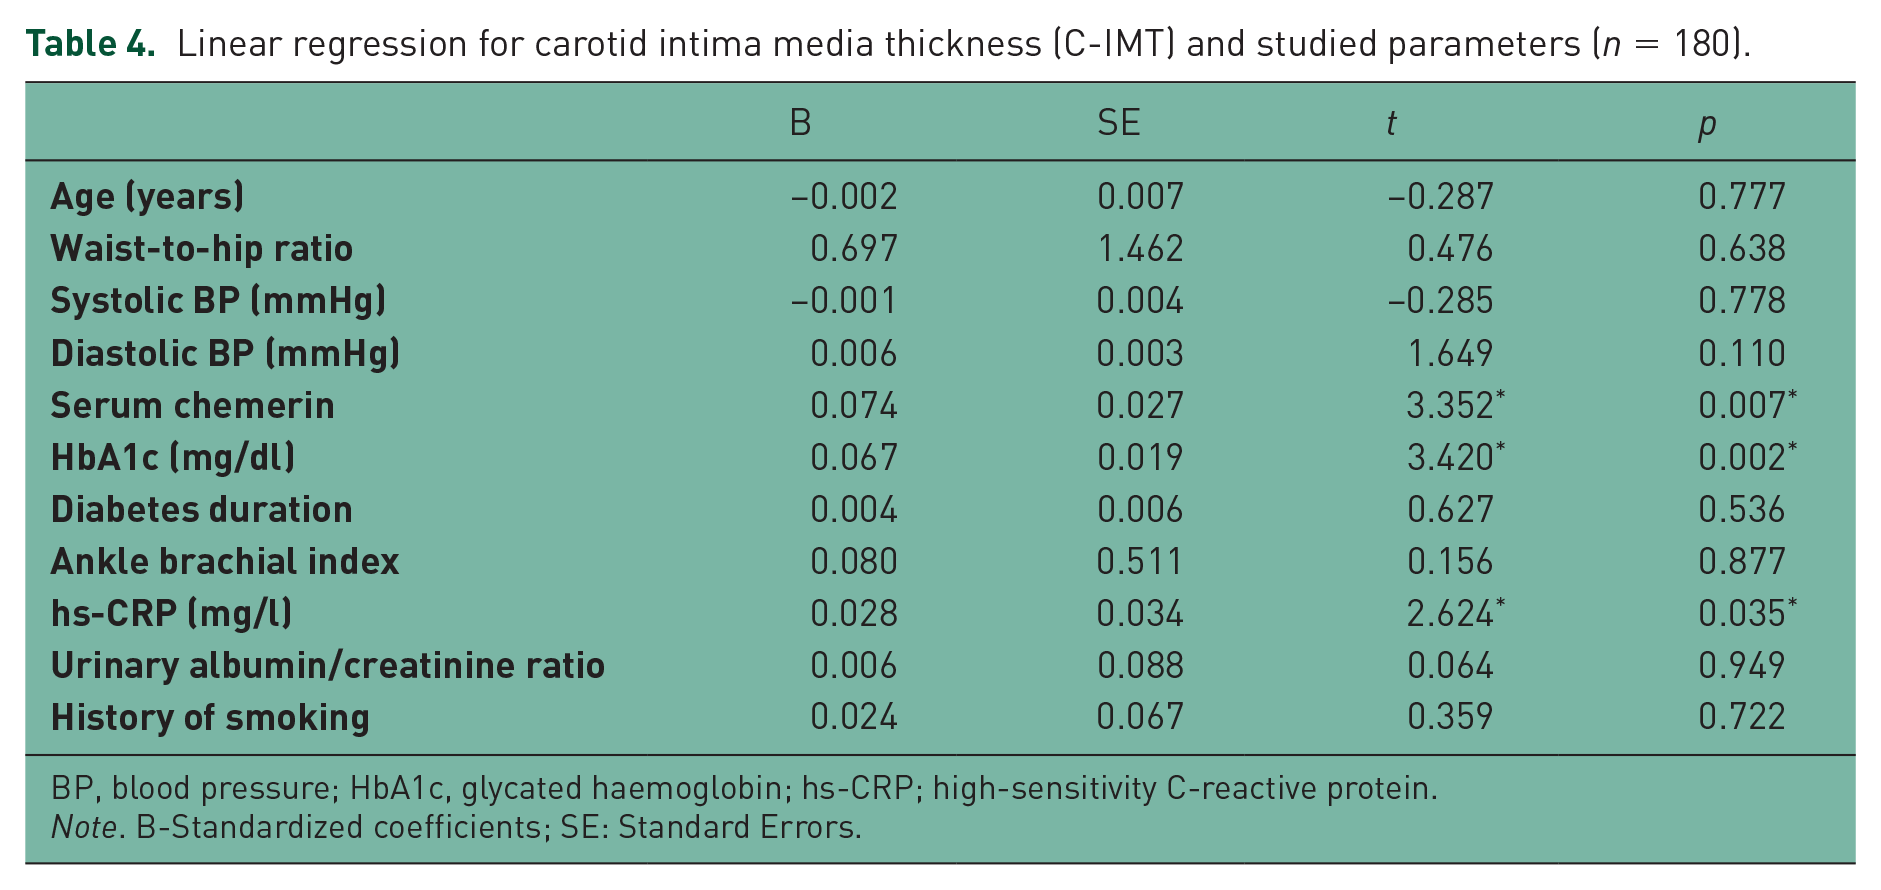
There was a statistically significant difference between the two groups regarding serum chemerin level, HOMA-IR, hs-CRP and C-IMT; all were higher in the diabetic patients than in the control group (p = 0.006, 0.024, 0.040 and 0.000, respectively) (Table 1). There was a significant positive correlation of serum chemerin level with WHR, HOMA-IR, hs-CRP and C-IMT in both diabetic and nondiabetic groups, as well as the whole study population (Table 2). C-IMT was positively correlated with patients’ WHR, blood pressure, HbA1c, diabetes duration, as well as hs-CRP, and negatively correlated with ABI (Table 3). In both study groups and in the whole study cohort (n =180), linear regression analysis showed that HbA1c, serum chemerin and hs-CRP were independently affecting the C-IMT (Table 4). Serum hs-CRP was positively correlated with HbA1c and HOMA-IR (p = 0.006 and 0.032, respectively), and negatively correlated with the HDL-cholesterol level (p = 0.018) (Table 5).
Descriptive data of the studied subjects (n = 180).

Data are expressed as the mean ± standard deviation, p values were calculated by t-test.
Statistically significant at p ⩽ 0.05.
BMI, body mass index; BP, blood pressure; FPG, fasting plasma glucose; HbA1c, glycated haemoglobin; HDL, high-density lipoprotein; LDL, low-density lipoprotein; hs-CRP, high-sensitivity C-reactive protein.
Correlation between serum chemerin level and studied parameters (n = 180).
r, Pearson coefficient.
Statistically significant at p ⩽ 0.05.
BMI; body mass index, HDL; high-density lipoprotein, LDL; low-density lipoprotein, hs-CRP; high-sensitivity C-reactive protein; BP, blood pressure; HbA1c, glycated haemoglobin; HOMA2-IR, Homeostasis Model Assessment for insulin resistance.
Correlation between carotid intima media thickness (C-IMT) and studied parameters (n = 180).
r, Pearson coefficient.
Statistically significant at p ⩽ 0.05.
BMI, body mass index, HDL, high-density lipoprotein, LDL, low-density lipoprotein, hs-CRP; high-sensitivity C-reactive protein, BP, blood pressure; HbA1c, glycated haemoglobin; HOMA2-IR, Homeostasis Model Assessment for insulin resistance.
Linear regression for carotid intima media thickness (C-IMT) and studied parameters (n = 180).
BP, blood pressure; HbA1c, glycated haemoglobin; hs-CRP; high-sensitivity C-reactive protein.
Note. B-Standardized coefficients; SE: Standard Errors.
Correlation between high-sensitivity C-reactive protein and studied parameters (n = 180).

r, Pearson coefficient.
Statistically significant at p ⩽ 0.05.
BMI; body mass index, BP, blood pressure; HDL; high-density lipoproteins, LDL; low-density lipoproteins, hs-CRP; high-sensitivity C-reactive protein; HbA1c, glycated haemoglobin; HOMA2-IR, Homeostasis Model Assessment for insulin resistance.
Discussion
Adipose tissue is considered an active endocrinal organ secreting bioactive substances called adipokines [Yan et al. 2012]. Dysregulation of these pro-inflammatory and anti-inflammatory substances in obesity may serve as a link between obesity, insulin resistance and cardiovascular disease (CVD) [Roh et al. 2007]. Chemerin is a one of the adipokines that regulates fat formation and metabolism and affects the metabolism of fat-cell differentiation and adipose-tissue inflammatory response through the paracrine and autocrine systems [Wang et al. 2013].
In the present study, there was a statistically significant difference between the two groups regarding serum chemerin level; being higher in type 2 diabetic patients, compared with the control subjects. These results are in concordance with the findings reported by other studies such as those by Ali and Al Hadidi, El-Mesallamy and colleagues, and Hu and Feng, who demonstrated that serum chemerin levels were significantly increased in patients with type 2 diabetes compared with nondiabetic individuals [Ali and Al Hadidi, 2013; El-Mesallamy et al. 2011; Hu and Feng, 2011].
We found that serum chemerin was significantly positively correlated with WHR that may reflect the association of visceral obesity with a higher level of chemerin secretion. The data published by Fatima and colleagues were in agreement with our results regarding the presence of significant positive correlation between serum chemerin level and WHR [Fatima et al. 2013]. In our work, there was a positive correlation between chemerin and C-IMT. In contrast, Yoo and colleagues demonstrated that chemerin was not correlated to C-IMT, although positively correlated with arterial stiffness represented by brachial artery pulse-wave velocity (PWV) in the same study [Yoo et al. 2012]. In agreement with our results, Ali and Al Hadidi found a significant positive correlation between serum chemerin levels and each of CRP and C-IMT [Ali and Al Hadidi, 2013].
In a recent study, Leiherer and colleagues analysed plasma chemerin levels and estimated glomerular filtration rate (eGFR) in 495 patients undergoing coronary angiography for the evaluation of established or suspected stable CAD. Chemerin levels were higher in patients with type 2 diabetes mellitus and metabolic syndrome than in subjects without these disorders, but did not differ significantly between patients with significant CAD and those without coronary disease. The investigators also reported that chemerin was significantly and independently associated with eGFR, after adjusting for other variables [Leiherer et al. 2015].
We did observe an association between serum chemerin and hs-CRP levels that is consistent with the findings of other studies [Weigert et al. 2010; Lehrke et al. 2009; Bozaoglu et al. 2009]. Dong and colleagues showed that serum chemerin was positively correlated with CRP and that it may also be associated with the development of CAD [Dong et al. 2011]. Previous studies have also suggested that elevated serum chemerin levels could be strongly related to inflammatory markers such as hs-CRP [Weigert et al. 2010; Lehrke et al. 2009].
In the present study, C-IMT was significantly higher type 2 diabetic patients, compared with the control group. Yamasaki and colleagues have also reported that C-IMT in type 2 diabetic patients was higher than that in nondiabetic individuals [Yamasaki et al. 1995]. We established a positive correlation between C-IMT and each of plasma glucose level and HbA1c, with or without diabetes duration. Other studies showed similar results. One suggested that hyperglycaemia and dyslipidaemia cause an increase of C-IMT in early phases of diabetes [Temelkova-Kurktschiev et al. 1999]. However, our results were in disagreement with that of Pannacciulli and colleagues, who did not find a relationship between the duration of diabetes and C-IMT [Pannacciulli et al. 2003]. Nevertheless, many factors are identified as playing a role in the development of atherosclerosis in diabetic patients, including genetic predisposition and environmental influences.
Our results showed that age was positively correlated with C-IMT that is consistent with previous studies reporting an association between C-IMT and age in both sexes [Sinning et al. 2011; Tan et al. 2009]. Furthermore, Abd El-Hafez and colleagues demonstrated that age was the most significant predictor of C-IMT, as aging induces arterial-wall changes including progressive increase in intimal thickness [Abd El-Hafez et al. 2014].
Previous cross-sectional studies demonstrated a positive relationship between increasing levels of HbA1c and C-IMT [Gersteinm et al. 2003; Vitelli et al. 1997]. Even slightly elevated levels of HbA1c were strongly related to the prevalence of carotid plaques in nondiabetic individuals as reported in the Tromsø study [Jorgensen et al. 2004]. Our results reinforce these findings, as HbA1c was independently correlated with C-IMT in a linear regression analysis model. Interestingly, few studies have demonstrated a positive association between HbA1c and cardiovascular risk in nondiabetic subjects [Khaw et al. 2004; Selvin et al. 2004]. In our study, C-IMT was negatively correlated with ABI. This is in concordance with Price and colleagues, who concluded that the combination of the two measurements, C-IMT and ABI, could have an additive effect for predicting cardiovascular events [Price et al. 2007].
In the present study hs-CRP was statistically significantly higher in the diabetic patients than in the control group. These findings were in agreement with the results of an earlier study undertaken by Thejaswini and colleagues, who described a higher hs-CRP in type 2 diabetic patients [Thejaswini et al. 2013]. Since hs-CRP is considered to be a sensitive marker of inflammation, a raised hs-CRP level in type 2 diabetic patients may suggest that inflammation could be involved in the pathogenesis of diabetes and early atherosclerotic processes. We observed a positive correlation between C-IMT and hs-CRP, which is in concordance with Toprak and colleagues, who found that any increase of hs-CRP was associated with C-IMT progression independent of other cardiovascular risk factors [Toprak et al. 2011]. The INVADE study looked at the association between hs-CRP and C-IMT progression in elderly patients and found an independent association between the two parameters [Sander et al. 2007]. On the other hand, and in disagreement with our results, the Rotterdam study [Elias-Smale et al. 2007], Carotid Atherosclerosis Progression Study [Lorenz et al. 2007] and the study by Sinning and colleagues [Sinning et al. 2011] reported no relationship between hs-CRP and C-IMT.
There were certain limitations in our study, including its relatively small sample size, being a single-centre-based study and, because of its cross-sectional nature, it demonstrated an ‘association’, rather than a ‘causality’ relationship. Therefore, we are currently planning to start a prospective multicentre study to look more in depth into the possible role of serum chemerin levels in the development and progress of atherosclerosis in patients with type 2 diabetes.
Conclusion
Both serum chemerin and hs-CRP could be considered as markers of subclinical atherosclerosis, and hence, may be utilized for the early detection of macrovascular disease, in Egyptian patients with type 2 diabetes.
Footnotes
Funding
The author(s) received no financial support for the research, authorship, and/or publication of this article.
Conflict of interest statement
The author(s) declared no potential conflicts of interest with respect to the research, authorship, and/or publication of this article.