
Abstract
Background:
We sought to predict occurrence of myocardial infarction (MI) by means of a classification and regression tree (CART) model by conventional risk factors in middle-aged versus elderly (age ⩾65years) diabetic and nondiabetic patients from the Modares Heart Study.
Method:
A total of 469 patients were randomly selected and categorized into two groups according to clinical diabetes status. Group I consisted of 238 diabetic patients and group II consisted of 231 nondiabetic patients. Our population was MI positive. The outcome investigated was diabetes mellitus. We used a decision–analytic model to predict the diagnosis of patients with suspected MI.
Results:
We constructed 4 predictive patterns using 12 input variables and 1 output variable in terms of their sensitivity, specificity and risk. The differences among patterns were due to inclusion of predictor variables. The CART model suggested different variables of hypertension, mean cell volume, fasting blood sugar, cholesterol, triglyceride and uric acid concentration based on middle-aged and elderly patients at high risk for MI. Levels of biochemical measurements identified as best risk cutoff points. In evaluating the precision of different patterns, sensitivity and specificity were 47.9–84.0% and 56.3–93.0%, respectively.
Conclusions:
The CART model is capable of symbolizing interpretable clinical data for confirming and better prediction of MI occurrence in clinic or in hospital. Therefore, predictor variables in pattern could affect the outcome based on age group variable. Hyperglycemia, hypertension, hyperlipidemia and hyperuricemia were serious predictors for occurrence of MI in diabetics.
Keywords
Introduction
Myocardial infarction (MI) is the most common cause of mortality in diabetics [Jacoby et al. 1992, and multiple studies have revealed that diabetic patients are twice as likely to die from MI than nondiabetic patients [Jacoby et al. 1992; Donahoe et al. 2007]. The risk of a first cardiovascular occurrence in patients with diabetes is as high as in nondiabetic patients who have already had a cardiovascular occurrence [Haffner et al. 1998]. The burden of conventional risk factors in the presence of diabetes is greater in women than in men. The stronger effect of diabetes on the risk of coronary heart disease (CHD) in women compared with men is in part explained by a heavier risk factor burden and a greater effect of hypertension and atherogenic dyslipidemia in diabetic women [Juttilainen et al. 2004; Mahmoodi et al. 2007a].
Currently, researchers are interested in determining and discovering unidentified patterns and relationships between different variables in creation of predictive models by applying data mining methods [Bellazzi and Zupan, 2008; Chang et al. 2011]. These methods are prediction-based decision systems developed to diagnose and manage chronic diseases such as cardiovascular diseases [Huanga et al. 2007]. Researchers have suggested that the decision tree model had the best classification accuracy among data mining methods and certain advantages compared with other data mining systems used to identify and reduce the incidence of a disease or an event [Tsien et al. 1998; Meng et al. 2013].
Practically no information is available on the role of different cardiovascular risk factors in predicting MI based on the decision tree model in middle-aged and elderly subjects with and without diabetes. Therefore, the aim of the present study was to predict the probability of occurrence of MI using the decision tree model by conventional risk factors in middle-aged versus elderly (age ⩾65years) diabetic and nondiabetic patients. We assessed and compared their atherogenic risk profile and examined to what extent conventional risk factors can predict the first acute MI in middle-aged and elderly diabetic and nondiabetic patients.
Patients and methods
Study design and patient selection
The Modares Heart Study is a retrospective hospital-based medical record that has monitored CHD risk factors among men and women hospitalized for first acute MI since April 1994. The baseline protocol has been previously described in detail [Mahmoodi et al. 2007b]. The study was approved by the research ethics committee of the hospital and written approval for access to records was obtained. A total of 469 cases were randomly selected and matched. The studied sample with definite MI were admitted to the emergency department and hospitalized. MI was defined as International Classification of Diseases, Ninth Revision (ICD-9) code 410 and by the World Health Organization’s (WHO) clinical criteria, which include clinical presentation, myocardial enzyme elevation and electrocardiogram (ECG) changes.
Data collection
Data were collected at the time of admission and during the hospitalization period through direct interviews with patients and medical records through a confidential, detailed questionnaire. Blood samples were obtained from patients after admission and analyzed in the hospital laboratory. According to the collected medical information, hematological parameters were the components of the complete blood count which are routinely checked in many hospitals and were defined according to WHO criteria.
Conventional risk factor definitions
As previously described [Mahmoodi et al. 2007b], all measurements were performed according to a standard protocol conforming to international standards for definitions and measurements. Smoking habit was ascertained through a questionnaire as ‘current smoker’ and ‘never smoked’. Hypertension was defined as a history of hypertension in the past or a blood pressure ⩾140/90 mm Hg with or without antihypertensive medication at the time of admission. Hyperlipidemia was defined as documented history with or without the use of antilipidemic drugs or having cholesterol levels >200 mg/dl or a triglyceride level >150 mg/dl or both. Diabetes mellitus was defined as fasting blood glucose levels >126 mg/dl or a history of diabetes in the past or present, with or without medication at the time of admission. Family history was defined as MI history in one parent or both.
Statistical analysis
Our population had experienced first MI (MI positive). The outcome investigated was diabetes mellitus. In general, all patients in the Modares Heart Study were divided into four age groups (⩽50, 51–64, 65–74 and ⩾75 years old). In the current study, however, comparison was between middle-aged versus elderly (age ⩾65years) diabetic and nondiabetic patients. Therefore, analysis was based on middle-aged versus elderly groups. At first, all patients were categorized into two groups according to clinical diabetes status. A total of 243 diabetic patients with MI and a total of 243 nondiabetic patients with MI were initially selected. But when we included fasting blood sugar (FBS) as a predictor variable in models in order to gain better results, the numbers of diabetic and nondiabetic patients were modified to 238 and 231 patients, respectively. Major risk factors for MI as predictors or independent variables defined were hypertension, hyperlipidemia, smoking, family history for premature CHD, FBS, total cholesterol, serum triglyceride, serum uric acid, hemoglobin, hematocrit, mean cell volume (MCV) and mean cell hemoglobin (MCH).
A decision–analytic model using a classification tree algorithm can predict the diagnosis of patients with suspected MI. A decision tree involves successive binary partitioning to classify patients into some groups (known as nodes) with maximum homogeneity within and maximum heterogeneity between nodes. At the first step, all patients are in a single node. To begin, the Gini index was calculated for every possible cutoff for all independent variables to find the variable/cutoff that best separates the patients. We used the Gini coefficient because it is the most widely used criterion for measuring heterogeneity. The Gini coefficient takes a value of zero when all observations at a node belong to one level of a dependent variable. It takes its maximum amount (0.5) when observations are equally distributed in various levels of a dependent variable. The Gini coefficient is calculated for all levels of all variables. Thus, the best split on a variable will be the one that minimizes the Gini coefficient. Once the initial node (known as the parent) is divided into two groups (known as child nodes), the process proceeded in the same way to each of two subgroups. This can lead into an overfitted tree with lots of terminal nodes each contains only one subject (known as terminal nodes). Therefore, to avoid the overfitting, some stopping rules or pruning procedures are required. Pruning should thus result in a final tree with the lowest complexity and misclassification error. Termination criteria include user-defined limits (the minimum number of parent and child nodes) or pure terminal nodes (i.e. when all observations belong to the same level of a dependent variable) [Bradford et al. 1998]. In all of nodes of decision trees, diabetes mellitus was the outcome and presented as diabetics = 1 and nondiabetics = 0 as two comparable groups.
Finally, the validity of the models was described with sensitivity, specificity and risk. CART (classification and regression tree) version 6.0 and SPSS version 16.0 software were used to analyze the data.
Results
The study consisted of 243 diabetic and 243 nondiabetic patients with a mean age of 61.5 ± 11.7 and 58.8 ± 13.0 years old, respectively. The mean total cholesterol was 204.0 ± 58.1 and 192.4 ± 45.6 for the diabetic and nondiabetic patients, respectively. The means of serum triglyceride concentration were 156.6 ± 92.2 and 138.8 ± 70.3, respectively, and the means of serum uric acid concentration were 6.4 ± 2.1 and 6.0 ± 2.0, respectively.
The 11 predictor variables along with FBS were evaluated. Five patterns were analyzed using the CART method (two patterns corresponded to each other). Differences between patterns were due to inclusion of predictor variables with and without FBS in the model (Table 1).
The results of four the classification and regression tree models in diabetic and non-diabetic patients with MI for predicting of the risk of MI.

In the first pattern, all of the predictor variables without FBS were included in the model. The CART model identified three variables: hypertension, MCV and cholesterol concentration (Figure 1). In the first step, based on the main purpose of study, diabetic and nondiabetic patients divided in 274 (58.4%) and 195 (41.6%) middle-aged and elderly patients, respectively. About 65% of hypertensive elderly patients were at high risk for MI, but about 42% of elderly patients without hypertension experienced MI. However, the CART method identified an MCV level of 86.4 fl as the risk cutoff point in middle-aged patients. About 66% of middle-aged diabetic patients with an MCV level ⩽86.4 fl were at high risk for MI. In other words, middle-aged diabetic patients with an MCV level >86.4 fl and a cholesterol concentration >190 mg/dl were at higher risk of MI compared with middle-aged diabetic patients with a cholesterol concentration of ⩽190 mg/dl (47.5% versus 29.4%).
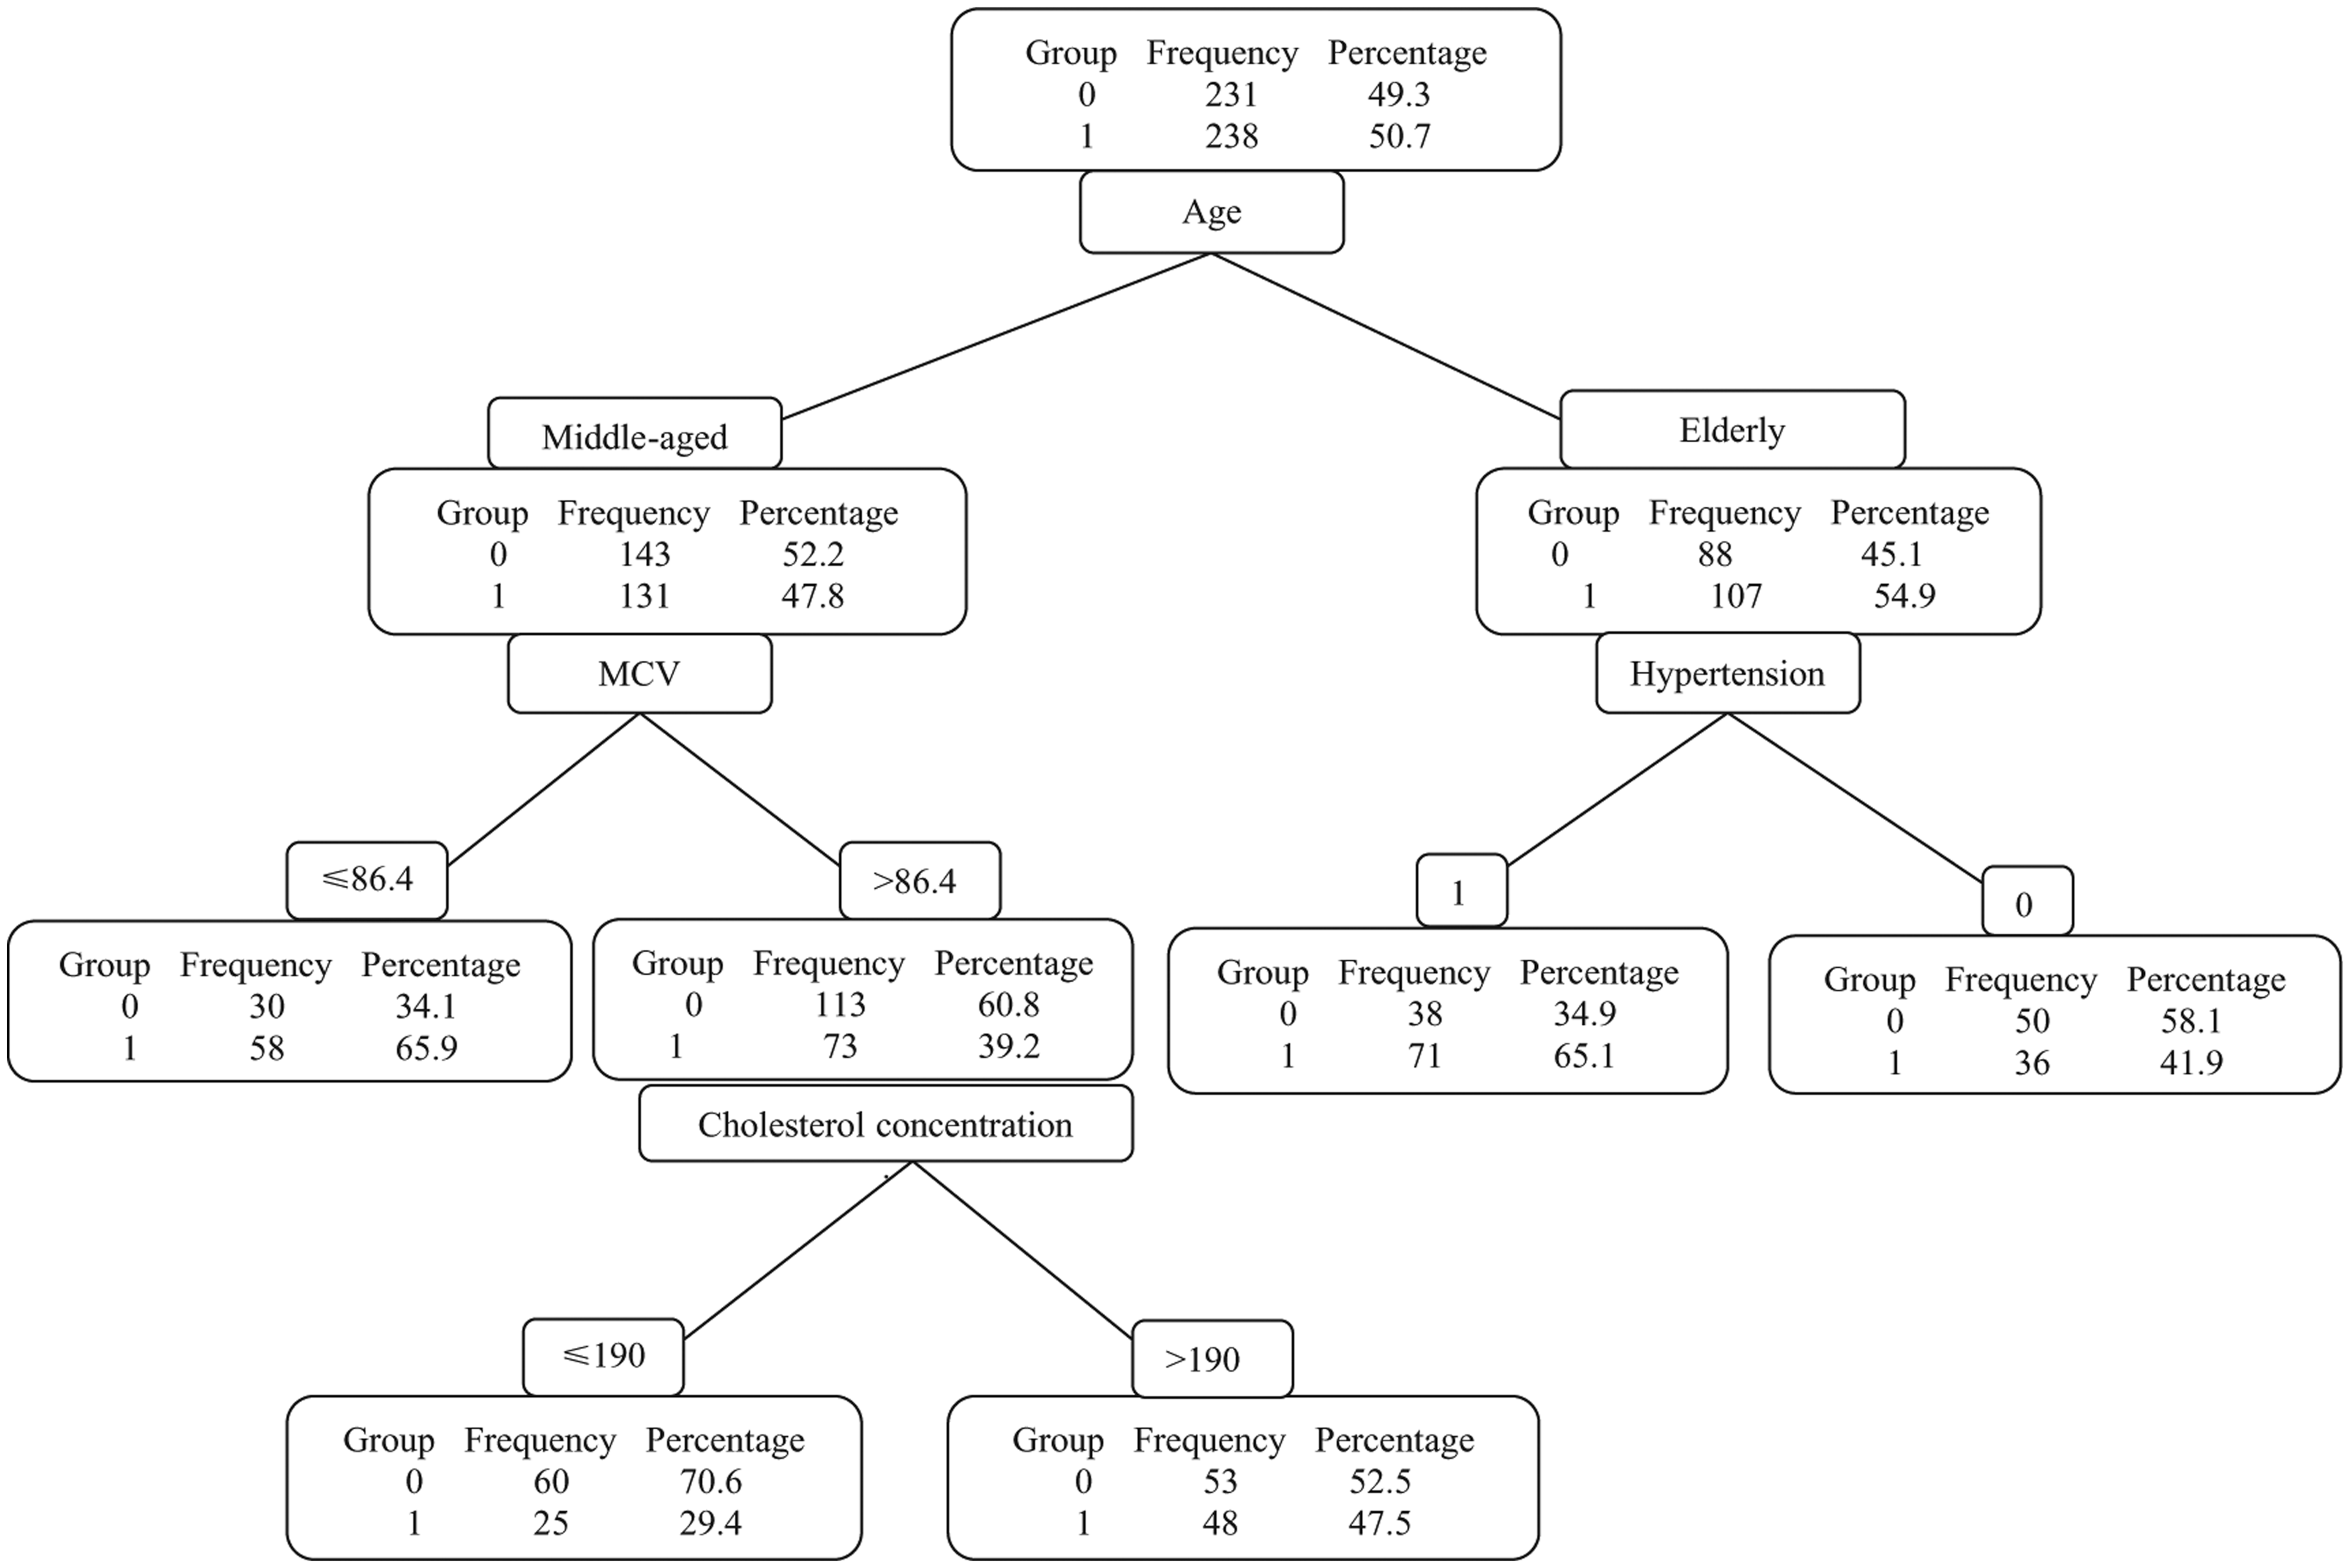
Classification and regression tree (CART) model applied to diabetic and nondiabetic patients with myocardial infarction (MI). In all of nodes of the decision trees, diabetes mellitus is presented as diabetics = 1 and nondiabetics = 0 as two comparable groups. The CART model suggested three variables: hypertension, mean cell volume (MCV) and cholesterol concentration. About 65% of hypertensive elderly patients were at high risk for MI. About 42% of nonhypertensive elderly patients experienced MI. The CART model identified an MCV level of 86.4 fl as the cutoff. About 66% of middle-aged patients with an MCV level ⩽86.4 fl were at high risk of MI. About 48% of middle-aged patients with an MCV level >86.4 fl and cholesterol concentration >190 mg/dl were at high risk of MI.
In the second pattern, all of the predictor variables along with FBS were included in the model. The CART method identified an FBS level >134 mg/dl and >136 mg/dl as the best single risk cutoff points for middle-aged and elderly patients at high risk for MI, respectively (Figure 2).

Classification and regression tree (CART) model applied to diabetic and nondiabetic patients with myocardial infarction (MI). In all nodes of the decision trees, diabetes mellitus is presented as diabetics = 1 and nondiabetics = 0 as two comparable groups. All of the predictor variables along with fasting blood sugar (FBS) were included in the model. The CART model identified an FBS level >134 mg/dl and >136 mg/dl as the best single cutoff for middle-aged and elderly diabetics at high risk for MI, respectively.
In the third pattern, only conventional risk factors such as hypertension, hyperlipidemia, smoking, family history for premature CHD, total cholesterol, serum triglyceride and serum uric acid were selected as predictor variables (seven variables). In this model, we did not divide the diabetic and nondiabetic patients into middle-aged and elderly. The CART method suggested three variables of hypertension, cholesterol concentration and uric acid concentration (Figure 3). It identified a cholesterol concentration of 228 mg/dl as the best risk cutoff point in hypertensive patients. About 80% of patients with a cholesterol concentration >228 mg/dl and with hypertension were at high risk for MI. However, the CART method identified a uric acid concentration of 7.2 mg/dl as the best risk cutoff point in nonhypertensive patients. The next best predictor in hyperuricemia patients without hypertension (child nodes) was a cholesterol concentration of 186 mg/dl as the best risk cutoff point. A total of 71% of hyperuricemia and diabetics without hypertension had a cholesterol concentration >186 mg/dl.

Classification and regression tree (CART) model applied to diabetic and nondiabetic patients with myocardial infarction (MI). In all of nodes of decision trees, diabetes mellitus is presented as diabetics = 1 and nondiabetic s= 0 as two comparable groups. Seven risk factors were selected as predictors. In this model, we did not divide the diabetic and nondiabetic patients into middle-aged and elderly. The CART method suggested three variables: hypertension, cholesterol concentration and uric acid concentration. The CART method identified a cholesterol concentration of 228 mg/dl as the best cutoff in hypertensive patients (about 80% had a cholesterol concentration ⩾228 mg/dl) and a uric acid (UA) concentration of 7.2 mg/dl as the best cutoff in nonhypertensive patients. The next best predictor in hyperuricemia patients without hypertension was a cholesterol concentration of 186 mg/dl (about 70% had a cholesterol concentration ⩾186 mg/dl).
In the fourth pattern, only conventional risk factors similar to the third pattern were selected as predictor variables (seven variables). However, in this pattern, we divided the diabetic and nondiabetic patients into middle-aged and elderly similarly to the first and second patterns. The CART method suggested two variables: hypertension and triglyceride concentration (Figure 4). It identified a triglyceride concentration of 193 mg/dl as the best risk cutoff point in middle-aged patients. About 65% of patients with a triglyceride concentration >193 mg/dl were at high risk for MI. However, about 65% of hypertensive elderly patients were at high risk for MI. The next best predictor in elderly patients was hypertension.

Classification and regression tree (CART) model applied to diabetic and nondiabetic patients with myocardial infarction (MI). In all of nodes of the decision trees, diabetes mellitus is presented as diabetics = 1 and nondiabetics = 0 as two comparable groups. Risk factors similar to the third pattern were selected as predictors. In this pattern, we divided the diabetic and nondiabetic patients into middle-aged and elderly. The CART model suggested two variables: hypertension and triglyceride (TG) concentration. The CART model identified a TG concentration of 193 mg/dl as the best cutoff in middle-aged patients. About 65% of patients with a TG concentration >193 mg/dl were at high risk for MI. About 65% of hypertensive elderly patients were at high risk for MI.
In evaluating the precision of different patterns, sensitivity and specificity were 47.9–84.0% and 56.3–93.0%. The highest sensitivity and specificity were related to the second pattern (Table 1). In general, sensitivity and specificity of patterns were suitable and satisfied.
Discussion
We present a study focused on the exploration of the application of data mining techniques to predict models for diagnosing MI. We constructed 4 predictive models using 12 input variables and 1 output variable in terms of their sensitivity, specificity and risk. Predicting risk occurrence of MI by means of a decision–analytic model such as the CART model can play an important role in MI prevention. Moreover, continuous evaluation of temporal trends concerning conventional risk factors for CHD is needed to revise population strategies in order to reduce risk and predict the future burden of CHD [Arnett et al. 2002].
In a study by Fonarow and colleagues, the risk of in-hospital mortality in patients with heart failure could be quickly and precisely determined using 39 admission clinical and laboratory variables by means of a CART-based analysis. This system has good discriminative ability and created a simple powerful tool to predict in-hospital mortality [Fonarow et al. 2005]. Elevated glucose levels in patients with acute coronary syndrome (ACS) on admission are a significant independent predictor of hospital mortality and this is even more important for patients who do not have known diabetes [Müdespacher et al. 2007]. Unrecognized diabetes and abnormal glycemic state were common in patients admitted with ACS. Almost every third patient had an abnormal glucose metabolism and more than half of these had frank diabetes that was not previously recognized. This study emphasized the difficulty in establishing a diagnosis of diabetes in the setting of ACS [Abdullatef et al. 2013]. Unfortunately, the one of the limitations of our study was an absence of detection for glycated haemoglobin (HbA1c) in patients with ACS. Therefore, we used detection of FBS as one of our routine measurements.
When we included conventional risk factors (seven predictors) along with FBS in the CART model in our study, a pattern similar to the second pattern was obtained (data not shown). As a result, the CART method identified an FBS level >134 mg/dl again as the best single risk cutoff point for both middle-aged and elderly patients at high risk for MI compared with the other predictors. The sensitivity and specificity of this pattern were also high (Table 1).
In another study similar to our study, researchers sought to construct an accurate algorithm for the diagnosis of acute MI in patients with nontraumatic chest pain on admission to the emergency department by the clinical symptoms such as ECG, creatine kinase (CK), CK-MB activity, myoglobin and cardiac troponin T which was drawn immediately after emergency department admission. This algorithm could accurately (90% correctly classified patients) separate the patients with acute MI from the others and therefore could be a valuable diagnostic aid to emergency department physicians to confirm rapidly a suspected MI [Mair et al. 1995].
However, there are a few differences between the study by Mair and colleagues and our study. Our work was a retrospective study with some conventional risk factors which cause an event such as MI. Whereas, the other work was a prospective clinical study where researchers could predict MI after 3 hours from the onset of chest pain through raised CK-MB and the other clinical symptoms. Our decision tree can be a precious diagnostic aid to clinicians for confirming the occurrence of MI. It could also be a valuable diagnostic aid to emergency department physicians for confirming a suspected MI and to cardiologists for predicting MI in future.
In third pattern (Figure 3), having two risk factors of hypertension and hypercholesterolemia, simultaneously could raise the risk of MI up to 80%. Therefore, hypercholesterolemia and hypertension showed a synergistic effect on incidence of MI. However, nonhypertensive patients with hyperuricemia and hypercholesterolemia might experience MI (71%) whereas, in these two situations, cholesterol concentrations were different as a risk cutoff point (Figure 3). As is seen, adding a cholesterol concentration node from a parent node of uric acid concentration led to a reduction in the cutoff point of cholesterol concentration from 228 to 186 mg/dl. But for the node with hypertensive patients, a cholesterol concentration ⩾228 mg/dl increased the risk of MI up to 80%. However, for the node with nonhypertensive patients, having a uric acid concentration ⩾7.2 mg/dl, a cholesterol concentration ⩾186 mg/dl provided additional predictive value.
In research by Bos and colleagues, high serum uric acid levels were associated with risk of MI and uric acid was a strong risk factor for MI [Bos et al. 2006]. However, younger patients with diabetes were more hypertriglyceridemic. Additional cardiovascular risk factors were associated with diabetes in the young. Younger patients with diabetes presented with a different cardiovascular risk profile than older patients, and the mean triglyceride concentration was significantly higher in younger than in older patients [Hatunic et al. 2005]. These studies parallel our study. In our study, hypertension could also raise the risk of MI (65%) in elderly patients (Figures 1 and 4), while middle-aged patients with triglyceride levels >193 mg/dl were at high risk. In each node of the patterns, a predictor variable and its cutoff point separate the patients into two groups. For example, the predictor triglyceride concentration with a cutoff point of 193 mg/dl (p = 0.001) was selected in the middle-aged group as a risk cutoff point (Figure 4). The predictor hypertension (p = 0.003) could possibly surrogate for triglyceride concentration in middle-aged groups, though the logic of the classification tree selected the best and the most robust predictor as variable/cutoff. Reduction in MCV could indicate iron deficiency or iron deficiency anemia. Iron deficiency can raise the risk of MI [Mahmoodi et al. 2007b].
One of the reasons of this disparity is the inequality in factor loading of risk factors in a CHD risk factors study. Profiles of risk factors and their relative risks for different age groups have been shown to be dissimilar and diverse [Mahmoodi et al. 2007a, 2007b]. Therefore, predictors in model could affect outcome. In addition, several factors associated with diabetes must be involved in the accelerated atherosclerosis among these patients. Generally, when an event such as MI occurs, we try to find the reasons (risk factors); however, when some of risk factors result in an event (MI), we can manage these risk factors for preventing that event. The concept of ‘a multifactor web of causation’ implies the presence of complex interactions of factors and circumstances, which may increase or reduce the risk of disease.
Conclusion
As well as other diagnostic tools, the CART model is capable of symbolizing interpretable clinical data for the confirmation and better prediction of MI occurrence in clinic or in hospital based on independent variables. Therefore, independent variables as predictor variables in a pattern could affect a dependent variable or outcome based on age group variable. Hyperglycemia, hypertension, hyperlipidemia and hyperuricemia were serious predictors for occurrence of MI in diabetics. Therefore, several factors associated with diabetes must be involved in the accelerated atherosclerosis among these patients.
Footnotes
Acknowledgements
The authors are grateful to Professor Masoud Kimiagar for his leadership.
Authors’ contributions
Mohammad Reza Mahmoodi developed the original idea and protocol and contributed in study design, data acquisition, and writing of the manuscript. Mohammad Reza Baneshi and Azam Rastegari contributed in statistical analysis and interpretation of tree model patterns.
Funding
The author(s) received no financial support for the research, authorship, and/or publication of this article.
Declaration of Conflicting Interests
The author(s) declared no potential conflicts of interest with respect to the research, authorship, and/or publication of this article.