
Abstract
Triple-negative breast cancer (TNBC) is highly aggressive and lacks targeted therapies, posing a major challenge in oncology. Traditional two-dimensional (2D) cell cultures fail to capture the tumor microenvironment’s complexity, whereas three-dimensional (3D) cultures provide a more accurate model of tumor biology. We developed an advanced 3D culture system for TNBC cell lines BT-20 and MDA-MB-231, enhancing the hanging-drop method with Matrigel to restore essential extracellular matrix interactions. Confocal imaging showed MDA-MB-231 cells forming clusters typical of aggressive carcinoma, while BT-20 cells organized into duct-like structures. Molecular analysis of PI3K and β-catenin target genes revealed distinct expression patterns, with PI3K overexpressed and β-catenin downregulated in 3D cultures. Moreover, β-catenin distribution in the 3D cell culture closely resembles its pattern in tissue. These findings underscore the value of 3D models in understanding TNBC progression and in supporting the exploration of novel therapeutic strategies.
Introduction
Breast cancer (BC) is a complex and multifaceted disease affecting millions of women worldwide, making it one of the most significant public health challenges of our time. 1 BC has been classified into different subtypes through molecular studies of gene expression. Among them, triple-negative breast cancer (TNBC) stands out due to its unique characteristics and clinical implications. TNBC is a subtype of breast cancer that lacks expression of the estrogen receptor (ER), progesterone receptor (PR), and human epidermal growth factor receptor 2 (HER2). 2 TNBC accounts for approximately 15%–20% of all breast cancer cases, making it a substantial subset of patients. 3 One of the distinctive characteristics of TNBC is its aggressive nature. TNBC tumors grow and spread rapidly, leading to a higher likelihood of metastasis to distant organs. This behavior often results in a poorer prognosis compared to other breast cancer subtypes.3–5 Additionally, TNBC is more commonly diagnosed in younger women and individuals with a family history of breast cancer, underscoring the importance of early detection and tailored treatment approaches.
Despite advances in imaging and molecular diagnostics, the absence of targeted therapies for TNBC continues to challenge effective treatment. Traditional 2D cell culture models have been instrumental in advancing our understanding of cancer biology. Nonetheless, the inability to replicate key features of the tumor microenvironment limits their predictive power for therapeutic testing. This has led to the development of three-dimensional (3D) culture systems, which offer a closer approximation of in vivo conditions by replicating tissue architecture, cell-matrix interactions, and nutrient gradients.6–10 Among these methods, Matrigel-based 3D culture systems have become a gold standard due to their ability to mimic the extracellular matrix (ECM), providing a laminin- and collagen-rich environment that promotes physiologically relevant cell behavior.9,11,12 In contrast, 3D suspension cultures, even offer an advantage for studying tumor spheroid formation and nutrient gradients, often lack the structural and biochemical cues provided by the ECM.13–16 This absence can result in less accurate modeling of cell-ECM interactions, which are essential for studying key processes in cancer, such as metastasis, proliferation, and drug response.9,10 The integration of Matrigel in 3D cultures addresses these gaps by promoting the development of organotypic structures with more complex and realistic cellular behaviors, including enhanced polarity and signaling activation, compared to suspension-based models.17–20 However, these systems often require large amounts of Matrigel, which can be costly and limit their use in resource-constrained labs. Reducing Matrigel consumption without compromising the integrity of 3D structures is essential to making advanced culture methods more accessible. By optimizing Matrigel usage, it’s possible to maintain the benefits of ECM interactions while reducing costs, allowing broader application in labs with limited budgets or access to specialized materials.
In this study, we present a modified hanging drop 3D culture method that incorporates the benefits of Matrigel, reducing the amounts required and making it an accessible option for laboratories worldwide. Triple-negative breast cancer cell lines were cultured, and morphological, genetic, and biochemical characterization was performed. Functional features such as time of structure formation, biomolecule isolation, staining feasibility, microscopy processing, assemble capacity, and ECM usage were improved by this method compared with the gold standard method on top. The molecular characterization of organotypic structures demonstrated distinct gene expression patterns and functional activity, including the regulation of proliferation-related pathways such as β-catenin and PI3K/AKT. Importantly, this methodology demonstrates that reducing the amount of Matrigel does not compromise the quality or reproducibility of the 3D structures, positioning the solid hanging drop method as an innovative, accessible, and scalable platform for studying TNBC. This study underscores the potential of this approach to bridge gaps between resource-intensive traditional methods and the need for practical, cost-effective solutions, thereby advancing cancer research and the development of personalized therapeutic strategies.
Materials and methods
Three-dimensional triple-negative breast cancer cell culture establishment
The cellular suspension contains 1 × 10⁶ cells/500 ml of conditioned culture media (Corresponding culture medium for each cell line supplemented with 10% of fetal bovine serum). Then, mix 500 ml of Matrigel® Matrix Growth Factor Reduced (GFR; Corning, REF. 354230 NY, USA) with 500 ml of cellular suspension to get a proportion 1:1 until a homogeneous suspension is obtained (Matrigel final dilution 1:2). To form the organotypic structures, 20 ml of cells/matrigel mix are placed as individual drops onto the prewarmed 6-well plate (Sarstedt, cat. 83.3920, Nümbrecht, Germany), which is then inverted overnight for Matrigel polymerization (ensures organoid positioning in the middle of the drop). The next day, the plate is flipped back up and 3 ml of conditional culture media is added. To maintain the culture the media was refreshed every 48 h. To analyze this 3D-cell culture, the organotypic structures were released for their attachment matrix. To avoid the analysis intervention of proteins in Matrigel, the Matrigel was dissolved with three washing organotypic solution (OWB) consisting of 1 ml Triton X-100 and 2 g of BSA dissolved in 1 l of PBS.
Two-dimensional triple-negative breast cancer cell cultures
Triple-negative breast cancer cell lines BT-20(ATCC HTB-19) and MDA-MB-231 (ATCC HTB-26) were cultured in EMEM medium (ATCC 30-2003) and L-15 medium (ATCC 30-2008) respectively. Both culture media were supplemented with 10% (v/v) fetal bovine serum (ATCC 30-2020). BT-20 cells were maintained at 37°C with 5% CO2. Whereas, MDA-MB-231 cells were maintained at 37°C without CO2.
All the following procedures were perform using the both cell lines cultured in 2D and 3D conditions.
Morphology validation of the organotypic breast cancer cell lines
To characterize the morphology of these structures, we optimized the immunostaining protocol to enhance three-dimensional cell visualization. Organoids were fixed with 1 ml of 4% paraformaldehyde (PFA) overnight at 4°C. The following day, the PFA was discarded, and organoids were washed twice with OWB solution.
For permeabilization, the organoids were incubated with PBST (PBS with 0.5% Tween 20) for 10 min at 4°C on a horizontal shaker at low speed. Blocking was performed by resuspending the organoids in OWB for 5 min at 4°C on the same shaker. The primary antibody against β-catenin (Abcam, ab16051) and a secondary antibody labeled with Cy2 (Abcam, ab6940) were diluted in OWB and incubated overnight at 4°C with gentle rocking. DAPI (Abcam, ab228549) was used to stain the nuclei. The stained organoids were mounted on coverslips using an imaging spacer (Grace Bio-Labs, 1121003) and a mounting solution composed of 60% glycerol (vol/vol) and 2.5 M fructose.
Functional score of 3D cell culture methods
A functional score was established to evaluate the effectiveness of 3D cell culture methods. Based on specific characteristics such as culture time, extracellular matrix usage, assembly capacity, fluorescence microscopy processing, staining feasibility, and biomolecule isolation yield. Each feature was subjectively scored on a scale of 1–5, based on insights from the literature,10,21–25 with lower scores indicating greater complexity or lower efficiency. For instance, methods requiring more than 9 days of culture, using lower cell concentrations, with a complicated assembly, or being difficult to process for microscopy and staining received low scores. In contrast, methods that were faster, simpler, and more efficient in handling and biomolecule isolation were scaled with higher scores. The score provides a comparative tool to identify the strengths and limitations of each 3D culture method (Table 1).
Functional score of 3D-cell culture methods. The description of the score calculation for each feature is detailed in section of 2.1 of material and methods.

Imaging processing
The morphology of organotypic structures was visualized using a confocal microscope (Zeiss LSM 710 DUO, Oberkochen, Baden-Württemberg, Germany) equipped with lasers for excitation at 405 and 488 nm. Z-stack imaging was performed with 3 µm slice thicknesses. Data from three independent experiments were collected using a 63× oil immersion objective. Image processing was conducted with ZEN lite software version 3.5, and 3D reconstructions were performed using Imaris software.
RNA purification
RNA isolation was performed using the TRIzol protocol from Invitrogen. For each 600,000 cells seeded in either 2D or 3D cultures, 1 ml of TRIzol reagent was used. RNA concentration and protein-to-RNA ratios were assessed with a UV spectrophotometer. For expression microarray analysis, an RNA Integrity Number (RIN) greater than 6 was considered indicative of high-quality RNA.
Gene expression analysis
RNA expression of coding genes was assessed using the Human Clariom™ D Microarray (Thermo Fisher, 902922). For hybridization, 100 ng of RNA from either 2D or 3D cultures was used, and all procedures followed the Human Clariom D microarray protocols. The fluorescent intensity of each probe set was measured with the Affymetrix GeneChip Scanner to generate CEL files. Raw data are available in GEO data bank (GSE277405).
Validation of gene expression profiles between SHD and Ontop methods
The SHD data were obtained using the Clariom D microarray, to capture gene expression profiles from 3D cultures with mass and stellate morphologies, while the Ontop data were sourced from the E-TABM-244 database, which employs the U133A microarray. Both datasets were normalized using the Robust Multi-array Average (RMA) method. Differential expression analysis was performed using the limma package, classifying genes as upregulated, downregulated, or stable based on a logFC ⩾ 2 or ⩽−2 and an adjusted p-value < 0.05. Shared genes between the SHD and Ontop datasets were identified by their unique gene IDs, enabling the creation of expression matrices with only deregulated genes. To assess the equivalence between the two methods, Pearson correlation was calculated between the logFC values of these shared genes. The comparison of correlations between SHD and Ontop growing samples from MDA-MB-231, BT-549, Hs578T, MDA-MB-436 (stellate morphology), and BT-20, MCF-7, and T-47D (mass morphology) each correlation matrix was performed in R studio by the corrplot library.
Differential expression analysis
Raw microarray data were pre-processed using the Robust Multichip Average (RMA) method to generate mRNA expression profiles, analyzed with the Transcriptome Analysis Console (TAC) version 4.0.2. Probesets were mapped to their corresponding mRNAs, and quantile normalization was applied to account for technical variability. Differential expression (DE) analysis was conducted with limma, comparing 3D and 2D culture conditions. DE genes were identified and adjusted for multiple testing using the Benjamini–Hochberg method, with a false discovery rate (FDR) set at 0.05. Genes with a fold-change greater than 2.0 and an adjusted p-value below 0.05 were considered significantly differentially expressed.
Heatmap visualization using ComplexHeatmap
To visualize the expression profiles of differentially expressed genes, heatmaps were generated using the ComplexHeatmap package in R. Rows of the heatmap represent individual genes, while columns correspond to experimental conditions (3D and 2D cultures). Hierarchical clustering was performed on both rows and columns to identify clusters of genes with similar expression patterns and experimental conditions.
Functional enrichment analysis
Enrichment analysis of differentially expressed genes related to biological processes was conducted using Enrichr with the MSigDB Hallmarks 2020 database. This database includes gene sets associated with key biological processes in cancer, as defined by Hanahan and Weinberg. 26 Results were visualized using a bubble plot created with the ggplot2 package in R, where bubble size represented the number of enriched genes, and color indicated the adjusted p-value, highlighting significantly enriched terms. The association between significant biological processes resulting from enrichment analyses was tested by their unique or shared genes using a Venn diagram.
Analysis of β-catenin distribution in 2D, 3D and breast cancer tissue
For detection of the active β-catenin form, its localization to the cell nucleus was analyzed using Imaris software of the acquired confocal images from 2D (n = 10), 3D (n = 10) cultures and immunohistochemistry breast cancer tissues (n = 10). Images were prepared and aligned to ensure accurate assignment of β-catenin and nuclei channels.
Imaris was used to segment nuclear and β-catenin signals in confocal and immunohistochemistry images. Background noise was removed to ensure accuracy, and the colocalization tool assessed the spatial overlap between the two signals. Pearson’s correlation coefficient (r) was then calculated to quantify colocalization by measuring signal intensity at each voxel and applying the Pearson formula. A value close to +1 indicates strong colocalization, 0 indicates no correlation, and −1 indicates inverse correlation. This analysis provides a quantitative measure of the relationship between β-catenin and nuclear signals in tissue, 3D and 2D cell cultures.
The results were stratified into three categories based on correlation strength (high, medium, and low) to reflect β-catenin localization trends. High correlation (r > 0.5) indicated significant nuclear β-catenin presence, while low correlation (r < 0.2) suggested cytoplasmic and membrane localization. A total of 10 cells were considered, with 100% of these included to observe the distribution pattern in each condition.
Protein purification and Western blot
Western blot was performed according to Coronel-Hernández et al. Previously described. 27 Briefly, protein extraction was performed using RIPA lysis buffer (Santa Cruz). Proteins were isolated by centrifugation at 12,000 rpm for 20 min. Electrophoresis was conducted on a 4%–12% Bis-Tris polyacrylamide gel (Merck), and proteins were transferred to a PVDF membrane (Millipore). Membranes were incubated overnight with primary antibodies at a 1:1000 dilution: β-catenin (Total, 9582S), Active p-β-catenin (Ser33/37/Thr41, 8814S), AKT (Cell Signaling, 9272S), p-AKT S473 (Cell Signaling, 9271S), and β-Actin (sc-47778). The following day, membranes were treated with secondary antibodies (Anti-Rabbit, 7074S or Anti-Mouse, 7076S) at a 1:10,000 dilution. Detection was performed using SuperSignal™ West Femto Maximum Sensitivity Substrate (34096).
Western blot image acquisition and densitometric analysis
Western blot images were acquired using a chemiluminescence imaging system with optimal exposure to ensure accurate quantification. Images were imported into Fiji (ImageJ) v1.54.21,22 Images were calibrated to ensure pixel intensity values corresponded linearly to protein concentration. Background subtraction was uniformly applied across all images to reduce noise and enhance signal specificity.
The quantification of each band intensity was standardized by a consistent thresholding method. The threshold level was set to differentiate between specific bands of interest and background noise, ensuring that only relevant signal intensities were included in subsequent quantification steps. Each band of detected proteins like β-catenin, AKT, PI3K, and β-actin was manually delineated using Fiji’s band detection tools. The intensity of each band was measured as pixel density within defined regions of interest (ROIs), with thresholding ensuring that only pixels above the set threshold were considered for quantification. The intensity of each target protein band was normalized against the intensity of the β-actin band (load control) within the same lane. Relative densitometry values were calculated using the formula:

This corrected normalization was performed for protein loading and gel-to-gel variability, enabling accurate comparison between experimental conditions. For statistical analysis, GraphPad Prism software (version 8) was used. Relative densitometry values between experimental conditions or treatment groups were compared using ANOVA, with significance levels at p < 0.05.
Results
Standardization and morphological characterization of the solid-hanging drop 3D culture method
Organotypic structures (OS) from triple-negative breast cancer (TNBC) cell lines BT-20 and MDA-MB-231 were seeded, cultured, retrieved, and evaluated as depicted in the schematic in Figure 1(a). At least 5 days are necessary from seeding until re-covery of organoids. Initially, a matrigel/cell suspension is prepared and deposited as small drops on the plate surface for overnight incubation, with the plate inverted to during matrix polymerization. On the following day, the plate is reoriented upright, and culture media is added to immerse the OS. Five days post-culture setup, OS structures are examined using widefield microscopy, and OS recovery is performed to proceed with further analyses.
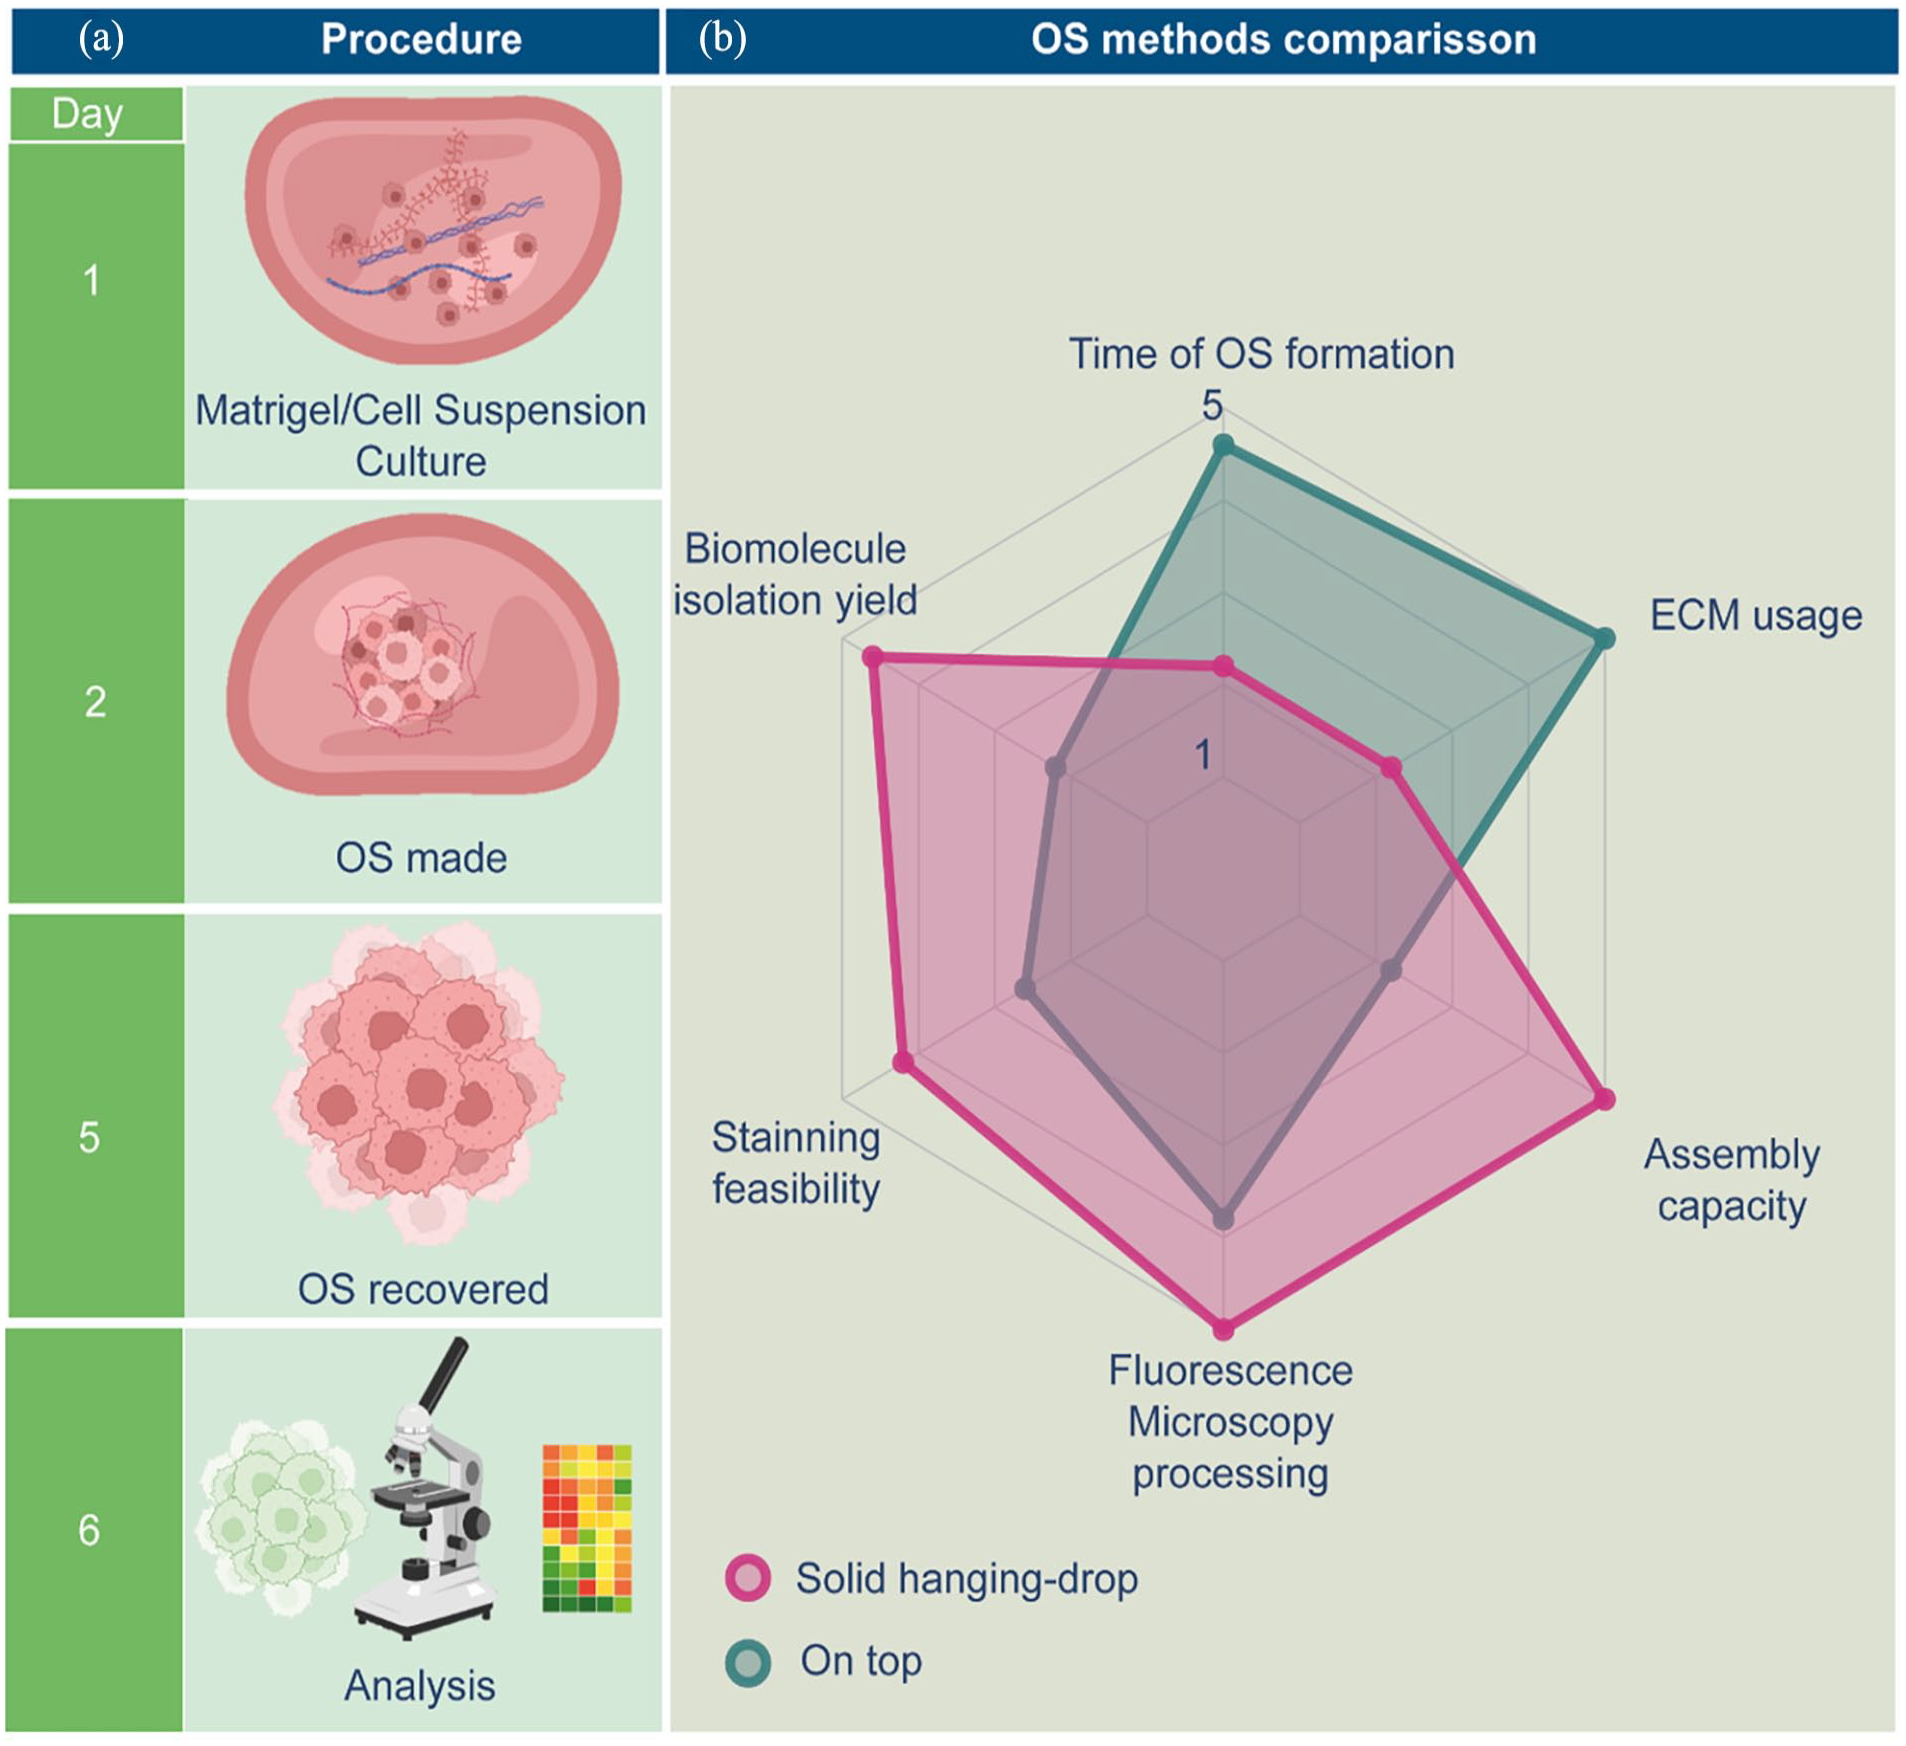
Workflow and Advantages of the Solid Hanging-Drop Method. (a) The solid hanging-drop method begins with the mixture of cell suspension and Matrigel at a 1:1 ratio. Small droplets of this mixture are placed onto the surface of a pre-warmed cell culture well plate, which is then inverted overnight during Matrigel polymerization. On the following day, the plate is flipped right side up and droplets are covered with culture medium. By the fourth day, the formation of organotypic structures can be observed. On the fifth day, cold PBS is used to gently release the 3D structures, freeing the organotypic structures from the Matrigel. By 6 days, these structures are ready for nucleic acid or protein purification for molecular analysis or can be fixed for microscopic characterization. (b) The radar plot highlights a comparative analysis between the optimized hanging drop method and the traditional on-top assay for generating 3D structures. Key parameters evaluated include time efficiency, amounts of extracellular matrix (ECM), assembly capacity, ease of imaging, staining suitability for microscopy, and biomolecule isolation efficacy.
The comparison of this methodology implementation with the traditional on-top assay is essential for validating its efficacy and identifying improvements in key areas, including time to OS formation, amounts of extracellular matrix (ECM) required, assembly capacity, fluorescence microscopy processing, staining feasibility, and the yield of purified biomolecules. In the radar plot depicted in Figure 1(b), each axis represents one of these parameters, evaluated on a functional score from 1 to 5. Scores were assigned as mentioned in Material and Methods section 2.3. Higher scores indicate superior performance. The solid-hanging drop method demonstrated improvements in time to assembly, ease of staining and imaging, and reduced reagent use. Furthermore, it enhanced biomolecule isolation efficiency, facilitating more precise molecular analyses. These advantages improve experimental reproducibility, reduce costs, and provide a more physiologically relevant model, making the method a valuable asset for TNBC research and other fields requiring advanced 3D culture systems.
Morphological characterization of organotypic structures and their gene expression comparison with conventional 3D scaffold cell culture method
For morphological characterization, OS from BT-20 and MDA-MB-231 cell lines were stained for β-catenin protein and DNA, serving respectively as cytoplasmic and nuclear markers. Confocal microscopy Z-stacks revealed distinct morphologies: BT-20 cells exhibited organized mass structures typical of ductal breast adenocarcinoma, whereas MDA-MB-231 cells formed stellate morphology indicative of aggressive carcinoma (Figure 2(a) and Supplemental Videos S1 and S2).10,28,29 Additionally, size differences were noted between OS of the two cell lines, with maximum projections using Imaris software showing BT-20 OS diameters between 30 and 37 µm and MDA-MB-231 OS diameters at 60 µm (Figure 2(b)). This characterization highlighted the fidelity of our 3D culture method in replicating tumor architecture in these cell lines.

Morphological characterization of TNBC organotypic structures. (a) Z-stack confocal images of organotypic structures of BT-20 and MDA-MB-231 cells. b-catenin protein is labeled in green and DNA (nuclear reference) in Blue. Bar = 10 mm. The lower panel corresponds to the maximum projection. Bar = 15 µm. (b) Confocal images were processed using Imaris software. Morphological structure of BT-20 and MDA-MB-231 organoids is showed. Bar = 10 µm. A representative picture of triplicate analysis is presented. (c) Pearson correlation of gene expression profile based on morphology comparing conventional 3D scaffold cell culture with the solid hanging-drop (SHD) method. The analysis includes data from MDA-MB-231, BT-549, Hs578T, and MDA-MB-436, cells that exhibit a stellate morphology, as well as BT-20, MCF-7, and T-47D, cells that form mass-like structures in traditional 3D culture. These expression profiles were compared with gene expression data of the cells growing in the SHD method. Higher correlations are depicted in blue (R = 1), while lower correlations appear in yellow (R = 0).
To validate the SHD method as a cost-effective and reproducible tool for gene expression analysis, a comparison with the Ontop method was performed. This was made using the gene expression profiles of BT-20 (that forms mass structures) and MDA-MB-231 (forms stellate structures) cell lines cultured in the SHD method. Based on morphology acquired by these cell lines, we compared the transcriptomic data with the same data of breast cancer cells that exhibit similar morphologies cultured in Ontop method. The gene expression profile from cell line MDA-MB-231 (stellate morphology) was used, whereas MCF-7 and T-47D cells (mass morphology) profiles were used. The matrix shown in Figure 2(c) revealed a positive correlation of 0.4683 between MDA-MB-231 cells cultured using SHD or Ontop conditions. Furthermore, cell lines T-47D and MCF-7 cultured in Ontop exhibited higher correlation levels of 0.6509 and 0.7375 with BT-20 cells cultured in SHD. These results position the SHD method as an accessible 3D cultured method for cancer research.
Distinct gene expression in OS derived from TNBC cells compared to 2D cultures
To evaluate the utility of solid-hanging drop OS for molecular assays, mRNA microarray analysis was conducted comparing gene expression of BT-20 and MDA-MB-231 cells in 2D versus 3D systems. The heatmap in Figure 3(a) demonstrates mRNA expression levels of 1972 dysregulated genes. High-expressed genes (1014) are represented in red, and low-expressed genes (958) in blue. Z-scores ranging from −2 to 2 with a p-value ⩽ 0.05. Clustering based on Euclidean distances segregated gene expression profiles into two main groups: 2D and 3D cultured cells. Enrichment analysis of the overexpressed genes using the Shiny GO 0.81 biological process dataset (Figure 3(b)) revealed significant enrichment in signaling pathways associated with 3D environments, such as response to external stimulus, cell adhesion, transmembrane transport, homeostatic process, cell-cell signaling, cell motility, cell surface receptor signaling pathway, regulation of cell population proliferation, response to stress, and cell differentiation. To discard that the expression pattern observed could be induced by the cellular stress that represents the change of culture environment between 2D and 3D conditions, we established the specific participation of overexpressed genes in response to cellular stress, external stimulus, positive regulation on molecular function, regulation of cell proliferation, and cell motility (Figure 3(c)). Only 30 genes are unique to cellular stress, whereas 26, 17, 13, and 22 correspond to the other cellular functions, respectively. Interestingly, 644 genes were shared between all processes (Supplemental File 1). These pathways analysis reveal how the 3D cell culture model responds to the unique conditions of the microenvironment through interconnected biological pathways. In addition, our results highlight the complexity of the SHD 3D model and how the microenvironment induces a biological response that more closely resembles in vivo conditions.
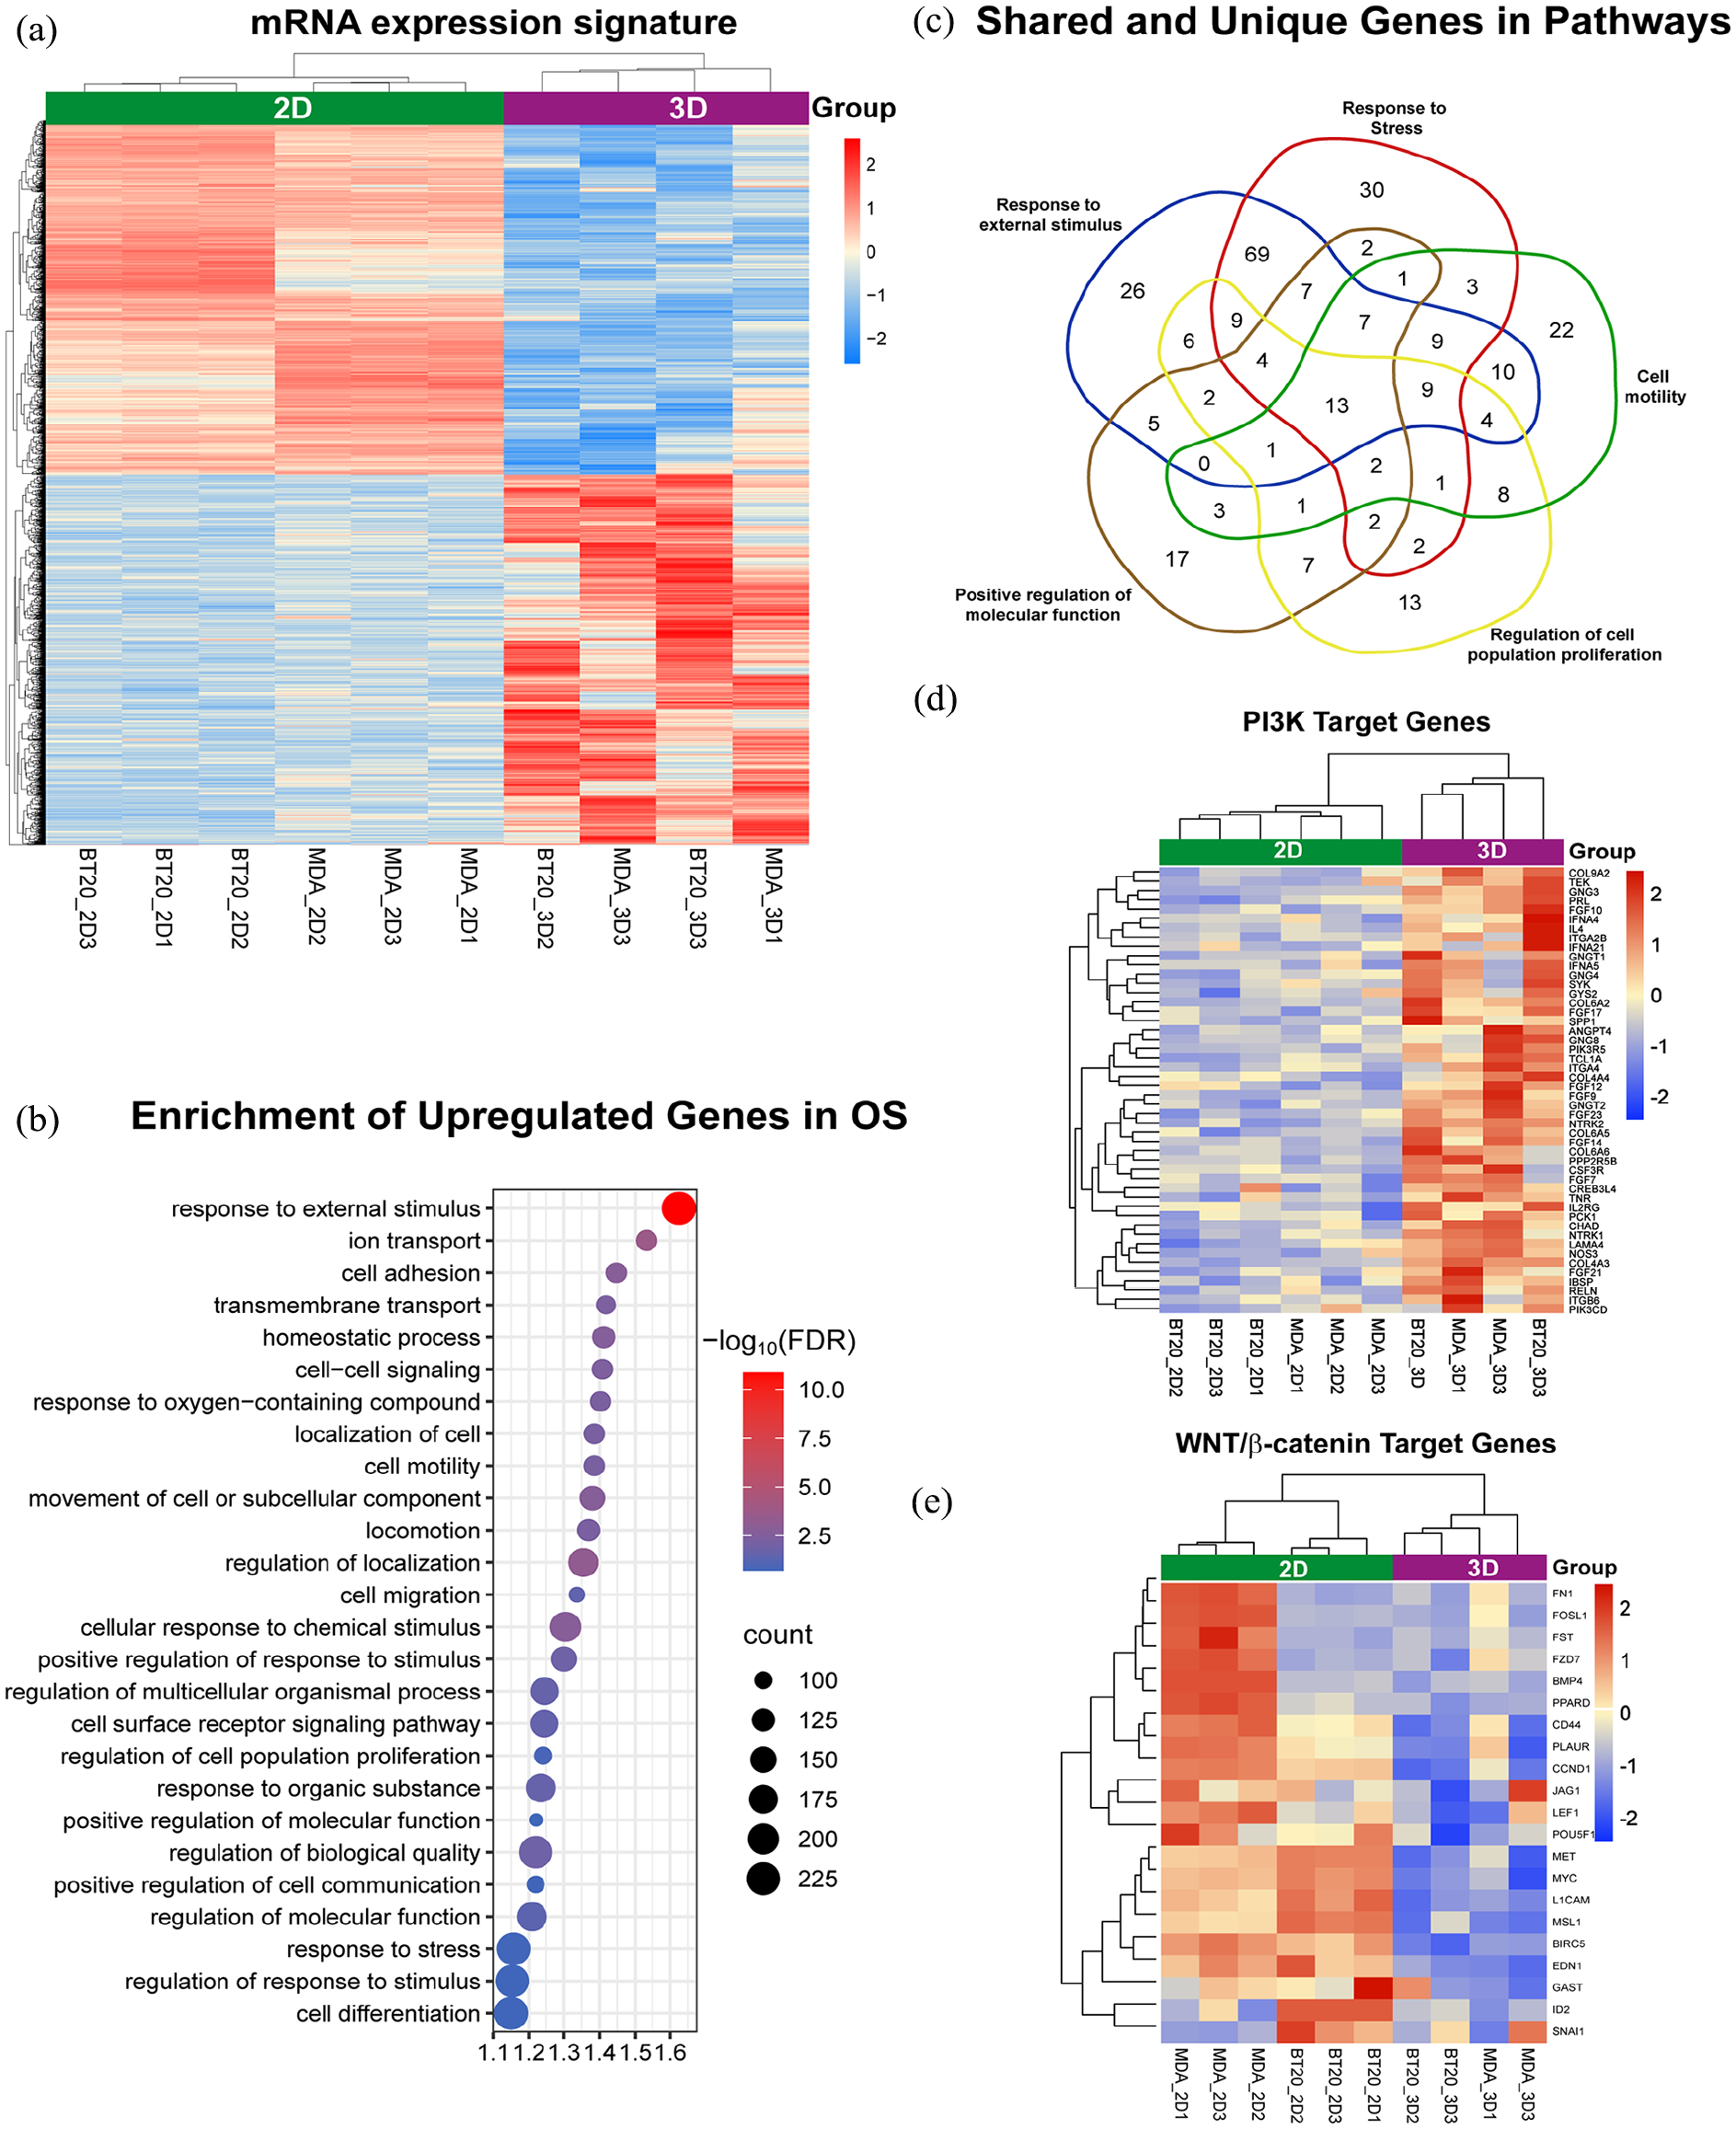
Gene expression analysis of TNBC cells cultured in 2D versus 3D conditions highlights differential transcriptional programs. (a) The heatmap shows mRNA expression levels of BT-20 and MDA-MB-231 cells cultured in 2D or 3D conditions. The scale bar represents Z-score normalized values. A Z-score of 2 (red) indicates the highest level of overexpression, while a Z-score of −2 (blue) indicates the highest level of downregulation. (p-value < 0.05, Fold Change 2). (b) The bubble plot highlights the overexpressed mRNAs in 3D cultures with significantly enriched in GO-Biological process in organotypic structures (OS). (c) The Venn diagram shows the shared and unique genes in significant enriched pathways in OS. (d) The heatmap illustrates the downregulation of the β-catenin signature and the upregulation of the PI3K signature in 3D culture conditions compared to 2D cell culture conditions. (e) The heatmap illustrates the downregulation of the β-catenin signature and the upregulation of the WNT signature in 3D culture conditions compared to 2D cell culture conditions.
Focusing on key pathways driving cancer cell adhesion, motility, proliferation, and response to stress such as PI3K/AKT and β-catenin signaling a sub-analysis of expression genes regulated by these signaling pathways was performed. The results showed a robust upregulation of genes associated with PI3K/AKT signaling and downregulation of genes linked to the β-catenin pathway in 3D cultures (Figure 3(d) and (e)). Whereas the opposite was seen in 2D cultures, indicating distinct regulatory dynamics in the 3D environment and reflecting complex signaling interplay in TNBC cells.
Differential activation of β-catenin and PI3K/AKT signaling pathways in TNBC: 2D versus 3D cultures
To corroborate the differential activation of β-catenin signaling in TNBC cell lines cultured in 2D and 3D systems, immunofluorescence was employed to assess protein distribution. In 2D cultures (Figure 4(a)), β-catenin predominantly localized to the nuclei of BT-20 (r = 0.15 ± 0.01) and MDA-MB-231 (r = 0.39 ± 0.02) cells, with limited membrane presence, indicating pathway activation. Conversely, in 3D cultured cells (Figure 4(b)), β-catenin distribution was more uniform across membranes (especially at cell-cell contacts) and the cytoplasm, with minimal nuclear localization (BT-20 r = 0 ± 0.05; MDA-MB-231 r = 0.19 ± 0.02). Figure 4(c) provides 3D reconstructions of β-catenin distribution in BT-20 and MDA-MB-231 OS, reinforcing its role in cell-cell adhesion at membrane contact sites.

Distribution of β-catenin in each cell culture condition and comparison with breast cancer tissue. Immunofluorescence images of β-catenin (red) and nuclei (DAPI, blue) in 2D (a) and 3D (b) cultures of breast cancer cell lines BT-20 and MDA-MB-231. (c) 3D reconstruction of organotypic structures (OS) of TNBC cell lines showing the spatial localization of β-catenin protein. Scale bar: 10 µm. (d) Immunohistochemistry (IHC) images of β-catenin in breast cancer tissue, obtained from The Human Protein Atlas. (e) Pearson correlation of nuclear β-catenin across different models (n = 10).
The IHC results obtained from The Human Protein Atlas for breast cancer tissue reveal a pattern very similar to the distribution of β-catenin observed in our 3D cultures (Figure 4(d) and (e)). There is an absence of nuclear localization (r = 0.19 ± 0.02), with a predominant distribution in the cytoplasm and at cell-cell junctions. This correspondence is significant as it highlights the ability of the 3D culture model to more accurately mimic the in vivo distribution of β-catenin in breast cancer tissue, suggesting that 3D cultures may be a more physiologically relevant model for studying cellular interactions and signaling in cancer research.
Subsequent biochemical characterization using western blot elucidated β-catenin and AKT/PI3K pathway activities. Western blot analysis, coupled with densitometric quantification, revealed high levels of active β-catenin in 2D cultures. In contrast, 3D cultures exhibited significantly reduced active β-catenin levels (Figure 5(a) and (b)). Conversely, active AKT levels were elevated only in OS of MDA-MB-231 cells whereas BT20-derived OS displays low levels suggesting that another pathway is maintaining the proliferation in these cells. These findings underscore the complexity of interactions between 3D culture environments and cellular signaling pathways, which vary not only by protein but also by cell line context, highlighting the importance of considering specific cellular settings in the study of 3D culture effects on signaling pathways.

Expression of β-catenin and AKT protein in 2D and Organotypic Structures. (a and b) β-catenin total and phosphorylated levels in BT-20 and MDA-MB-231 cells. (c and d) AKT total and phosphorylated levels in BT-20 and MDA-MB-231 cells. All western blots were performed by triplicate. *p < 0.05.
Discussion
The limitations of traditional 2D monolayer cell culture models have long hindered the comprehensive understanding of cancer biology’s complexity. A flat, 2D environment fails to mimic cell interactions with the surrounding microenvironment, potentially leading to misleading results.15,30 One promising approach to overcome this challenge is 3D cell culture. This allows cells to grow in a three-dimensional space stimulus.6,22,23,31–33 However, establishing 3D culture systems represents significant challenges. Commonly used 3D culture methods often require specialized equipment and extensive training and can be time-consuming and expensive.16,23,25,28,34,35 Cellular aggregates could be generated using mechanical forces or scaffold matrices, with the hanging-drop and on-top methods being the most employed due to their efficacy. The hanging-drop method is a scaffold-free approach leveraging surface tension to form cellular aggregates. However, it has notable limitations, such as the difficulty of media replacement without disrupting structures, challenges in long-term culturing, and the need for continuous motion to maintain 3D structures.22,23,25,36 Conversely, on-top techniques use a solid matrix (i. e. agarose or Matrigel) to coat the plate surfaces and a diluted matrix for the top of the cells. 10 Around 7 days later spheroid structures are ready to be analyzed. Several disadvantages of this method have been documented, such as visualization, nucleic acid isolation, and protein purification, which are difficult to carry due to the complexity and high protein components of their scaffold. 37 Our proposed “solid hanging-drop (SHD) method” addresses these barriers by offering a simplified technique that embeds cells in culture media and dilutes Matrigel, forming droplets on an inverted plate. This methodology implementation eliminates the need for complex equipment, extensive training, and specialized and expensive plates. This technique combines the best features of the hanging-drop and On Top methods, resulting in an innovative methodology with advantages such as easy assembly, lower ECM consumption, no special equipment or plates required, and the ability to obtain 3D structures in a few days. Most importantly, this method consistently recreates the typical tumoral morphology, accurately reflecting cell-matrix interactions and fostering better biomolecule isolation for further analysis. Solid-hanging drop method’s effectiveness is underscored by its ability to replicate the organotypic structures (OS) growing of TNBC cell lines like to sophisticate on top methods, wherein BT-20 cells form duct-like structures, and MDA-MB-231 cells organize into grape-like clusters, reflecting their tumor origins.10,16 The fidelity in replicating the tumor architecture of the OS validates the solid-hanging drop method as a physiologically relevant platform for studying cell behavior, the same as the widely used 3D methods.9,10,29 Moreover, for a better study of TNBC features the SHD organotypic structures could be extended to in vivo models like those previously reported by Dr. Brisken and Cols,38,39 in which ER-positive and TNBC cells were cultured in mice models for the analysis of the microenvironment influence in more physiological conditions.
The importance of 3D cultures in cancer research is increasingly recognized. Several studies have shown that the distinctive morphologies observed in breast cancer cell lines cultured in 3D systems significantly correlate with their gene expression signatures. 10 Also, the tridimensional microenvironment induces cells to self-organize transcriptionally. Gene expression analysis of SHD cultured cells revealed marked differences between cells cultured in 2D and 3D environments. Microarray data demonstrated specific transcriptional profiles, suggesting a significant shift in gene expression patterns triggered by the 3D microenvironment. Notably, the high-expressed genes in 3D cultured cells are involved in pathways that regulate the cell response to the environment. These findings correlate with the expression profiles observed by solid matrix-3D cultures as On-top method.16,31,40 Our results demonstrate that the SHD method faithfully reproduces transcriptional profiles and signaling pathways commonly reported in sophisticated 3D models, such as the On-Top method. This evidence validates that the solid-hanging drop is an efficient method that reproduces critical aspects of previously reported 3D culture methods with a further application in high-throughput analyses. Moreover, the predominance of responses to external stimuli suggests that cells cultured using the SHD method actively react to the physical and chemical changes inherent to the three-dimensional environment. The activation of stress responses indicates that cells are exposed to challenging conditions, such as hypoxia or nutrient limitation, hallmarks of 3D structures that more accurately reflect tumor physiology. 41 Additionally, the regulation of cell mobility and proliferation in this context suggests a reorganization of cellular architecture and a distinct growth modulation compared to two-dimensional cultures. Furthermore, the interconnection of these processes through shared gene expression reinforces the idea that multiple signaling pathways interact to facilitate cellular adaptation and survival in a three-dimensional setting. 42
Focusing on signaling pathways that mainly regulate proliferation in breast cancer; we observed an interesting interplay between the 3D environment, β-catenin and PI3K/AKT signaling. While β-catenin target genes are expressed in high levels in TNBC cell lines BT-20 and MDA-MB-231 cultured in 2D; the same cells cultured in 3D SHD conditions have low expression levels of this protein. In addition, genes regulated by AKT/PI3K signaling are downregulated in 2D and over-expressed in 3D cultured cells. The apparent contrasting activation of the two signaling pathways is dependent on the culture type. The downregulation of b-catenin target genes in 3D cultures correlates with the protein distribution observed by microscopy. Pearson correlation of b-catenin location confirms a less distribution at the nucleus of the cell of protein for both cell lines cultured in 3D conditions. Moreover, IHC analysis of breast cancer tissues revealed a correspondence of the distribution of b-catenin such as the 3D SHD cell cultures. This correlates with western blot analysis that confirmed a decrease in the active form of β-catenin. These observations support the sensitivity of the solid-hanging drop method in the imaging for protein distribution within 3D cultures. This is particularly significant considering the inherent challenges associated with imaging in 3D systems.37,43,44 Finally, the AKT activation in 3D cultures was confirmed by western blot assays. Interestingly, MDA-MB-231 cells showed a significant increase in active AKT levels in 3D despite a decrease in total AKT. This suggests a potential compensatory mechanism where AKT activation sustains proliferation despite the reduced β-catenin activity in MDA-MB-231 cells cultured in 3D. This observation is in line with the previous reports that positioned PI3K/AKT signaling pathways as a main pathway in TNBC progression.45–48 Furthermore, several works have shown specific pathway activation depending on cell line type or the cultured conditions. 46 Whereas, in traditional 2D cultures, more than one pathway might be active to support uncontrolled proliferation; the 3D environment appears to disrupt this co-activation, potentially explaining the observed changes in cell behavior.21,49–51 This underscores the importance of studying TNBC cell biology in models like organotypic structures (OS) that better represent the tumor microenvironment.
Conclusion
This study highlights the significant impact of the 3D culture environment on cellular signaling pathways. The observed effects were not only protein-specific but also cell line-dependent. These findings emphasize the limitations of 2D cultures and the importance of utilizing user-friendly 3D models like OS for studying cell biology. By overcoming the challenges associated with traditional 3D culture methods, the solid-hanging drop method offers a valuable tool for researchers to unscramble the complexities of cellular behavior and advance our understanding of various biological processes.
Supplemental Material
sj-xlsx-1-tej-10.1177_20417314251326668 – Supplemental material for Development of a reliable method for human triple-negative breast cancer organotypic culture: Improving imaging and genomic studies in 3D cultures
Supplemental material, sj-xlsx-1-tej-10.1177_20417314251326668 for Development of a reliable method for human triple-negative breast cancer organotypic culture: Improving imaging and genomic studies in 3D cultures by Mercedes Olvera-Valencia, Verónica Garcia-Castillo, Rosalío Ramos-Payan, Maribel Aguilar-Medina, Samuel Trujano-Camacho, Alejandro López-Saavedra, Laurence A. Marchat, Cesar López-Camarillo, Ronen Sumagin, Eloy Pérez-Yepez and Carlos Pérez-Plasencia in Journal of Tissue Engineering
Footnotes
Acknowledgements
Image analysis was conducted using Imaris software, acquired with funding from the National Strategic Program in Health (Pronace-Salud) of the Mexican National Council for Humanities, Science, and Technology (Consejo Nacional de Humanidades, Ciencia y Tecnología, CONAHCYT, PRONAII Leucemia Infantil, Project 302978 to Michael Schnoor at Cinvestav-IPN). The authors gratefully acknowledge the Mexican Bioimaging Workshop program (MBW), funded by the Chan Zuckerberg Initiative (Project: Connecting the Mexican Bioimaging Community, No. GBI-0000000093), where M.O. and E. A. P. Y. gained valuable experience in tissue clearing techniques and multidimensional microscopy imaging. We also acknowledge the support of the Instituto Nacional de Cancerología - Advanced Microscopy Applications Unit (ADMiRA), RRID:SCR_022788.
Author contributions
For research articles with several authors, a short paragraph specifying their individual contributions must be provided. The following statements should be used “Conceptualization, R.R.-P., C. L.-C., and C.P.-P.; methodology, M.O.-V., V.G.-C., S. T.-C., and E. P.-Y.; validation, M.O.-V., V.G.-C. and S. T.-C.; formal analysis, A.L.-S-.; resources, L.M.-M. and R.S.; writing—original draft preparation, M.O.-V., E. P.-Y. and C.P.-P. ; writing—review and editing, C.L.-C., E. P.-Y. and C.P.-P.; visualization, L.M.-M. and R.S.; supervision, C.P.-P.; project administration, C.P.-P.; funding acquisition, R.R.-P., C. L.-C., R.S. and C.P.-P. All authors have read and agreed to the published version of the manuscript.”
Funding
The authors received no financial support for the research, authorship, and/or publication of this article.
Declaration of conflicting interests
The author(s) declared no potential conflicts of interest with respect to the research, authorship, and/or publication of this article.
Data availability statement
All data is available upon request to Author of Correspondence.
Supplemental material
Supplemental material for this article is available online.
References
Supplementary Material
Please find the following supplemental material available below.
For Open Access articles published under a Creative Commons License, all supplemental material carries the same license as the article it is associated with.
For non-Open Access articles published, all supplemental material carries a non-exclusive license, and permission requests for re-use of supplemental material or any part of supplemental material shall be sent directly to the copyright owner as specified in the copyright notice associated with the article.