
Abstract
In cranial flat bone fractures, spontaneous bone repair will occur only when the fracture ends are in close contact. However, in cases wherein bone discontinuity is extensive, surgical interventions are often required. To this end, autologous bone is harvested and surgically integrated into the site of fracture. Here we propose to use cartilage, as an alternative autologous source, to promote cranial fracture repair. The advantage of this approach is the potential reduction in donor site morbidity, likely due to the avascular and aneural nature of cartilage. As a first step we attempted to induce cartilage mineralization in vitro, using micromass primary chondrocyte cultures, incubated with BMP2 and/or WISP1, which were examined histologically following a 3-week culture period. Next, chondrocyte seeded collagen scaffolds were evaluated in vitro for expression profiles and ALP activity. Finally, chondrocyte-seeded collagen scaffolds were implanted in a Lewis rats 8 mm critical calvaria defect model, which was imaged via live CT for 12 weeks until sacrifice. End points were analyzed for microCT, histology, and serum levels of bone related markers. Micromass cultures exhibited an osseous inducing trend following WISP1 administration, which was maintained in chondrocyte seeded scaffolds. Accordingly, in vivo analysis was carried out to assess the impact of WISP1-pretreated chondrocytes (WCS) versus untreated chondrocytes (UCS) in calvaria defect model and compared to untreated control comprised of a defect-associated blood clot (BC) or empty collagen scaffold (CS) implant. Live CT and microCT exhibited higher mineralization volumes in critical defect implanted with UCS, with some structural improvements in WCS. Histological analysis exhibited higher anabolic bone formation in WCS and trabecular bone was detected in WCS and UCS groups. Chondrocytes implanted into critical cranial defect expedite the formation of native-like osseous tissue, especially after WISP1 priming in culture. Ultimately, these data support the use of autologous chondrocytes to repair critical maxillofacial defects.
Introduction
Critical bone defects derived from trauma are a highly prevalent and pose serious clinical burden. In cases wherein, trauma and bone discontinuity are extensive, reconstructive surgical interventions are often carried out to regain bone continuity. The gold standard for reconstructive procedures often consists of an autologous bone graft, which is harvested from a donor site (ideally from the Iliac crest) and surgically integrated to the bone defect site. 1 One disadvantage of this procedure is the risk for donor site morbidity following autologous bone grafting, commonly resulting in pain and numbness of the site. 2 Implant site morbidity may occur if the graft micro-vessels are not surgically sutured to supply blood to the graft. As such, alternative approaches have been employed to regain bone volume in the defect site. One such approach, utilized a custom-made titanium printed device, filled with bone regenerative materials as collagen-based bone substitutes, growth factors, and scraped autologous bone cells from the defect stump. 3 While this approach effectively regenerates bone within 12 weeks, 3 the titanium component often causes mucosal damage to the oral cavity, leading to deficient angiogenesis, increased bone resorption and infection. Such complications could ultimately result in unsatisfactory functional and esthetic outcomes. Therefore, there is an unmet clinical need to develop advanced cell-based strategies for regenerating bone in sites of extensive craniofacial trauma.
In attempt to address this clinical need for bone substitutes or cell sources to support bone regeneration, other cell sources have been examined. One of the most sought-after cell sources for this purpose are mesenchymal stem cells (MSCs), which possess proliferative capacity, while also potentially capable of lineage-specific differentiation, under controlled culture conditions.4 –7 One of the advantages of MSCs, is that they may be obtained autologically via bone-marrow aspiration, versus other stem cell sources (i.e. embryonic stem cells). Accordingly, a great body of work in the past years has focused on the possibility of driving MSCs differentiation toward generation of osteogenic cells for bone repair. 6 Despite these efforts, it remains challenging to use bone marrow derived stem cells for bone regeneration, partly due to the lack of specific osteogenic sub-populations. Moreover, even after their isolation, MSCs quickly loose osteogenic potential upon propagation in culture, 7 hence less likely to differentiate thereafter. While stem cell cultures may be advantageous for various applications, their use confers limitations and may incur significant costs.
Contrarily, using chondrocytes for this purpose has not been sufficiently studied. As a tissue source, cartilage is advantageous over bone given its avascular and aneural nature. Moreover, in several anatomical sites as the ears and nasal septum, cartilage can be obtained with little damage to connective tissues and muscles. Unlike MSCs, chondrocytes are a relatively uniform population, easy to propagate and capable of producing higher levels of ECM with better mechanical properties. 8 Physiologically, chondrocytes are capable of undergoing hypertrophy and mineralization during skeletal growth,9,10 to support appendicular long bone extension. Moreover, adult chondrocytes may mineralize under various pathological conditions (i.e. intervertebral disk degeneration, osteoarthritis, chondrocalcinosis, long bone fracture repair),11 –14 indicating that this cell source is capable of producing calcified matrix under controlled conditions.
Unlike flat cranial bone, long bone repair requires a series of processes that are dependent on cartilage callus formation, which then mineralizes. 13 Consequently, mineralized cartilage is resorbed by osteoclasts and remodeled into lamellar bone, bridging the defect. 14 , 15 Alternatively, in fracture repair of flat cranial bones this process of “endochondral”-mediated healing does not exist, often leading to above indicated surgical interventions.15 –17 We therefore explore the potential utility of chondrocytes to treat maxillofacial defects. Published work has supported that mineralization may be achieved by stimulation with the osteoinductive growth factors; Bone Morphogenetic Protein-2 (BMP-2) and WNT1-Inducible-Signaling Pathway Protein (WISP-1).18,19 As such, our initial efforts were toward the utility of these growth factors to direct cartilage organoid mineralization in vitro, using osteoarthritis (OA)-derived primary chondrocytes, which bear the capacity to mineralize.11,12 Next, conditions supporting cartilage mineralization in vitro, were assessed in vivo using Lewis rats subjected to a critical calvaria defect model and transplanted with costal embryonic chondrocytes, which are also developmentally capable of undergoing mineralization. 9 Cumulatively, our data herein supports that WISP1 priming encourages cartilage mineralization, which may be applied towards repairing craniofacial defects. Notably, we chose collagen-based scaffolds for in vivo defect model since they are in clinical use, and provide an appropriate three dimensional (3D) scaffold for chondrocytes, implanted in the defect site.
Materials and methods
Human chondrocyte culture
All procedures were performed with Hadassah Medical Center Institutional Review Board approval and in accordance with the Helsinki Declaration ethical principles for medical research involving human subjects (0488-09-HMO). Following obtaining an informed consent from end-stage OA donors, articular cartilage was obtained from the knee joints of OA patients undergoing total knee arthroplasty (total n = 33; 19 female, 14 male, with an overall mean age of 73 years and mean body mass index 29.5 kg/m2). Human chondrocytes were isolated from cartilage and plated as previously described. 20 Cells were plated in 150 mm tissue culture dishes at a concentration of ~1.5 × 10⁶ cells/dish and were grown as a monolayer culture until confluence (passage 0, or P0) with growth media consisting of Dulbecco’s modified Eagle’s medium (DMEM, Sigma-Aldrich, St Louis, MI) containing 10% fetal bovine serum (FBS) and 1% Pen-Strep-Ampho.B Solution (10,000 units/mL Penicillin, 10 mg/mL Streptomycin, 0.025 mg/mL Amphotericin B). Cells were cultured in standard incubation conditions (37°C, 5% CO2) and growth medium was replaced every 3 days. Following confluence, cells trypsinized (0.25% Trypsin-EDTA solution) and passaged to reach passage 1 or 5 (P1/P5). P5 or P1 cells were then cultured in micromass cultures, while P1 chondrocytes were additionally seeded into Zimmer® Collagen Tape (Zimmer Biomet Dental, cat #0100Z), as detailed below. All reagents for cell culture were purchased from Biological Industries (Beit-Haemek Kibutz, Israel), unless otherwise indicated.
Rat critical defect model
Experimental procedures involving Lewis rats were carried out in accordance with NIH Committees for animal use and care (ARAC guidelines) and based on AAALAC (Association for Assessment and Accreditation of Laboratory Animal Care International) guidelines. Hebrew University Institutional Animal Care and Use Committee approved the study protocol (MD-20-16095-4). Rats were grown in 12-h light/dark cycles and received food and water ad libitum. For our proposed critical defect rat model, we will utilize costal chondrocytes derived from E17 embryos. Notably, Lewis rats are genetic inbred, hence recapitulating an autologous mode of transplantation. As part of the procedure the dam was anesthetized and sacrificed at day 17 after pregnancy with 0.02 mg/kg Ketamine and 100 mg/kg xylazine. The embryos were isolated from the placenta and set in fresh PBS containing antibiotics. Each embryo was dissected separately, to expose the ventral portion of the thoracic cage, based on protocol by Gosset et al. 21 Then each thoracic cage was washed and incubated (37°C, 2 h) with a solution of 0.2% collagenase (~1 mL/rib cage; Worthington Biochemical Corp., NJ, USA). The tissues were incubated overnight with 0.05% collagenase solution in complete culture medium. Isolated cells were then filtered and cultured until passage 1, and treated at confluence with 200 ng/mL WISP1 in BioMPM media (Biologic Industries, Beit-Haemek Kibutz, Israel), supplemented with 1% ITS, 50 μg/mL Ascorbic acid and 0.1 mM/L β-glycerophosphate (i.e. “enriched BioMPM” or “eBioMPM”), for 48 h until harvesting the cells for seeding within a Zimmer® Collagen Tape (Zimmer Biomet Dental, cat # 0100Z).
Surgical procedure in Lewis rats
Critical size calvaria defect was employed in 3-month Lewis rat (males) as described by Spicer et al., 22 with slight modifications. Accordingly, rats were subjected to an 8 mm calvaria defect by using an 8 mm dental trephine drill with saline irrigation. Following trauma, the rats were either untreated to form a spontaneous hematoma within the defect site (i.e. blood clot, BC). Alternatively, treated defects were implanted with an empty collagen scaffold (i.e. “CS”; Zimmer® Collagen Tape, Zimmer Biomet Dental, cat #0100Z, 0.92 × 0.3 cm each), or a collagen scaffold seeded with untreated (UCS) or WISP1-pretreated (WCS) chondrocytes. For all rat groups, the periosteum and skin were placed over the defect or implant and secured with 3–4 vicryl stitch. Pain control medication was provided daily by intraperitoneal (IP) administration of 0.01–0.05 mg/kg Buprenorphine, 3 days after surgery. The rats were monitored for weight and activity three times a week for the 12-week duration and sacrificed at 12 weeks post defect.
In vivo live 3D micro-CT scans of the rat skull were acquired at 1, 6, 9, and 12 weeks following skull defect procedure. All scans were acquired using a Siemens Inveon preclinical small-animal PET/CT scanner (Siemens Healthcare®, Knoxville, TN, USA) on isoflurane anesthetized rats. Images were acquired under the following settings: 95 μm pixel size, 360 projections, 300 ms exposure, 80 kVP. Three dimensional reconstructions of the skull images were evaluated using Inveon Research Workplace software, to determine mineral content in a set area encompassing the defect, during the 12-week procedure.
Generation of chondrocyte micromass or chondrocyte-seeded scaffolds
Isolated chondrocytes (i.e. 0.5 × 10⁶ P1 or P5) were centrifuged at 1500 rpm, 5 min in round bottom 96-well plates to allow micromass formation. Micromass were maintained for 48 h in DMEM growth media (Biological Industries, Israel) supplemented with 1% Insulin-transferrin-selenium (ITS), 50 μg/mL Ascorbic acid and 0.1 mM/L β-glycerophosphate (i.e. enriched DMEM or “eDMEM”), to allow micromass formation. After pellets were formed, eDMEM was replaced with eBioMPM, composed of BioMPM media (Biological Industries, Israel) supplemented with 1% Insulin-transferrin-selenium (ITS), 50 μg/mL Ascorbic acid, and 0.1 mM/L β-glycerophosphate. For osteogenic induction of the micromass cultures, eBioMPM was further supplemented with growth factors (50 or 100 ng/mL BMP2, and/or 100 or 200 ng/mL WISP1, Peprotech Asia, Rehovot Israel). The micromass were maintained within eBioMPM with or without osteogenic growth factors, for a 3 week culture period until analysis.
Alternatively, collagen scaffold (Zimmer© collagen Tape, 0.5 cm × 0.3 cm each) were submersed for 3 h in 10 mL DMEM growth media (37°C). The soaked scaffolds were transferred to a dry 96-well plate and chondrocytes (1 × 10⁶ in 20 μL eDMEM) were seeded on top of the scaffold for 1 h, 37°C, to enable cell penetration. Next, 150 μL of eDMEM was added to each well for 24 h. Scaffolds were then transferred to a 48-well plate with eBioMPM growth media and osteogenic factors for a 3 week duration or for 48 h until transplanted in vivo within the defect. For both micromass cultures and chondrocyte seeded scaffolds, eBioMPM growth media was replaced three times a week for the duration of experiment.
Characterization of micromass cultures or chondrocyte-seeded scaffolds
Micromass cultures were characterized to determine hypertrophy (i.e. increased size and cellular protein level) or proliferation (i.e. increased DNA content per protein). To this end, we assessed DNA and protein content from micromass cultures using TRIzol reagent (Ambion, life technologies), in accordance to manufacturer’s guidelines. The purified DNA was measured via NanoDrop (Thermo Fisher Scientific, USA), while protein was measured via Bradford reagent (595 nm wavelength in spectrophotometer). The measured DNA (ng/μL) was normalized to their respective protein concentrations (mg/mL) and presented as a ratio. Micromass size was additionally measured using a scale (mm) and microscope visualization (Olympus SZ61 Stereo Microscope).
Cell entrapment of chondrocyte seeded scaffolds were monitored following 3-week culture using DNA quantification, compared to a DNA standard curve. DNA was purified from cell-seeded scaffolds or from quantified isolated cells using DNA purification kit (Quick-DNA/RNA Microprep Plus Kit, ZYMO Research). DNA derived from scaffolds was normalized to DNA measurements from chondrocytes standard curve ranging from 30,000 cells to 1 × 10⁶ cells.
Quantitative polymer chain reaction (qPCR) analysis
RNA isolation from chondrocytes was carried out with Direct-zol RNA MicroPrep kit (ZYMO Research), according to the manufacturer’s guidelines. Subsequently, cDNA was prepared using iScript cDNA Synthesis Kit (Bio-Rad, CA, USA) or High Capacity cDNA Reverse Transcription Kit (Applied Biosystems), according to manufacturer’s guidelines in a standard PCR machine (ABI Veriti, CA, USA). Amplification of genes was next carried out from cDNA (i.e. 5 ng micromass cultures, or 20 ng from cell seeded scaffolds), using Syber Green reaction mix (Bio-Rad, CA, USA), set to amplify in a sealed 96-well plate, within a Bio-Rad CFX96 Touch qPCR or CFX Connect qPCR machine. All values were normalized to GAPDH (internal control) and to the ΔCT of untreated controls. Primer sets are detailed in SD1 (Table 1).
Histology and image quantification for micromass cultures
Following 3-week culture, pellets were subjected to 1 h of tissue fixation in 4% formaldehyde and were kept in 4°C in PBS. Next, pellets were dehydrated using a graded series of ethanol washes and xylene embedded in paraffin for sectioned to 7-μm sections which were transferred to charged glass slides and set overnight in a 37°C oven. Sections were deparaffinized and stained with 0.5% Alizarin Red (red staining for calcium mineral deposition; Sigma, cat# A5533) or 1% Alcian Blue in 3% acetic acid solution, pH 2.5 (blue staining for aminoglycan deposition; Sigma, cat# B8438). Briefly, Alizarin Red staining was performed with 1% Alizarin Red for 3 min (RT) followed by dipping the slides 20 times in 100% acetone and 20 times in 1:1 acetone:xylene solution. Sections were then washed in 100% xylene and mounted (Entellan glue; Merck, 1.07961.0100). Alcian Blue staining was carried out by submersing the sections in 1% Alcian Blue solution for 30 min at RT. Next, sections were washed in DDW for 2 min, dehydrated and mounted as indicted.
Von Kossa staining was employed to detect tissue calcification as it recognizes the calcium crystal or calcium phosphate mineral. Von Kossa Staining was carried using a kit (Silver plating kit acc. to von Kossa, Merck, 1.00362.0001), according to manufacturer’s guidelines. Briefly, the sections were submersed in silver nitrate solution under exposure to UV for 30 min, washed and covered by sodium thiosulfate solution for 5 min. The sections were counterstained with 0.1% nuclear fast red-aluminum sulfate solution for 3 min, dehydrated with graded series of ethanol washes, prior to mounting. All images were captured via light microscope (Eclipse Ci, Nikon). Image quantification was carried out using two methods; MATLAB based method or Image J based method. For Alcian blue quantification, black and white images were uploaded to MATLAB—image processing tools, and the various areas of intensity were converted to an RGB scale ranging from white (RGB of 255), to black (RGB of 0). Accordingly, lower RGB value indicated more color intensity. The average RGB values were then converted to values in the range of 0–1 where 1 indicates high intensity, using the formula:

Alizarin Red and Von Kossa staining, were quantified via image J analysis. Particularly, the area of mineralization per total micromass section area was defined via Image J software in a µm scale, and an Image J macro language was utilized to analyze stitched images in a batch mode. Analyzed parameters included the number of mineralizing nodules and cumulative area using software automatic selection, determined above a given intensity threshold (i.e. for Alizarin Red: 85 threshold, for Von Kossa: 70 threshold). The mineral nodule number and area were normalized to each micromass pellet area, using manual tracing in Image J software. After excluding outliers, results were normalizing to untreated cultures or presented by their absolute numbers, as detailed in the figure legends.
Immunofluorescent of micromass cultures
For immunofluorescence, sections were deparaffinized and rehydrated with xylene and graded ethanol solutions, incubated for 1 h with blocking solution (0.1% BSA, 1:10 FBS and 1:50 Triton ×100 in PBS) room temperature (RT). Sections were incubated with Rabbit polyclonal to β-Catenin (1:400, Abcam, UK cat#ab6302, in blocking solution Containing 0.1% bovine serum albumin and 1:50 Triton x100 in PBS), overnight at 4°C. The following day, sections were incubated with Texas Red anti-rabbit antibody (1:150 in blocking solution, #TI-1000, US, CA Vector laboratories) for 2 h at RT. Finally, sections were incubated with DAPI (final 5 ng/μL in DDW) for 10 min at RT, following four washes with PBS and mounting (Hydromount, Electron Microscopy Science, PA, US). Sections were visualized under a Ti-Eclipse Nikon system with an Andor Zyla nsc05537 camera (Japan, Nikon). Captured depictions at ×40 magnification, were analyzed using NIS-elements-BR DS-Qi2 software (Japan, Nikon) to monitor purple fluorescent readouts, representing co-appearance of β-catenin stained cells (red fluorescence; threshold range 660–16,000) with DAPI stained nuclei (blue fluorescence; threshold range 6000–16,000), compared to total nuclei within a given area (i.e. % co-appearance/total nuclei).
Alkaline phosphatase (ALP) activity
Following 3-week culture, the cell-scaffolds were stored in lysis buffer from the ALP activity assay kit (Abcam, UK, cat# ab83371) and frozen at −80°C until analysis. Prior to analysis, cell scaffolds underwent three freeze-thaw cycles in liquid nitrogen followed by centrifugation (13,000g, 3 min, 4°C). Supernatants were collected for alkaline phosphatase (ALP) activity, according to manufacturer’s guidelines manual. A standard curve was generated with 4-methylumbelliferyl phosphate (MUP; concentration range 0–0.5 nmol/well) substrate in assay buffer incubated with recombinant ALP enzyme (30 min, RT, dark). ALP activity per sample was drawn from the standard curve and each sample was then normalized to the respective protein content, measured via Bradford Reagent.
Micro-computed tomography (μCT)
To assess high resolution bone structures within the defect, we carried out microCT analysis after sacrificing the rats 12 weeks after the surgical procedure. Calvaria were fixed in 4% paraformaldehyde solution for 72 h and subsequently stored in 70% EtOH for μCT assessment (μCT 40 Scanco-medical, 70 kV, 115 μA). Scans were reconstructed using Dragonfly software (ORS, Montreal, Canada). The area of interest was selected (i.e. defected area; 8 mm diameter 3D spherical shaped) and compared to an intact native area of the same calvaria. 3D analysis was assessed to quantify: Bone Volume, Bone volume fraction (i.e. Bone Volume/Total Volume; %BV/TV), endocortical perimeter, endocortical surface, periosteal perimeter, periosteal surface, average trabecular separation, average trabecular thickness, average cortical area, and average cortical thickness, using the Dragonfly software tool Wizard Bone Analysis.
Histological processing and analysis of rat calvaria at 12 week endpoints
Histological evaluations of the defect site were carried out to elucidate any unwanted host response (i.e. inflammatory or fibrotic response) using a histopathological grading method carried out by AnaPath Services GmbH (Liestal, Switzerland). Additional histology was carried out to profile bone repair response using a histopathological grading system, as well as computational assessment of the unmineralized distance between fracture edges. To this end, rat calvaria were collected and fixed in 4% paraformaldehyde (PFA) for 72 h, then placed in 70% ethanol and changed to 4% PFA, until shipment for histological evaluation. Fixation, storage, and transport were conducted in a light shielded environment. The implantation sites from all the animals were processed by methyl methacrylate (MMA) resin embedding, sawed by a diamond band saw in a coronal direction at the center of the defect (EXAKT System), ground and polished to a final thickness of approximately 40–60 µm (EXAKT System) according to AnaPath Services GmbH SOP’s. The sections were stained for Paragon staining (toluidine blue and basic fuchsine, AnaPath proprietary staining) or captured unstained for fluorescence imaging (Olympus VS200 Slide scanner, with a VS-304 M camera; 20× magnification). Paragon staining detects ranges of mineralized tissue in shades of pink depending on degree of mineralization, wherein less mineralized tissue will appear darker than mature bone. Non-mineralized osteoid will stain blue with Paragon staining.
Histopathology scoring was carried out by a pathologist according to a semi-quantitative histopathology scoring method based on the adapted ISO 10993-6 scoring (SD2). Briefly, using the ISO 10993-6:2016(E) method; a score difference between 0.0 and 2.9 is considered no or minimal host reaction, 3.0 and 8.9 slight host reaction, 9.0 and 15.0 moderate host reaction, and ⩾15.1 severe host reaction compared to a reference material. Scoring was adapted to reflect less central sectioning of the defect wherein the defect distance is reduced. Illustrative example pictures were taken by an Olympus BX46 camera. All scoring results of five calvaria per experimental group, are presented in Table 1 and 2 of SD3.
Bone phenotyping included the measurement of “unmineralized distance” between the defect edges, which was determined as the total distance of unmineralized tissue (i.e. unstained tissue) subtracted by mineralized tissue (i.e. stained tissue, including bone islands) at the gap between the edges of the defect.
To monitor the distance between newly formed bone, we assessed Mineral Apposition distance (MAD), which was marked using two fluorescent dyes administered 4 weeks apart during the rat calvaria defect model; Alizarin-complexon and Calcein Green. To assess bone formation in the defect, 2 weeks after the defect was induced, we administered subcutaneously (SC) 25 mg/kg Alizarin-complexon (red florescence in newly formed bone; cat# A3882, Sigma Aldrich), followed by a second SC administration of 25 mg/kg Calcein Green or Calcein (green florescence in new deposited bone; cat# C0875, Sigma Aldrich) at 6 weeks post-operative stage. Therefore, the distance between the red and green fluorescence denotes newly formed bone sites generated within 4 weeks. Images were capture of the left defect edge, which was analyzed in three separate compartments for μm distance between the fluorescent dyes; (i) Native bone (i.e. intact calvaria bone, at least 3 mm distance from defect edge); (ii) Edge of defect (i.e. the interface between the intact bone and the defect); and (iii) Defect area (Mineral tissue islands within the defect site). Each zone was captures at ×20 followed by ×4 magnification and triplicates of measurements were carried out per area (Figure 8(a); zones i–iii). Triplicate zonal measurements (i.e. zone i, ii, iii) were averaged and plotted for analysis.
Serum analysis of bone turnover markers
Rat serum was collected at end-point, diluted 1:10 and serum levels of Cross Linked C-telopeptide of type I collagen (CTX-1, cat# E-EL-R1456, Elabscience) and Procollagen type I N-Terminal Propeptide (PINP, cat# MBS2506450, MyBioSource) measured via ELISA kits, in accordance to manufactures protocol.
Statistical analysis
Each experiment was repeated at least three times (n ≥ 3) and the average and standard deviation calculated per group. Outliers were excluded using GraphPad Prism statistics according to Grubb’s test. All the data were analyzed for non-parametric Kruskal-Wallis and post-hoc Dunn’s test to assess statistical significance within a group of treatments, assuming a p < 0.05. After confirming significance of Kruskal-Wallis test, we employed Mann-Whitney or Wilcoxon test to assess statistical significance between particular treatments and untreated controls. Pearson correlation was carried out assuming a confidence level greater than 95% (p < 0.05), to be significant. Notably, Pearson’s correlation (r) that is closer to 1 indicates a good fit to linear regression, while values closer to 0 indicate weak fit to linear regression. Regression (r2) indicates the variation around the linear regression line.
Results
WISP1-treated micromass cultures displayed trends of reduced cartilage staining and enhanced mineralization
As a first step, we aimed to assess the ability of OA-derived adult chondrocytes, to undergo in vitro mineralization. Isolated OA-derived human chondrocytes were passaged to P1 and used for micromass cultures and treated as seen in Figure 1(a). Following treatment, DNA versus Protein content per treatment were compared, assuming that the altered ratio would indicate proliferation or hypertrophy within the micromass cultures. The result presented in Figure 1(b) and (c), exhibit unchanged DNA/protein ratio and micromass size compared to control, respectively.

Osteogenic and chondrogenic gene expression for P1 micromass chondrocytes. The scheme in panel (a) exhibits the treatments carried out for P1 pellet cultures (i.e. seven treatments) and the analysis following 3-week of culture (DNA/Protein ratio, and pellet size assessment). (b) DNA/Protein quantification for 1–7 treatments (legend, (a) far right); (c) Pellet size for 1–7 treatments following 3-week culture. Values were normalized to untreated controls. Kruskal-Wallis and post-hoc and Mann-Whitney did not exhibit statistical significance between control and the different treatments.
Next, micromass cultures were subjected to histology and stained with Alcian Blue to detect cartilage proteoglycans (Figure 2(a) upper panel) via MATLAB software (Figure 2(b), left graph). Results show a significant reduction in staining intensity for the 200 ng/mL WISP1 treatment (treatment #5), indicating potential loss of capacity to synthesize cartilaginous proteoglycans. Similarly, assessing Alizarin Red staining displayed an increased trend for area of mineral granules per total micromass area, for the 200 ng/mL WISP1 (treatment #5) or 100 ng/mL BMP2 (treatment #3) treatment, compared to untreated micromass cultures (Figure 2(b)). Von Kossa histological analysis was employed to detect calcium-bound crystals or calcium phosphate minerals in micromass cultures (brown staining, Figure 2(a), lower panel). Using this staining method, 50 ng/mL BMP2 (treatment #2) and 50 ng/mL BMP2 with 100 ng/mL WISP1 (treatment #6), exhibited significantly lower mineralization versus controls. However, higher trends for mineralization areas were observed for 200 ng/mL WISP1 or 100 ng/mL BMP2, compared to controls (Figure 2(b), right graph). Overall, the data support that high doses of BMP2 and/or WISP1 may promote cartilage mineralization.
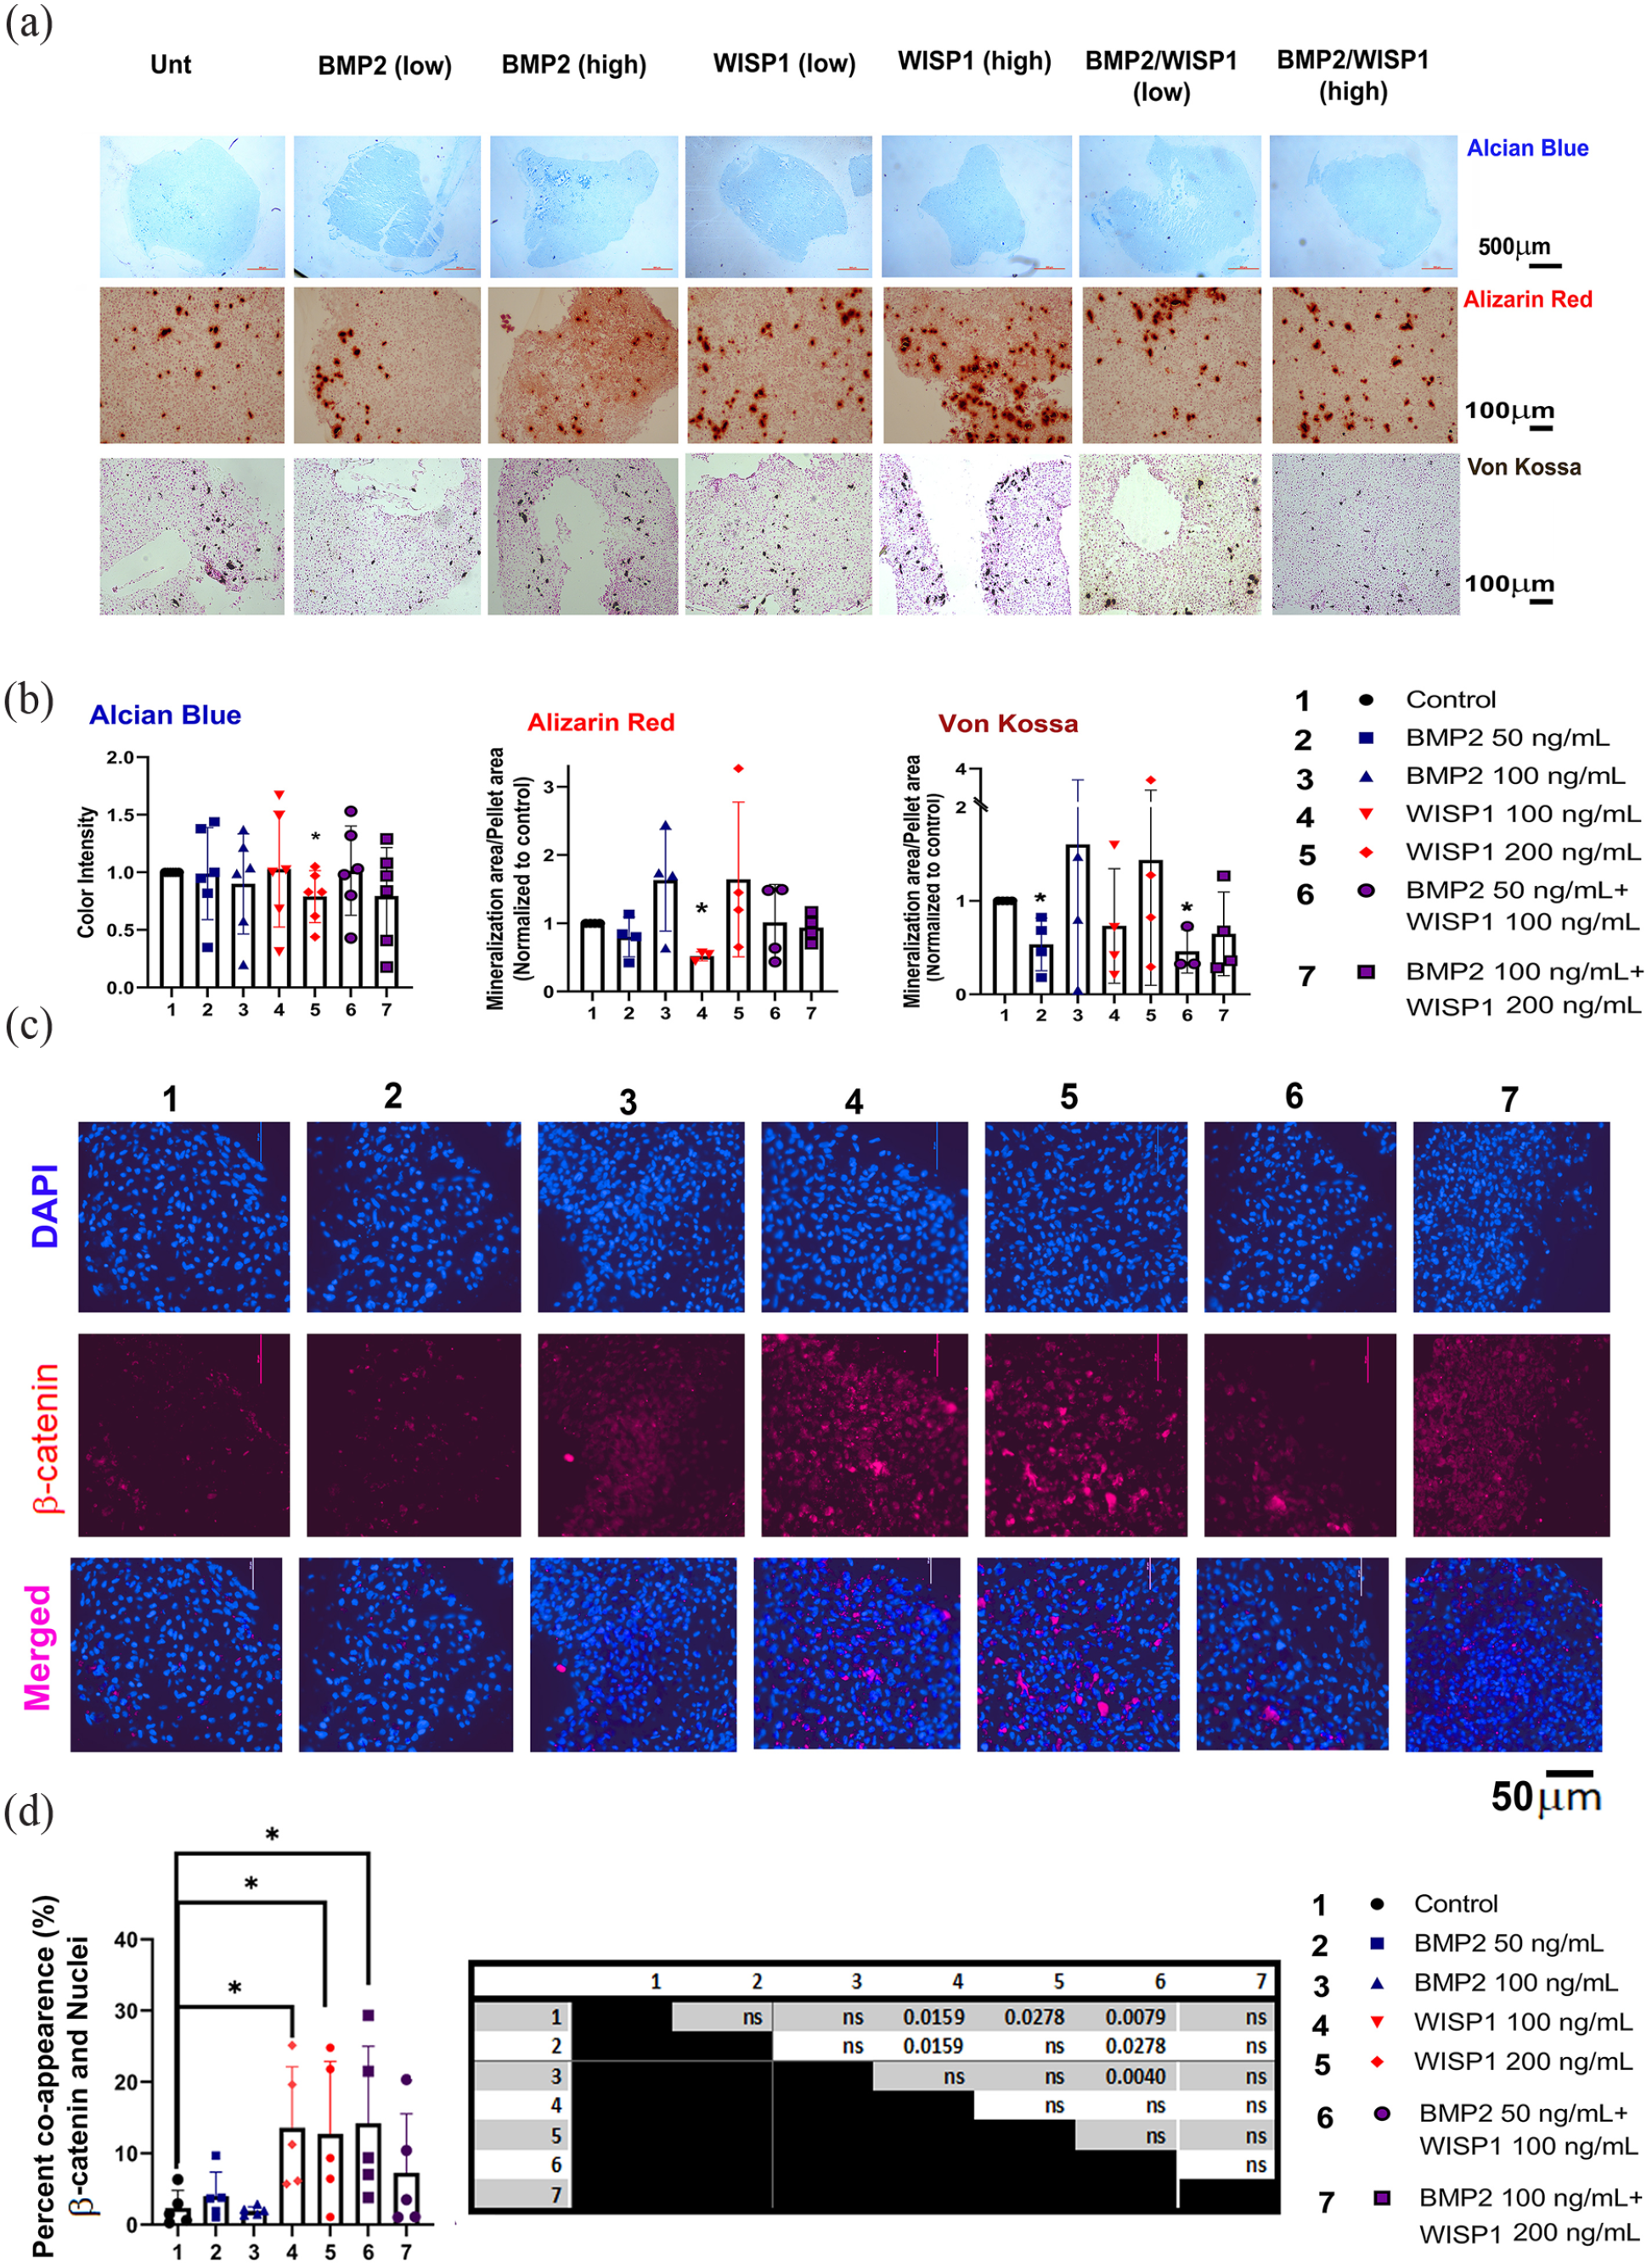
Histological analysis of micromass cultures of P1 chondrocytes. Chondrocyte micromass cultures at P1 were sectioned and stained for Alcian Blue after 3 weeks of culture under treatments indicated in Materials and Methods section. (a) Representative images of stained 7 μm sections; Upper row is Alcian Blue staining (n = 6, 4× magnification); middle row is Alizarin Red staining (n = 6; 10× magnification) and lower row is Von Kossa staining (n ⩾ 3; 10× magnification). (b) Intensity quantification was assessed via MATLAB method for Alcian Blue sections, as indicated in the Materials and Methods section. The graph depicts an averaged RGB per area. Alizarin Red and Von Kossa were assessed via imageJ method, as indicated in the Materials and Methods section. Mineralized matrix in Alizarin red appears as red speckles, while Von Kossa staining appears as brown speckles in a pink background (Nuclear fast red). The graph depicts an average of mineral granule area per micromass area, normalized to the values of the untreated control. Mann-Whitney test displayed a significant difference for 200 ng/mL WISP1 compared to untreated control, at p < 0.05, (n = 6), denoted by an asterisk (*). (c) Micromass sections were stained for β-catenin (red florescence) and cell nuclei (DAPI, blue florescence) for all seven treatments (n = 5, two replicates per donor) and captured at ×40 magnification. (d) Red and blue co-appearance was calculated per total nuclei within a given area. To determine significance, we employed Kruskal-Wallis test, and Mann-Whitney tests between treatment pairs (left table). The graph depicts statistical difference between the treatment’s versus untreated control, at p < 0.05 (denoted by an asterisk “*”).
In attempt to enhance chondrocyte propagation, we proceeded to passage the cells to reach P5 and generate micromass cultures. Histological evaluation of P5 micromass treated with the growth factors (SD4A), did not display changes in Alcian Blue intensity (SD4B). Alizarin Red staining did not display mineral granules using image J quantification method (SD4C and D). Interestingly, comparing P1 versus P5 mineral content per micromass area, displayed significantly higher values for P1 versus P5 in all treatment groups (SD4D). We therefore reverted to the MATLAB method to assess the subtle differences in red coloration intensity for P5 micromass cultures (SD4E). Accordingly, P5 micromass cultures exhibited significantly reduced intensity for Alizarin Red compared to untreated micromass cultures. Cumulatively, the data show that P5 chondrocytes are less likely to undergo mineralization and hypertrophy versus P1 chondrocytes.
To further assess if WISP1 induced intracellular WNT/β-catenin pathway, we monitored micromass sections stained fluorescently for β-catenin and their co-appearance in nuclei, indicated an activated WNT pathway (Figure 2(c), representative images). Quantification of co-appearance exhibited that WISP1 treatment induced β-catenin in cell nuclei versus untreated controls (Figure 2(d)). Expectedly, BMP2 treatments exhibited similar β-catenin nuclear co-appeared as untreated controls. Interestingly, this increased co-appearance trend was evident in the combined low concentration WISP1/BMP2 cotreatment, possibly due to rate-limiting contribution of WISP1 to β-catenin nuclear translocation.
WISP1 treated chondrocyte-seeded collagen scaffolds preserve osteogenic patterns
P1 chondrocytes were seeded into collagen scaffolds (1 × 10⁶ cells per 5 mm3scaffold) and incubated for 3 weeks with 100 ng/mL BMP2, 200 ng/mL WISP1 or both, as portrayed in scheme of Figure 3(a). Next, cell entrapment was measured in vitro cell-seeded collagen scaffolds (Figure 3(b)). Results show that approximately ~70% of the cells did not enter the scaffold at 24 h post-seeding, possibly given the scaffold pore structure. Following 3 weeks of culture, an additional 15% loss of cells was determined for all treatments (Figure 3(b)), indicating that the treatments did not affect cell leakage during the 3-week culture duration. As such, we concluded that considerable cell leakage occurs at seeding, yet thereafter most of the entrapped cells remained in the scaffold for the 3-week culture duration (approx. ~85% of the cells entrapped after seeding). Accordingly, the scaffold can hold approximately 20% of the initial seeding amount (i.e. 200,000 cells per 5 mm3 scaffold volume).
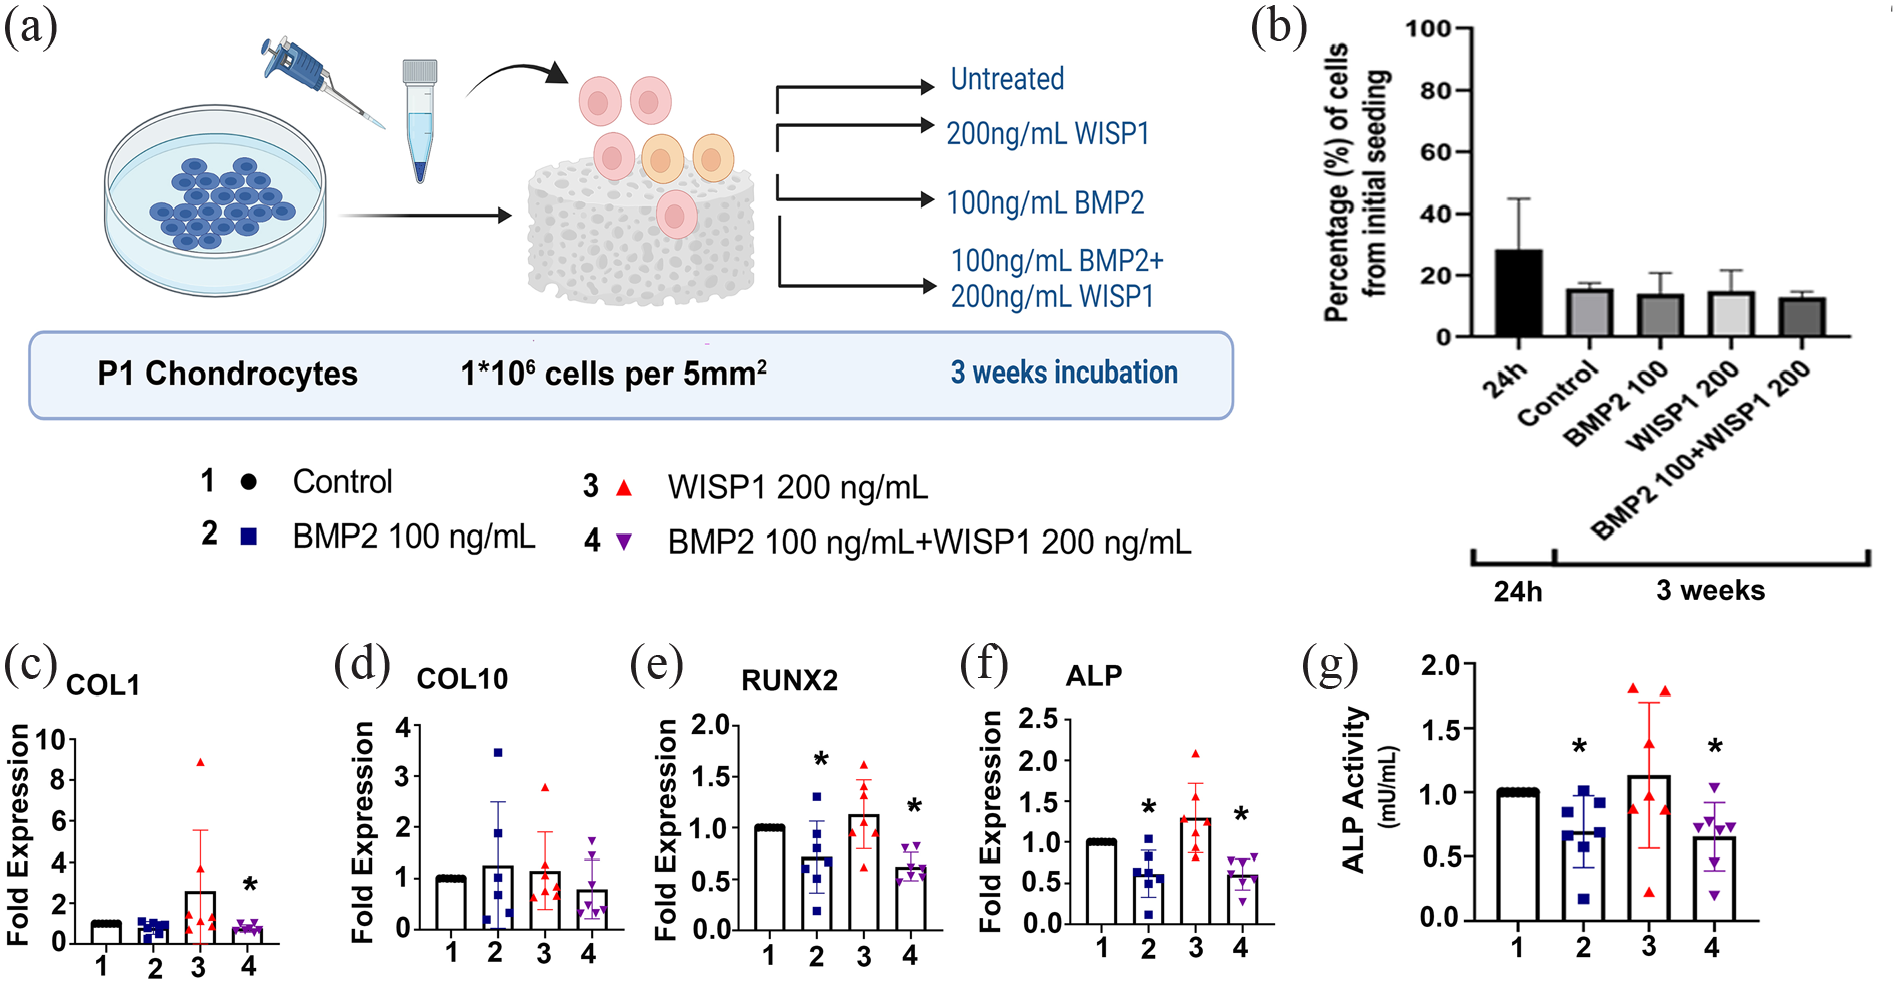
Osteogenic and chondrogenic gene expression for 3-week cultured scaffold-seeded chondrocytes. P1 chondrocytes seeded to collagen scaffolds and cultured for 3 weeks, as indicated in the Materials and Methods; n = 7 (a). (b) Quantification of percent chondrocyte entrapment compared to the initially seeded cell numbers. RT-qPCR was carried out for (c) COL1; (d) COL10; (e) RUNX2; (f) ALP; (n = 7). Statistical significance according to Mann-Whitney test is denoted with one asterisk (*) for p < 0.05. ALP activity in cell seeded scaffolds cultured for 3 weeks (g). Values are normalized to untreated control after calculating ALP activity/mg protein per treatment. Statistical significance according to Mann-Whitney test is denoted with an asterisk (*) for p < 0.05 above the relevant bar.
Assessing 3-week post culture PCR expression revealed significant reduction in COL1 expression for BMP2/WISP1 (treatment #4; Figure 3(c)), while COL10 expression remained unchanged in all treatments (Figure 3(d)), and osteogenic the genes RUNX2, ALP were reduced (Figure 3(e) and (f)) in BMP2 (treatment #2) and BMP2/WISP1 (treatment #4), compared to untreated controls. On the other hand, WISP1 alone exhibited an increased trend for the expression of COL1, RUNX2, and ALP (Figure 3(c), (e), and (f), respectively), which may indicate more osteogenic patterns following WISP1 treatment. In agreement with the PCR data, ALP enzymatic activity showed that BMP2 or combined BMP2/WISP1 displayed a significant reduction in ALP activity compared to untreated controls (Figure 3(g)), while WISP1 exhibited similar ALP activity compared to untreated control.
Cumulatively, the data indicated that BMP2 or its combination with WISP1 did not harbor chondrocyte ossification, while WISP1 exhibited trends similar to untreated chondrocytes. Despite the similarity between untreated controls and WISP1 treated chondrocytes, in some cases WISP1-treated chondrocytes displayed histological trends in support of chondrocyte mineralization, which were yet unexplored for in vivo bone regeneration. Since previous reports support that WISP1 is associated with various cancers,23 –25 we attempted to pre-treat costal chondrocytes with WISP1 (48 h, 200 ng/mL, P1) prior to in vivo transplantation in a cranial defect model, to avoid a potential oncogenic influence of the implant (Figure 4(a)). The pre-treated WISP1 chondrocytes were compared to untreated chondrocytes, both introduced to a collagen scaffold. Empty collagen scaffold or spontaneous formation of blood clot served as controls for repair unrelated to the chondrocytes.
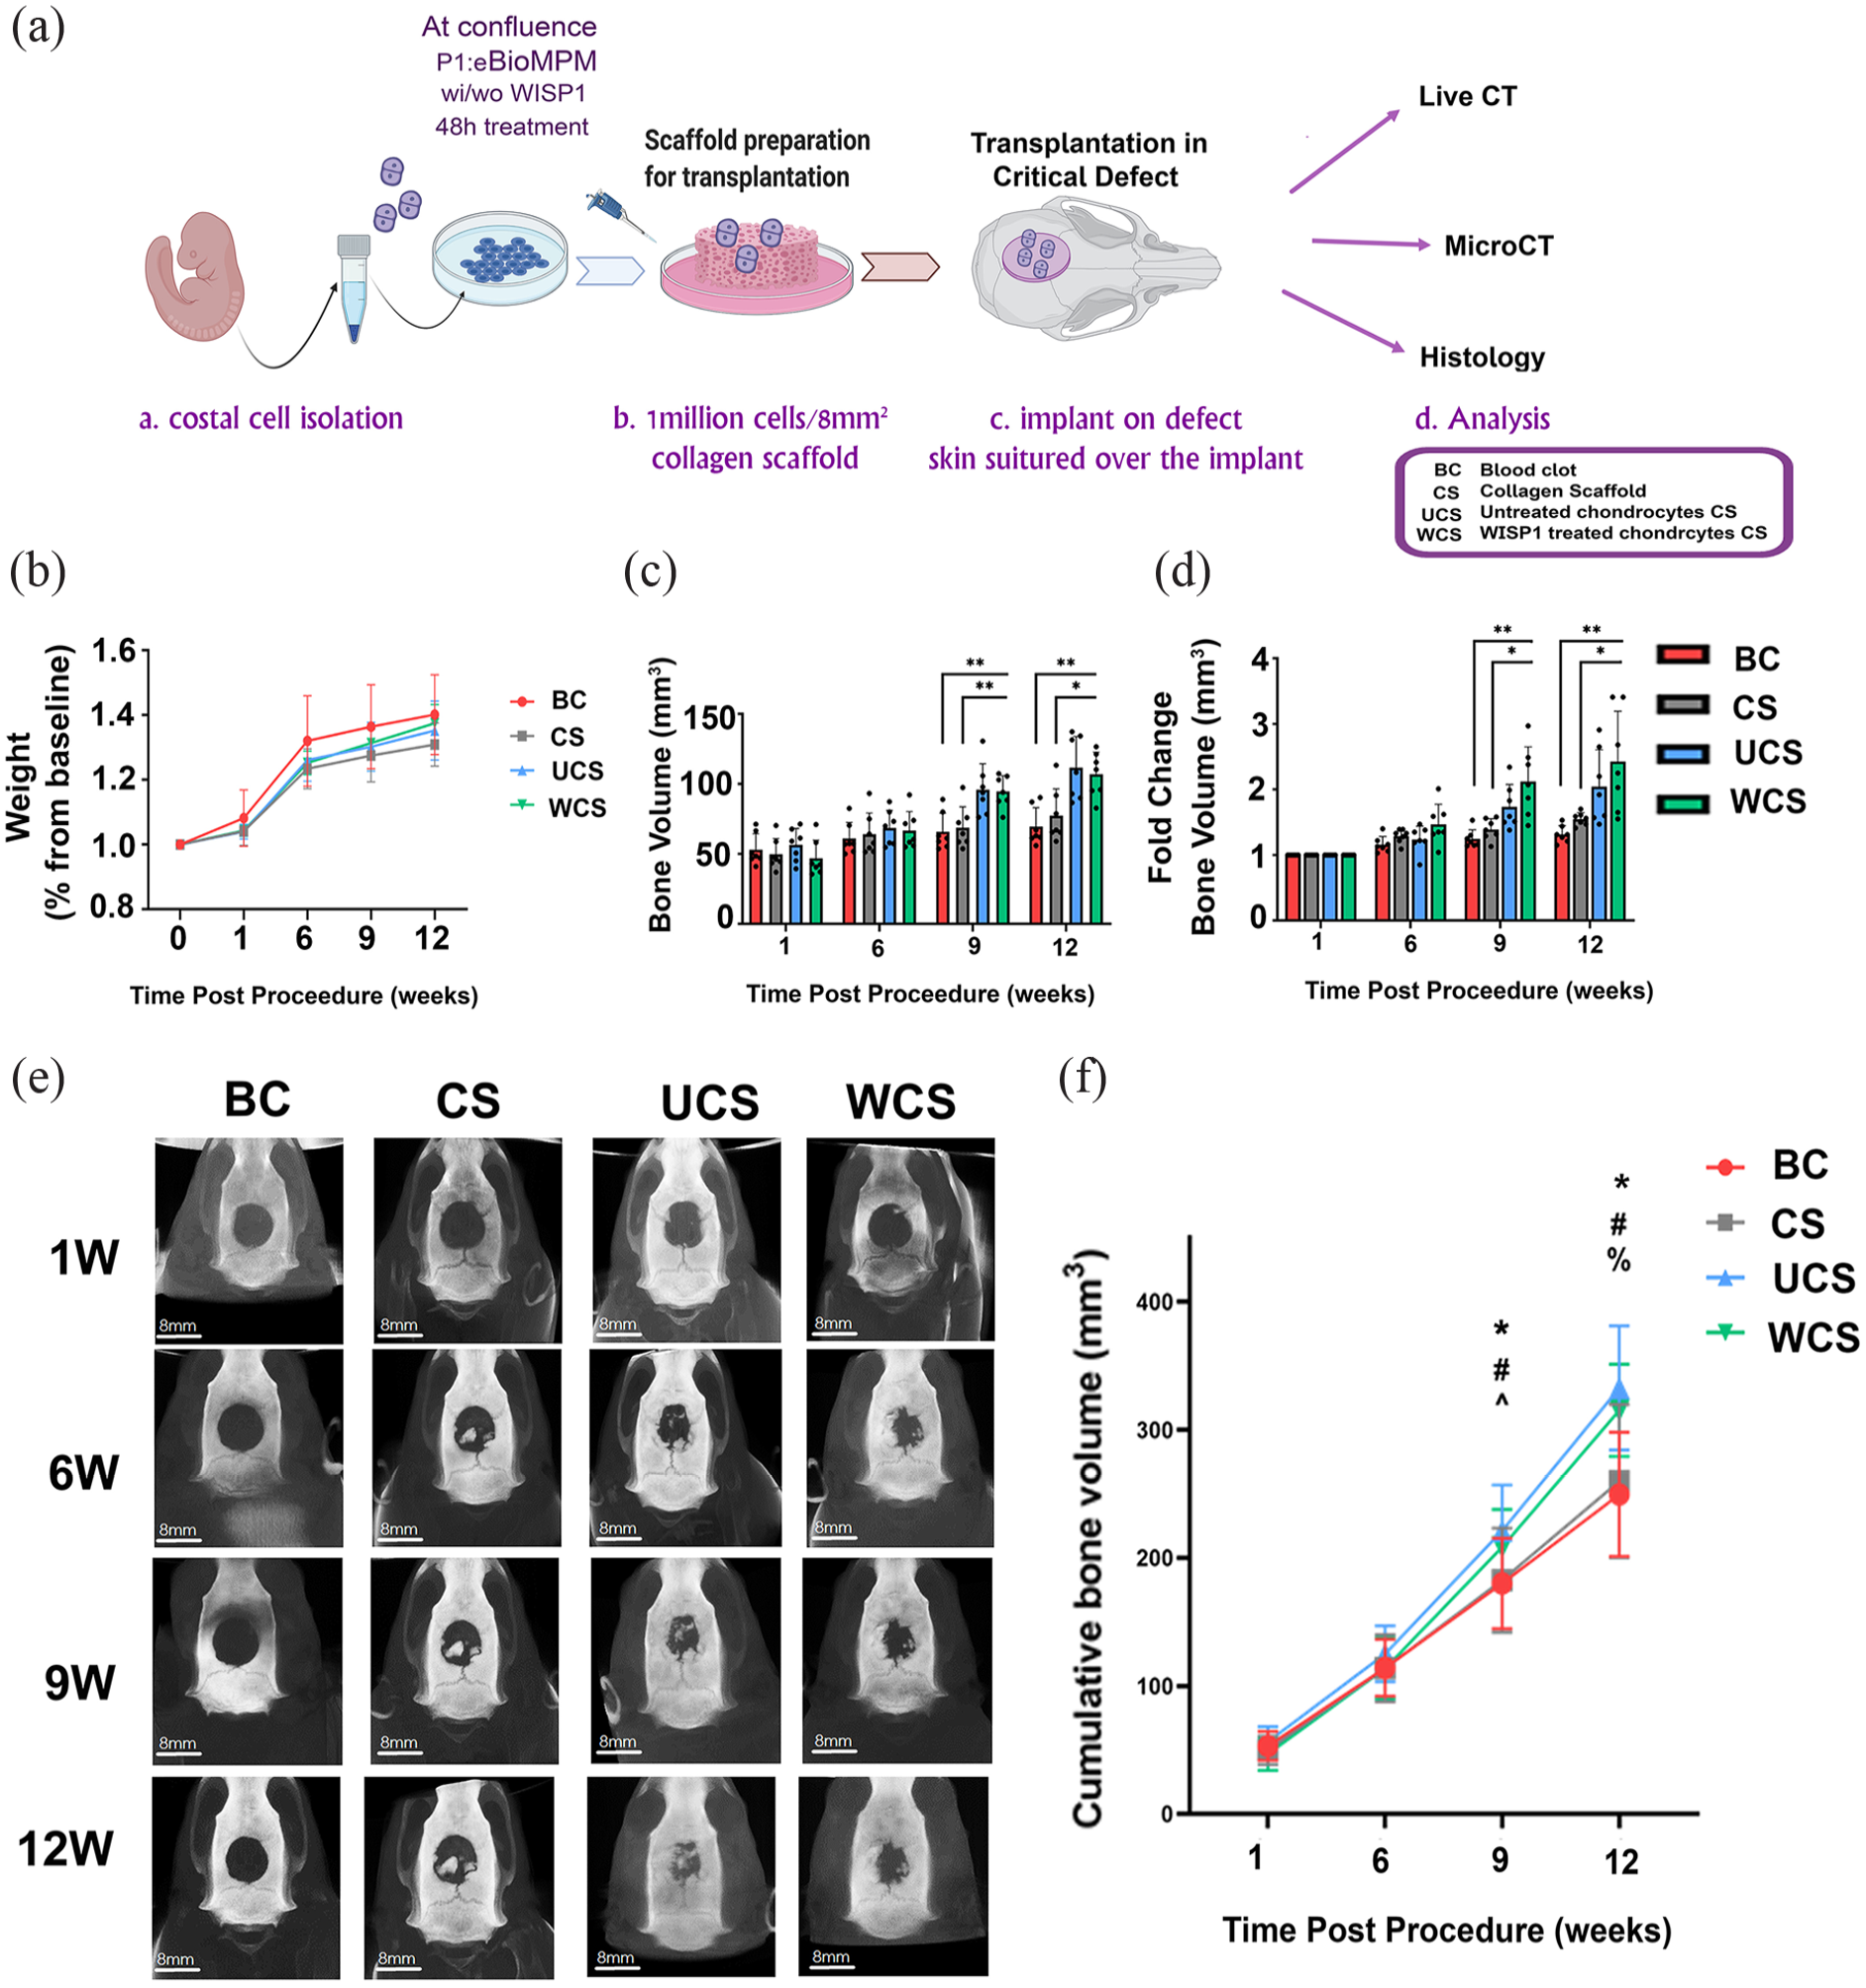
Assessing the effect of chondrocyte seeded collagen scaffold in a critical calvaria defect model. Experimental scheme of method for seeding chondrocytes in collagen scaffold and their transplantation on a defect (a). Percental change from initial body weight of rats during the 12-week experiment (b). Quantification of bone volume (c) and normalized bone volume (d), compared to baseline levels at 1 week after surgery. (e) Representative images of calvaria at all scanned time points. (f) Cumulative bone volume per rat during the 12-week CT scan procedure (*p < 0.05 Blood clot vs WISP1, #p < 0.05 Blood clot vs Unt. Chondrocytes, ^p < 0.05 Scaffold vs Unt. Chondrocytes, %p < 0.05 Scaffold vs WISP1).
In vivo critical defect model exhibited chondrocyte-dependent osseous repair with enhanced microarchitecture in WISP1-primed chondrocyte scaffolds
Here a critical defect rat model was generated and implanted with E17 costal chondrocytes from Lewis embryos (Figure 4(a) scheme). Costal chondrocytes were either untreated or pretreated with WISP1 (P1, 48 h). During the experimental duration, all rats showed similar weight gain at each time point (Figure 4(b)). Live CT of the 3D defect site exhibited a significant 2-fold increase in bone volume at 9 and 12 weeks in the cell containing scaffolds (i.e. UCS and WCS) versus the BC and CS controls (Figure 4(c)), with no significant variation between the WCS and UCS (Figure 4(c) and (d); Figure 4(e), representative images). Cumulative bone volume assessment also confirms a striking increase in bone volume for UCS and WCS, beginning at 9 and 12 weeks, with no variation between the WCS and UCS groups (Figure 4(f)).
Additional analysis for the correlation between accumulated bone volume (mm3) per time, revealed a steady increase in bone formation for all four treatments (SD5A–D), which exhibited higher slopes for UCS and WCS (i.e. SD5C and D), with no significant advantage between UC and WCS for bone volume or fold-change in bone volume over time (SD5E and F, respectively).
To characterize in detail bone microstructural features, we sacrificed the rats at 12-weeks post procedure and carried out microCT analysis (Figure 5(a)) for the defect site (Figure 5(d), green sphere), which were compared to intact (i.e. native) calvial bone from the same subject (Figure 5(d) scheme, purple sphere). The microCT data confirmed bone volume (Figure 5(b)) and %BV/TV (Figure 5(c)) were significantly enhanced in the UCS and WCS treatments. Similarly, UCS and WCS endocortical perimeter and surface appeared to exhibit superior parameters when compared to BC and CS, and in a similar trend to native calvaria bone (Figure 5(e) and (f)). Periosteal perimeter and surface were also improved in the WCS compared to BC (Figure 5(g) and (h), respectively), with no statistical variation between the WCS and the UCS groups. Additional analysis revealed that cortical area and thickness (SD6A and B) were increased in the WCS group, similar to the trends observed for trabecular separation and thickness (SD6C and 6D), compared to BC. Specifically, WCS exhibited significant improvement in bone microstructure parameters (i.e. exhibiting improvments in trabecular thickness, trabecular separation, and cortical area, endocortical/periosteal perimeter, endocortical/periosteal surface), compared to BC, which was to a lesser extent in UCS versus BC groups (i.e. exhibiting improvments in trabecular separation, cortical area, endocortical perimeter, and endocortical surface). Generally, adding untreated chondrocytes (UCS) to collagen scaffold (CS) improved bone volume, BV/TV, endocortical surface/perimeter and average cortical area, supporting that addition of chondrocytes to the collagen implant improves bone related architecture. The pretreatment of chondrocytes WISP1, appeared to further improve microstructural bone features, as judged by microCT analysis, potentially having an effect on bone strength.26 –30

MicroCT analysis exhibits enhance bone architecture in collagen scaffold seeded with chondrocytes. Rats were subjected to experimental procedure as in 5(a) and sacrificed 12 weeks post-operatively. (a) Representative microCT images (b) Bone volume; (c) Bone volume versus Total volume (BV/TV); (d) Schematic image of the calvarial defect analyzed for microCT parameters, as well as the delineated native bone from the same subject, assessed as control. (e) Endocortical perimeter; (f) Endocortical surface; (g) Periosteal perimeter; (h) Periosteal surface. Each graph (e and f) shows native bone parameters and a schematic image of the analyzed parameter.
Histological evaluation of the defect revealed enhanced trabecular bone in chondrocyte seeded scaffolds
Histological analysis monitored the distance of the unmineralized tissue within the defect (Figure 6(a) scheme), by measuring the distance between the edges and subtracting mineralized tissue islands from the total histological distance between fracture edges (Figure 6(b) images and graph). The data show WCS displayed the most statistically significant reduction in defect distance compared to BC and UCS (Figure 6(b)). Host reaction scores (SD3) exhibited average scores to indicate a slight (CS-8.6) to moderate (BC-10.75; UCS-9.2 and WCS-10.0) response. While non-trabecular bone formation did not show a significant trend between the groups (Figure 6(c), left graph), trabecular bone formation in the UCS and WCS exhibited a higher trend versus BC and CS (Figure 6(c), middle graph). Significantly, UCS and WCS islands within the defect site exhibited bone structures that were encasing a medullar-like void, which resembles native trabecular bone structures. Interestingly, WCS exhibited significant increase in collagen scoring, supporting that this group may have displayed more anabolic features (Figure 6(c), right graph). Finally, host response for immune reaction, vascular reaction, and overall host reaction did not display variations amongst the treatments (Figure 6(d)), similar to scores for fibrosis and neovascularization (Figure 6(e), bottom right handed graphs).

WISP1 treated chondrocytes scaffolds exhibit reduced distance and superior anabolic phenotype of the repair defect site. Histology of the defect was assessed via Paragon staining for mid coronal sections (illustration in (a)). (b) Paragon stained slides light pink reflects mineralized matrix, while purple-blue depicts osteoid or unmineralized matrix. The graph to the right is of the unmineralized distance between the defect edges, n = 5. (c) Non-trabecular bone formation score (SD3); Trabecular bone formation score (SD3), exhibiting bone encasing a medullary void; and collagen score for BC, CS, UCS, and WCS groups. (d) Host reaction related to immune cells (left graph); Vascular host reaction (middle graph) and overall host reaction (right graph). (e) Fibrosis score (right graph) and neovascularization score (left graph) of the defects.
Serum analysis did not show differences in P1NP levels (Figure 7(a)) between treatments, yet CTX1 was significantly reduced in UCS versus WCS and BC (Figure 7(b)), indicating that UCS rats may have lesser collagen absorbance or osteoclast activity, which does not support the histological findings, as osteoclasts were undetected in the sections nor did we observe more bone formation in USC defects.

Serum of bone anabolic/catabolic markers. Rats were subjected to experimental procedure as in 5(a), and sacrificed 12 weeks post-operatively. Serum P1NP (a) and CTX1 (b) were analyzed to assess bone turnover (n = 7).
Mineral apposition distance (MAD) is enhanced at the defect edge of WISP1 treated chondrocyte scaffolds
Next, we examined the rate of bone anabolism by examining the left defect edge for MAD of the native bone, edge, and defect bone islands, as in Figure 8(a). The results show that MAD distance for the 4-week duration (Figure 8(b)) were highest at the defect edge, with a significant increase in bone formation distance for the WCS group versus UCS, CS, and BC (Figure 8(c) and (e)). Comparing MAD of the defect edge to the native bone (i.e. distance values normalized to native MAD), exhibited a significantly higher MAD for the WCS (Figures 8(d) and (e) images), indicating a high rate of bone formation in the WCS groups. Similarly, UCS exhibited significant improvements compared to CS and BC (Figure 8(c) and (d)), indicating that adding untreated chondrocyte to the defect could be beneficial in promoting bone formation, in line with the live and μCT analysis.

WISP1 treated chondrocytes scaffolds exhibit superior mineral apposition distance in the defect edges. (a) Illustration of mineral apposition distance in mid coronal section focusing on the left defect edge. (b) Red and green fluorescence in sections denote alizarin-complexon (red) and calcein (green) dyes embedded in osteoid at 2 and 6 weeks post-operative times respectively. The image is an overview of the left defect edge monitored for (i) the native bone, (ii) defect edge, and (iii) defect site as in (a). (c) Mineral apposition distance (MAD) in μm per area for each experimental group (n = 5). (d) Mineral apposition ratio normalized to native bone (fold change). (e) Representative images analyzed to assess bone turnover (n = 5).
Discussion
A great body of work in the past years has focused on the possibility of driving stem cell differentiation toward generation of osteogenic cells for bone repair. Despite these efforts, it remains challenging to use bone marrow derived stem cells for bone regeneration, partly due to the lack of critical mass and challenging growing conditions of these cells.5 –7 Here we propose the use of autologous cartilage for flat bone defect repair. This is a relatively understudied approach, which was initially reported in a mouse model using nasal chondrocytes by Bardsley et al. 31 Bardsley et al. provided the first proof to support the use of chondrocyte for repair of flat bone using a 4 mm diameter defect. However, unlike our report that utilized collagen-based scaffolds, Bardsley et al. utilized Poly-glycolamide (PGA)-based scaffolds, which may not be effectively remodeled into bone as collagen. Here we used a clinically approved collagen dressing which is often incorporated with bone graft or osteoinducive supplements to regenerate bone.32 –36 Moreover, we treated the cells with a WNT agonist, WISP1, which appears to promote bone-like structural attributes of bone regeneration (i.e. mineral mass, structural bone features, and bone apposition). Unlike our study utilizing embryonic costal chondrocytes, Bardsley et al. utilized adult nasal chondrocytes showing similar results favorable of bone regeneration. Despite these similar outcomes between our studies, it remains to be fully understood if different chondrocytes sources and degrees of differentiation, may result in varied clinical outcomes.
Using micromass organoid in vitro analysis we elucidated the effect of osteogenic factors, to potentiate hypertrophy and mineralization, namely with BMP2 and WISP1.18,19 In fact, we anticipated that WISP1 and BMP2 would act synergistically in enhancing osteogenic marks in chondrocytes, according to previous findings supporting that both WISP1 and BMP2 cooperatively control osteogenesis in bone marrow stromal cells (BMSC).18,37,38 Contrarily to this initial assumption, co-treatment of adult chondrocytes with WISP1/BMP2 did not result in enhanced ossification, possibly given differences in cell source and degree of differentiation. This reaction may differ in embryonic costal chondrocytes, which we used thereafter in vitro. As such, it appears that the impact of BMP2/WISP1 on stem cells may be more robust than in terminally differentiated chondrocytes, used in this study. Moreover, advanced passaging appeared to block the capacity of chondrocytes to mineralize in response to BMP2 and/or WISP1, possibly given that advanced passaging results in impaired chondrocitic phenotypes 39 and may likely harbor a more fibrotic cell nature.
As an additional facet of our in vitro studies we uncovered that BMP2 is not osteoinducive in human adult chondrocytes, despite its clinical use for bone regeneration.33,35 While the osteogenic effects in-vitro culture conditions were quite inconsistent, use of WISP1 did exhibit a trend to suggest an osteogenic effect directing chondrocyte mineralization, which also corresponded to improved bone structural phenotypes in vivo. While little is known of this growth factor, it is considered to activate WNT signaling, yet is not in current clinical use, possibly given its association with various cancers.23 –25 We therefore primed autologous chondrocytes prior to their transplantation, without introducing WISP1 directly to the defect site, to prevent risk of carcinogenesis.
Overall, in vivo data show that WISP1 pretreated chondrocyte scaffolds exhibit similar bone mass as untreated chondrocytes with improved structural parameters as trabecular thickness, periosteal surface, and perimeter and trabecular properties, previously shown to enhance bone strength.26 –30 Moreover, WISP1 primed chondrocytes exhibited superior MAD in defect edges and trabecular bone structures, the later which were also detected in untreated chondrocyte scaffolds. Interestingly, it was enough to introduce chondrocyte to the scaffold to detect trabecular bone formation, enhanced mineral intensity and improved anabolic activity via MAD analysis, at the defect edges. One limitation of this study is the use of costal embryonic chondrocytes, which are differentiated but also likely to mineralize via endochondral mechanisms. Despite these limitations, the data is consistent with other reports, 31 in supporting the utility of chondrocytes to expedite bone repair. Notably, the addition of WISP1 may improve some aspects in cartilage mineralization and in-vivo bone formation, by inducing β-catenin nuclear translocation. Interestingly, WISP1 was reported to aggravate OA,40,41 while genetically ablating Lef1, one of β-catenin downstream transcriptional coactivators, was shown to prevent OA-related articular damage and prevent cartilage mineralization. 42 Therefore, within the context of using cartilage for bone repair, WNT signaling activation may promote cartilage mineralization and subsequently support the generation of osseous matrix within the defect site.
Cumulatively, the data underpin that chondrocytes could serve as an adequate cell source to form a tissue template for cancelous bone formation and subsequent remodeling. Using chondrocytes as a donor sources, has significant advantages over autologous bone harvesting or bone-marrow derived stem cells, especially given that the risk of donor site morbidity may be reduced significantly, given that donor cartilage tissue is relatively devoid of vasculature and nerves. Moreover, the propagation and homogeneity of chondrocytes is cost efficient and consistent, in comparison to MSCs or stem cells derived sources. Based on these data, cartilage should be clinically considered for use in treating extensive or congenital maxillofacial defects.
Study limitations
While this study includes in vitro and in vivo data, it bears many limitations, amongst which are the power of the in vitro experimental systems, which provided limited repetitions per treatment group. In some cases, this limitation precluded statistical deduction and due to this restriction, we concluded results according to “trends” rather than “statistical significance”. As such, the decision to continue in vivo evaluations with WISP1 was favorably considered, given that it did not appear to prevent in vitro cartilage mineralization, and was an unexplored avenue for bone regeneration. Nonetheless, WCS did exhibit some microstructural and histological advantages versus USC. These advantages may be attributed to host reaction showing trends of higher neovascularization and lower fibrosis in WCS compared to UCS. Similarly, the in vivo experimental setup of a critical calvarial defect is considered less challenging than other fracture models such as mandibular fracture models.
Supplemental Material
sj-docx-1-tej-10.1177_20417314231159740 – Supplemental material for Repairing a critical cranial defect using WISP1-pretreated chondrocyte scaffolds
Supplemental material, sj-docx-1-tej-10.1177_20417314231159740 for Repairing a critical cranial defect using WISP1-pretreated chondrocyte scaffolds by Idan Carmon, Shira Kalmus, Anna Zobrab, Michael Alterman, Raphaelle Emram, May Gussarsky, Leonid Kandel, Eli Reich, Nardi Casap and Mona Dvir-Ginzberg in Journal of Tissue Engineering
Supplemental Material
sj-docx-2-tej-10.1177_20417314231159740 – Supplemental material for Repairing a critical cranial defect using WISP1-pretreated chondrocyte scaffolds
Supplemental material, sj-docx-2-tej-10.1177_20417314231159740 for Repairing a critical cranial defect using WISP1-pretreated chondrocyte scaffolds by Idan Carmon, Shira Kalmus, Anna Zobrab, Michael Alterman, Raphaelle Emram, May Gussarsky, Leonid Kandel, Eli Reich, Nardi Casap and Mona Dvir-Ginzberg in Journal of Tissue Engineering
Supplemental Material
sj-docx-3-tej-10.1177_20417314231159740 – Supplemental material for Repairing a critical cranial defect using WISP1-pretreated chondrocyte scaffolds
Supplemental material, sj-docx-3-tej-10.1177_20417314231159740 for Repairing a critical cranial defect using WISP1-pretreated chondrocyte scaffolds by Idan Carmon, Shira Kalmus, Anna Zobrab, Michael Alterman, Raphaelle Emram, May Gussarsky, Leonid Kandel, Eli Reich, Nardi Casap and Mona Dvir-Ginzberg in Journal of Tissue Engineering
Supplemental Material
sj-jpg-4-tej-10.1177_20417314231159740 – Supplemental material for Repairing a critical cranial defect using WISP1-pretreated chondrocyte scaffolds
Supplemental material, sj-jpg-4-tej-10.1177_20417314231159740 for Repairing a critical cranial defect using WISP1-pretreated chondrocyte scaffolds by Idan Carmon, Shira Kalmus, Anna Zobrab, Michael Alterman, Raphaelle Emram, May Gussarsky, Leonid Kandel, Eli Reich, Nardi Casap and Mona Dvir-Ginzberg in Journal of Tissue Engineering
Supplemental Material
sj-jpg-5-tej-10.1177_20417314231159740 – Supplemental material for Repairing a critical cranial defect using WISP1-pretreated chondrocyte scaffolds
Supplemental material, sj-jpg-5-tej-10.1177_20417314231159740 for Repairing a critical cranial defect using WISP1-pretreated chondrocyte scaffolds by Idan Carmon, Shira Kalmus, Anna Zobrab, Michael Alterman, Raphaelle Emram, May Gussarsky, Leonid Kandel, Eli Reich, Nardi Casap and Mona Dvir-Ginzberg in Journal of Tissue Engineering
Supplemental Material
sj-jpg-6-tej-10.1177_20417314231159740 – Supplemental material for Repairing a critical cranial defect using WISP1-pretreated chondrocyte scaffolds
Supplemental material, sj-jpg-6-tej-10.1177_20417314231159740 for Repairing a critical cranial defect using WISP1-pretreated chondrocyte scaffolds by Idan Carmon, Shira Kalmus, Anna Zobrab, Michael Alterman, Raphaelle Emram, May Gussarsky, Leonid Kandel, Eli Reich, Nardi Casap and Mona Dvir-Ginzberg in Journal of Tissue Engineering
Footnotes
Acknowledgements
Authors thank Dr. Tali Reem (Azrieli College of Engineering, Jerusalem); Dr. Rami Tabib and Dr. Adir Cohen (Dept. of Oral and Maxillofacial Surgery); Dr. Sai Rama Meka, Ms Louisa Ben-Aderet and Mr. Itzhak Meir for their support in initial proof of concept experiments. Authors thank Prof. Rinat Abramovitch (Wohl Institute for Translational Medicine) for her assitence and support in Live CT analysis. Authors thank Ms. Tamar Golovenzitz for MATLAB image analysis of micromass cultures..
Authors’ contributions
IC, SK, MA, ER, NC, and MDG designed research; IC, SK, MA, RE, MG, AZ, LK performed research; IC, SK, LK, ER, NC, and MDG contributed new reagents/analytic tools and clinical samples; IC, SK, MA, RE, MG, AZ, ER, NC, and MDG analyzed the data and performed statistical analysis; and MDG, NC, IC, SK, and MDG wrote the paper. All authors approved the final manuscript.
Availability of data and materials
The datasets used and/or analyzed during the current study are available from the corresponding author on reasonable request.
Declaration of conflicting interests
The author(s) declared no potential conflicts of interest with respect to the research, authorship, and/or publication of this article.
Funding
The author(s) disclosed receipt of the following financial support for the research, authorship, and/or publication of this article: Authors acknowledge funding from Ministry of science and Technology (#0001959), Israeli Defense Force (#4441062595), and Cabakoff Foundation to MDG and NC. MDG acknowledges support from Milgrom Foundation.
Supplemental material
Supplemental material for this article is available online.
References
Supplementary Material
Please find the following supplemental material available below.
For Open Access articles published under a Creative Commons License, all supplemental material carries the same license as the article it is associated with.
For non-Open Access articles published, all supplemental material carries a non-exclusive license, and permission requests for re-use of supplemental material or any part of supplemental material shall be sent directly to the copyright owner as specified in the copyright notice associated with the article.