
Abstract
Decellularized scaffolds can serve as an excellent three-dimensional environment for cell repopulation. They maintain tissue-specific microarchitecture of extracellular matrix proteins with important spatial cues for cell adhesion, migration, growth, and differentiation. However, criteria for quality assessment of the three-dimensional structure of decellularized scaffolds are rather fragmented, usually study-specific, and mostly semi-quantitative. Thus, we aimed to develop a robust structural assessment system for decellularized porcine liver scaffolds. Five scaffolds of different quality were used to establish the new evaluation system. We combined conventional semi-quantitative scoring criteria with a quantitative scaffold evaluation based on automated image analysis. For the quantitation, we developed a specific open source software tool (ScaffAn) applying algorithms designed for texture analysis, segmentation, and skeletonization. ScaffAn calculates selected parameters characterizing structural features of porcine liver scaffolds such as the sinusoidal network. After evaluating individual scaffolds, the total scores predicted scaffold interaction with cells in terms of cell adhesion. Higher scores corresponded to higher numbers of cells attached to the scaffolds. Moreover, our analysis revealed that the conventional system could not identify fine differences between good quality scaffolds while the additional use of ScaffAn allowed discrimination. This led us to the conclusion that only using the combined score resulted in the best discrimination between different quality scaffolds. Overall, our newly defined evaluation system has the potential to select the liver scaffolds most suitable for recellularization, and can represent a step toward better success in liver tissue engineering.
Keywords
Introduction
Engineering fully functional vascularized tissues to be routinely used in clinics is still a huge challenge. There has been a great progress in the development of different types of biomaterials supporting cell adhesion by functionalizing both synthetic and natural materials with a range of extracellular matrix (ECM) proteins or adhesive peptides. 1 Smart substrates have been designed to efficiently support cell growth and differentiation.2,3 Various hydrogels and three-dimensional (3D) printed matrices promote cell proliferation and differentiation, and could potentially help tissue maturation in 3D environment.4,5 However, all these classical tissue engineering approaches have limitations. With conventional tissue engineering, neither the native ECM environment nor the native tissue structure is generated.
In contrast, biological tissue engineering, consisting of decellularizing tissues or organs followed by repopulation allows to preserve the structural properties of the original tissue. Decellularization, the removal of all cells by a combination of physical, chemical and/or biological stressors, results in a scaffold consisting of native tissue-specific structural ECM proteins and the supportive 3D structure. 6 This includes the composition of structural ECM proteins such as collagens, laminins, and fibronectin as well as proteoglycans, glycosaminoglycans, and also signaling molecules like growth factors and cytokines. Ideally, all these components are maintained in their original locations after all cellular material has been washed out. 7 These proteins facilitate better cell–scaffold interaction during repopulation—helping adhesion, stimulating proliferation, and enabling differentiation processes.8,9
The level of scaffold preservation strongly depends on the decellularization protocol. 10 As the different components have different stability and vary in the type of the attachment to structural parts, the selection of decellularization detergents and the optimization of application protocols is crucial for obtaining the highest scaffold quality. Based on the type of the decellularization protocol, the tissue is exposed to specific conditions leading to cell lysis and removal of cellular components from their ECM. However, these processes are usually quite harsh not only toward the lipid bilayers and DNA but also to the proteins and other ECM components. Usually a combination of different stressors is used to achieve complete cell depletion, with freeze–thaw cycles as physical components of the process, and perfusion or incubation with different detergents representing the chemical part. The protocol can be complemented by adding proteases and/or DNAse to ensure depletion of immunogenic cellular components. 11 Therefore, decellularization may cause not only a loss of ECM components but also an irreversible damage of ECM microarchitecture.
Assessment of scaffold quality is still limited. Most reports describe a quantitative assessment of selected molecular parameters of bulk material, and only a qualitative assessment of selected morphological parameters. The molecular analysis mostly includes the measurement of the DNA content as an indicator of remnant nuclear material and sometimes the determination of ECM protein concentrations. The morphological analysis consists of evaluation of conventionally stained scaffold sections to confirm the lack of cell nuclei. Immunohistochemical staining is performed to visualize the presence and localization of most common or relevant ECM proteins. 12 Scanning electron microscopy (SEM) imaging is used for qualitative evaluation of 3D structure, and occasionally mechanical properties are being evaluated.13,14
None of these parameters is fully suitable to predict functional properties of the scaffold. With the key function of the scaffold being to support cell adhesion, proliferation, and differentiation, the preservation of native ECM proteins and their 3D-morphological structure seems to be crucial. Therefore, we raised the hypothesis that the functionality of the scaffold is related to the preservation of the native micro- and ultrastructure of the scaffold. To investigate this hypothesis, we are proposing a novel system for morphological evaluation of decellularized porcine liver scaffolds. Our system is based on the combination of a classical scoring approach and a newly developed computer analysis. Using this approach, we also want to distinguish fine structural details crucial for cell adhesion as the first step of the cell repopulation process.
Materials and methods
Experimental design
Five pig liver scaffolds with different levels of structural preservation (from a very low quality scaffold to well preserved scaffolds) were used to define a range of individual scoring criteria for the new evaluation system. After pig liver explantation and decellularization, a minimum of three tissue samples were taken from different areas of the scaffold. Samples were subjected to formalin fixation and paraffin embedding for further analysis. Two samples from each scaffold were fixed in glutaraldehyde for SEM analysis. Three representative samples per scaffold were used to determine the total DNA content. A conventional semi-quantitative histological analysis of the morphological quality was performed using whole slide scans from at least three tissue sections per scaffold stained with haematoxylin & eosin (H&E). Analysis was based on seven criteria and samples were classified into three quality categories, resulting in a score between 0 and 14. Samples reaching a minimum score of 4 in the conventional analysis were subjected to further SEM analysis. If the morphological quality was considered too low for SEM analysis, a score of zero was assumed. Quantitative evaluation of scaffold structural preservation was done with the newly developed software ScaffAn. For this step, we used whole slide H&E scans at low magnification (minimum of three scans per scaffold), and selected regions of interest at higher magnification (minimum of 10 regions per scan). A new multi-level assessment system was designed by combining both semi-quantitative and quantitative evaluation for improved differentiation, and the scaffolds were ranked according to their morphological quality. An adhesion assay using HepG2 cells was performed to test the relationship between morphological score and number of adhering cells as indirect indicator of scaffold function. A scheme of the workflow is shown in Figure S1(A).
Animals and liver explantation
Healthy Prestice black-pied pigs (ZD Mladotice, Czech Republic) aged 11–15 weeks and weighing between 30 and 40 kg were used as liver donors. Briefly, the animals were premedicated by intramuscular administration of 10 mg/kg ketamine (Spofa, a.s., Czech Republic), 5 mg/kg azaperon (Janssen Pharmaceutica NV, Belgium), and 1 mg atropine (Hoechst Biotika, Slovak Republic). For general anesthesia, propofol (1% mixture 5–10 mg/kg/h) (Fresenius Kabi Norges as, Norway) and fentanyl (1–2 µg/kg/h) (Chiesi cz s.r.o., Czech Republic) were used. Animals were intubated and mechanically ventilated. After opening the abdominal cavity and exposing the liver, the infrahepatic part of vena cava caudalis was ligated, hepatic artery and portal vein were cannulated, and the liver was perfused with 2 L of heparinized saline. Then the liver was explanted, placed in a sterile container and frozen at −80°C until further use. Animals were euthanized under anesthesia by administration of cardioplegic solution (KCl). Animals were handled under the approval of the Ministry of Agriculture of the Czech Republic No. 4891/2015-MZE-17214, and in compliance with the European Convention on Animal Care; surgical procedures were approved by The Ministry of Education, Youth and Sports of the Czech Republic (approval No. MSMT-4428/2018-2).
Liver decellularization
After thawing the frozen livers slowly at 4°C and rinsing with Ringer or saline solution, scaffolds were generated by circulating perfusion with 1% Triton X-100 (Carl Roth, Karlsruhe, Germany) followed by 1% SDS (Carl Roth, Karlsruhe, Germany). In order to be able to work with scaffolds at different preservation levels, we utilized five scaffolds that were decellularized in our labs by five different procedures employed during previous decellularization tests. These protocols varied in terms of perfusion time, circulation volume, flow direction, and total volume of perfusion solution; an overview of the individual protocol conditions is given in Table S1, and the details of each protocol are described in Supplemental Material (part Supplementary methods). In all cases, decellularization was stopped when the livers turned homogenously white. Scaffolds were washed with saline to remove residual detergent solution. Tissue samples were fixed in 10% neutral-buffered formalin and kept until further processing. Samples for SEM were fixed in 4% formaldehyde and 2.5% glutaraldehyde solution.
DNA content evaluation
Formalin fixed samples were embedded in paraffin and cut in 20 µm sections (three sections per replicate). Samples were deparaffinized in xylene, washed twice with 100% ethanol, air dried, and weighed. After 48 h of proteinase K treatment, DNA was extracted in triplicates using RecoverAll DNA extraction kit (Life Technologies, Carlsbad, US), and the DNA content was measured on NanoDrop. According to the definition of Gilbert et al., 15 scaffold samples with less than 50 ng/mg dry tissue were considered cell free.
Histology and immunohistochemistry
Staining
Sections (4 µm) were deparaffinized in xylene, washed in ethanol and rehydrated, and then used for H&E staining and collagen IV (Col IV) immunohistochemistry. For Col IV staining, polyclonal rabbit anti-collagen IV antibody (ab6586, AbCam) was used in 1:500 dilution, and Envision + System-HRP for use with Rabbit Primary antibody (Dako) was employed for detection. Slides were dehydrated, mounted with Leica CV Mount (Leica), and coverslipped. Whole slide scans were generated using Nanozoomer 2.0HT Digital Slide Scanner (Hamamatsu, Japan).
Criteria for assessing the structural quality of the scaffold
A three-level grading system based on assessing purely morphological scaffold features visualized by H&E staining was developed; 0 represented the lowest scaffold quality, 1 described moderate preservation, and 2 was given for good preservation quality (details in Table 1). At 5× magnification, the lobular shape and sinusoidal network presence were evaluated. There, score 2 was given to scaffolds with the lobular shape preserved, and also where the network was present in more than 90% of lobular space. Score 1 was given to scaffolds where the lobular structures were compressed down to about two-thirds of expected area judged according to native liver structure, and where the network was present in 90%–50% of lobular area. Score 0 was given to scaffold with the compression down to about one-third of expected area, and with the network present in less than 50% of lobules. Septa and triad structures were evaluated at 10× magnification; score 2 for a good quality scaffold was characterized by no rupture, no layer separation, and well-defined vessels; some septa separation into layers and non-frequent septa ruptures were typical for score 1; scaffolds with destroyed septa and triad areas were judged by score 0. Sinusoidal network integrity was assessed at 15× magnification. There, scaffolds with regular distribution and consistent network structure were given score 2, some network irregularities were typical for score 1 (moderate quality), and scaffold with large differences in distance between individual sinusoids obtained score 0.
Definition of criteria for assessing decellularized liver tissue with three-level grading system (good/moderate/low quality); conventional semi-quantitative scoring was complemented by the new quantitative scoring based on parameters calculated by ScaffAn.

H&E: haematoxylin & eosin; SEM: scanning electron microscopy.
SEM
Sample processing
Small pieces of pig liver scaffolds (5 mm) were fixed with 4% formaldehyde and 2.5% (v/v) glutaraldehyde in 0.1 M cacodylate buffer for 60 min. Samples were washed three times for 10 min each with cacodylate buffer and dehydrated in ascending ethanol concentrations (30%, 50%, 70%, 90%, and 100%) for 10 min each. Subsequently, the samples were critical-point dried using liquid CO2 and sputter coated with gold (thickness approx. 2 nm) using a SCD005 sputter coater (BAL-TEC, Liechtenstein) to avoid surface charging. Finally, the specimen were investigated with a field emission (FE) SEM LEO-1530 Gemini (Carl Zeiss NTS GmbH, Oberkochen, Germany).
Assessment criteria
Scaffold ultrastructure was assessed for sinusoidal wall integrity at 2000× magnification. Score 2 was given to scaffolds with maintained wall integrity and well-organized protein fibers; score 1 was represented by some loss of integrity with loosening of protein fibers and presence of holes; score 0 was characterized by a complete loss of integrity and large holes (Table 1).
ScaffAn software development and analysis
The ScaffAn application was developed for quantitative assessment of high resolution slide scans of H&E stained scaffold sections from pig livers. The goal was to distinguish the texture of sinusoidal and interlobular areas, and to calculate parameters characterizing the sinusoidal network structure such as total lengths, number of branching, and number of blind ends. The code was generated using the open source program Python 16 taking advantage of the large user community. Numpy, Scipy, Pandas, Scikit-image, and Scikit-learn packages17–19 were used for general array computations, statistics, spreadsheet operations, image processing, and machine learning, respectively.
The whole-scan segmentation was based on texture analysis. Color and simple texture features were extracted from raster image with low resolution (pixel size about 10 μm). Then per pixel segmentation into three classes (empty area, sinusoidal area, and fibrous/interlobular area) was performed by Naive Bayes classifier trained from manual annotations. For calculating the ratio of sinusoidal and interlobular areas, images of sections depicting mainly large vessels were excluded from analysis. The standard range for this ratio was obtained from selected scaffold section images with a lobular shape similar to the lobular shape of the native liver. Automatic lobule selection based on distance transform (local maximum selection) can be used to pick N of the biggest and the least deformed lobules in the scan. A circle-shaped annotation is placed into the center of the lobule. Manual annotation can be also selected and performed by the user in NDP Viewer (Hamamatsu, Japan) to directly perform the following intralobular area segmentation analysis.
The intralobular area segmentation was done by active contour model algorithm 20 using images with resolution 1.82 µm which were preprocessed by Hessian-based Frangi filter 21 and gray level co-occurrence matrix (GLCM) texture features. An automatic threshold was calculated in the intralobular area. 22 After skeletonization, the texture parameters describing the scaffold were extracted. For intralobular area analysis, a minimum of 10 lobules per each slide scan was analyzed.
The scoring criteria were defined for individual ScaffAn parameters as follows: Sinusoidal structure lengths representing low-, moderate-, and high-quality scaffold were set as lower than 20 mm/mm2 (score 0), between 20 and 60 mm/mm2 (score 1), and higher than 60 mm/mm2 (score 2), respectively. Numbers of sinusoidal network branching typical for low-, moderate-, and high-quality scaffold were set as fewer than 10,000 per mm2 (score 0), between 10,000 and 30,000 per mm2 (score 1), and more than 30,000 per mm2 (score 2), respectively.
The code was automatically tested on selected sample set via continuous integration. The application outputs were in open file formats and the number of outputs could be controlled based on severity. The numerical outputs were stored in “.xlsx” spreadsheet, prepared for bulk processing. The area screenshots were stored in output directory with numpy “.npz” file ready to be used for further processing. The repository with the software is freely available as open source to allow the following of individual algorithm steps (https://mjirik.github.io/scaffan/).
Adhesion assay
The early adhesion assay was performed in duplicates (for two different samples from each pig liver scaffold); 80 µm thick paraffin sections were deparaffinized, rehydrated, and UV sterilized for 20 min. HepG2 cells were grown in high-glucose DMEM supplemented with 10% of Fetal Bovine Serum, 1% of Penicillin–Streptomycin solution, and 0.5% L-Glutamine solution (Gibco, Fisher Scientific). After trypsinizing, the cells were drop-seeded on the top of the sections using seeding density of 10,000 cells per cm2, and incubated at 37°C for 30 min. After incubation, samples were washed with Phosphate-buffered saline, fixed with 4% formaldehyde solution, and stained for collagen IV using rabbit polyclonal antibody (AbCam, ab6586) with AF568 goat anti-rabbit secondary antibody to visualize the scaffold, and for actin & DNA with AF488 Phalloidin (Life Technologies, A12379) and DAPI (4′,6-diamidino-2-phenylindole), respectively, to detect cells. Images were taken at 10× magnification to analyze cell numbers using a fluorescence microscope (Olympus IX80). Image analysis for cell counting was done using ImageJ using at least 10 images of each sample with two different tissue samples used per each scaffold. Results of the adhesion assay were compared to the final total score of the morphological assessment to assess the relationship between the results of scaffold evaluation and the number of adhered cells.
Statistical analysis
For quantifying the remnant DNA content, scaffold samples were assessed in triplicates. For comparison of quantitative parameter describing each scaffold type, image analysis was done for minimum of three whole slide scans per scaffold type, and for minimum of 10 individual lobules analyzed per single scan. Cell culture samples were analyzed in triplicates, and minimum of 10 fields were analyzed during image analysis. All data were displayed as means with respective standard deviations. Significance level was set as p < 0.05. All experimental data were analyzed using GraphPad Prism software (GraphPad Software Inc., California, US) utilizing one-way analysis of variance (ANOVA) with Tukey comparison post-test.
Results
Basic quality assessment: acellular scaffold not equal to good quality scaffold
After decellularizing the liver using different protocols, all livers appeared white and translucent. An example of the appearance of the whole liver before and after decellularization is given in Figure S1(B). The initial macroscopic visual and palpatory assessment showed that the appearance of the liver scaffolds varied in terms of consistence. Liver #1 was over perfused and obviously lost consistence as detected upon inspection and palpation. This was probably due to the loss of collagenous particles, which appeared in the perfusate. In contrast, all other livers maintained a consistence similar to the consistence of the native liver.
All protocols resulted in completely decellularized scaffolds in terms of remnant DNA content and removal of cell nuclei. After DNA extraction from dried decellularized tissue, the amount of DNA was less than 50 ng per mg of dry scaffold. In samples from protocols #4 and #5, the level of DNA was below the detection limit of the kit used (Figure 1(a)).

Characterization of pig liver scaffolds: (a) DNA content in dry scaffolds. (b) Scaffold sections stained with H&E: Top images at low magnification help to assess the overall hepatic lobular architecture; bottom images highlight the level of preservation of the detailed intralobular structure of individual scaffolds. (c) Scaffolds imaged by SEM at high magnification with focus on sinusoidal area with preserved ECM of sinusoidal wall structures. Red arrows point at large holes in sinusoidal wall ECM; yellow arrows depict preserved lumen of the sinusoidal ECM space.
H&E staining also confirmed the absence of cell nuclei in all tissue samples from the five scaffolds (Figure 1(b)). Nevertheless, the respective H&E images revealed obvious differences in the preservation of morphology. These differences were attributed to the differences in decellularization protocols such as perfusion time or total volume of perfusion solution (see Table S1). However, these morphological differences were not reflected in the DNA quantification.
Need for morphological assessment: semi-quantitative scoring system
Based on the substantial differences in the histological appearance revealed by the H&E (Figure 1(b)) and confirmed in the collagen IV staining (Figure S3), we designed the semi-quantitative scoring system. The combination of H&E-stained images with SEM images was used for further analysis. The detailed description of the criteria is highlighted in Table 1 as conventional semi-quantitative analysis type. The scores for individual scaffolds assessed according to these criteria are shown in the upper part of Table 2.
Scoring results after assessing liver scaffolds obtained with different decellularization protocols; partial sum scores are presented (conventional semi-quantitative scoring is highlighted in blue, new quantitative scoring is in red), total scores are in bold.

H&E: haematoxylin & eosin; SEM: scanning electron microscopy.
The scanned H&E scaffold sections were used to identify and evaluate the key parameters of the conventional scoring system. Scaffold #1 had very poorly preserved intralobular microarchitecture. The interlobular septa were generally maintained as well as was the shape of the lobules (score 2) but most of the intralobular sinusoidal structures got lost (score 0). However, collagen staining resulted in strong and crisp signals suggesting that the staining-relevant collagen epitopes were maintained. In contrast, scaffolds #2 and #3 had only some lacerations in the sinusoidal areas (score 1), and in scaffolds #4 and 5 the most of sinusoidal network was preserved without any detectable damage (score 2). Nevertheless, in scaffolds #2, #3, #4, and #5, some lobular deformation/compression was present in few regions of the sections. This was indicated by the reduced space taken up by the sinusoidal network and the increased area covered by fibrous features typical for septa.
As explained before, SEM analysis was only performed if the histological score was above 4. In case of an ill-preserved histological structure, we expected a similarly low preserved ultrastructure, and the score of zero was given (scaffolds #1 and #2). Therefore, SEM analysis was performed only for samples from scaffolds #3, #4, and #5. Scaffold #3 perfused with the centrifugal pump showed an impaired ultrastructure, and received score 1. Even at low magnification (100×), the key structures such as portal triads and typical lobular shapes could not be clearly identified (Figure S4). At high magnification (2000×), it became obvious that the sinusoidal ECM was torn apart, with large holes in the ECM of sinusoidal walls and ill-defined sinusoidal lumen (Figure 1(c)). In scaffolds #4 and #5, the sinusoidal network, central veins, and triad structures were clearly visible, with sinusoidal ECM more intact and vessel lumen mostly preserved (Figure 1(c)) resulting in score 2.
Conventional scoring based on visual pattern recognition done by the observer (Table 2, upper part) allowed discrimination of scaffold quality into three classes with scaffolds #1 and #2 being of low quality (score 3), scaffold #3 of moderate quality (score 7), and scaffolds #4 and #5 of high quality (score 10).
Need for quantitation: development of ScaffAn
Currently, there is no system available for assessing the morphological structure of decellularized liver quantitatively. Therefore, we designed and developed ScaffAn, an image analysis software for quantitative histological analysis of whole slide scans from decellularized pig liver scaffolds. First, we defined specific parameters characterizing important features of the scaffold. Second, specific sets of algorithms were programmed and optimized to calculate these parameters from a small sample set of images. Then the software was used to analyze a larger set of data, and finally a simple graphical user interface (GUI) was designed to enable an easy and intuitive routine use. Screenshots of the GUI in Figure S5 demonstrate the selection of parameters and output levels that can be set for the analysis including an example of a tool tip (hoverbox).
Using scans of microscopic images of H&E-stained scaffold sections as an input, the software works at two levels, the “whole-scan analysis level” and the “lobular network analysis level” (a scheme given in Figure 2).

Scheme of ScaffAn analysis of the liver scaffold. The software workflow depicts the two levels of analysis, the whole-scan analysis and the lobular network analysis as well as the input data. The option to choose between manual and automatic lobule selection for lobular network analysis is shown by the switch symbol.
On the “whole-scan analysis level,” the software characterizes different image textures. This is done to differentiate between high-density fibrous areas representing interlobular protein fibers (septa) and eventual scaffold compression, and lower density areas representing the sinusoidal ECM protein network (Figure 3(a)). Furthermore, the automated lobule selection can be done based on the whole-slide segmentation. This procedure is an alternative to the lobule selection by manual annotation for the lobular network analysis. The parameters of this procedure can be controlled in the GUI; an example of the visualization of automatic lobule selection in the whole scan is shown in Figure S6(A).

ScaffAn whole-scan image analysis of the liver scaffold: (a) Representative images of the whole-scan texture analysis showing fibrous areas (representing both septa and compressed areas) in yellow, sinusoidal areas in green, and empty space in purple; in scaffold #1 image, most of the sinusoidal area ECM is missing; compression damage is shown in scaffold #2 image; scaffold #3 image represents regular distribution of fibrous and sinusoidal areas. (b) Quantification of sinusoidal/fibrous area ratios for each type of scaffold; the normal range of the sinusoidal/fibrous area ratio range is represented by purple area.
On the “lobular network analysis level,” the software calculates selected parameters characterizing the preservation of the sinusoidal network within the individual lobules. This is a two-step process. The first step is the lobule segmentation to define the lobular area for analysis (Figure 4(a)). This segmentation is based either on an automated lobule selection from the whole-scan analysis or on a simple manual annotation made by the user inside the lobule. ScaffAn uses a segmentation algorithm based on Active Contours without Edges 20 with a gradient image from this analysis shown in Figure 4(b). The software detects the lobular border which is located outside of the circular annotation line, and the central vein located within the encircled area (Figure 4(a) left). The second step is the analysis of the selected intralobular area via thresholding and skeletonization (Figure 4(a) center and right) to calculate defined parameters such as network structure lengths, number of branching, and number of blind ends.
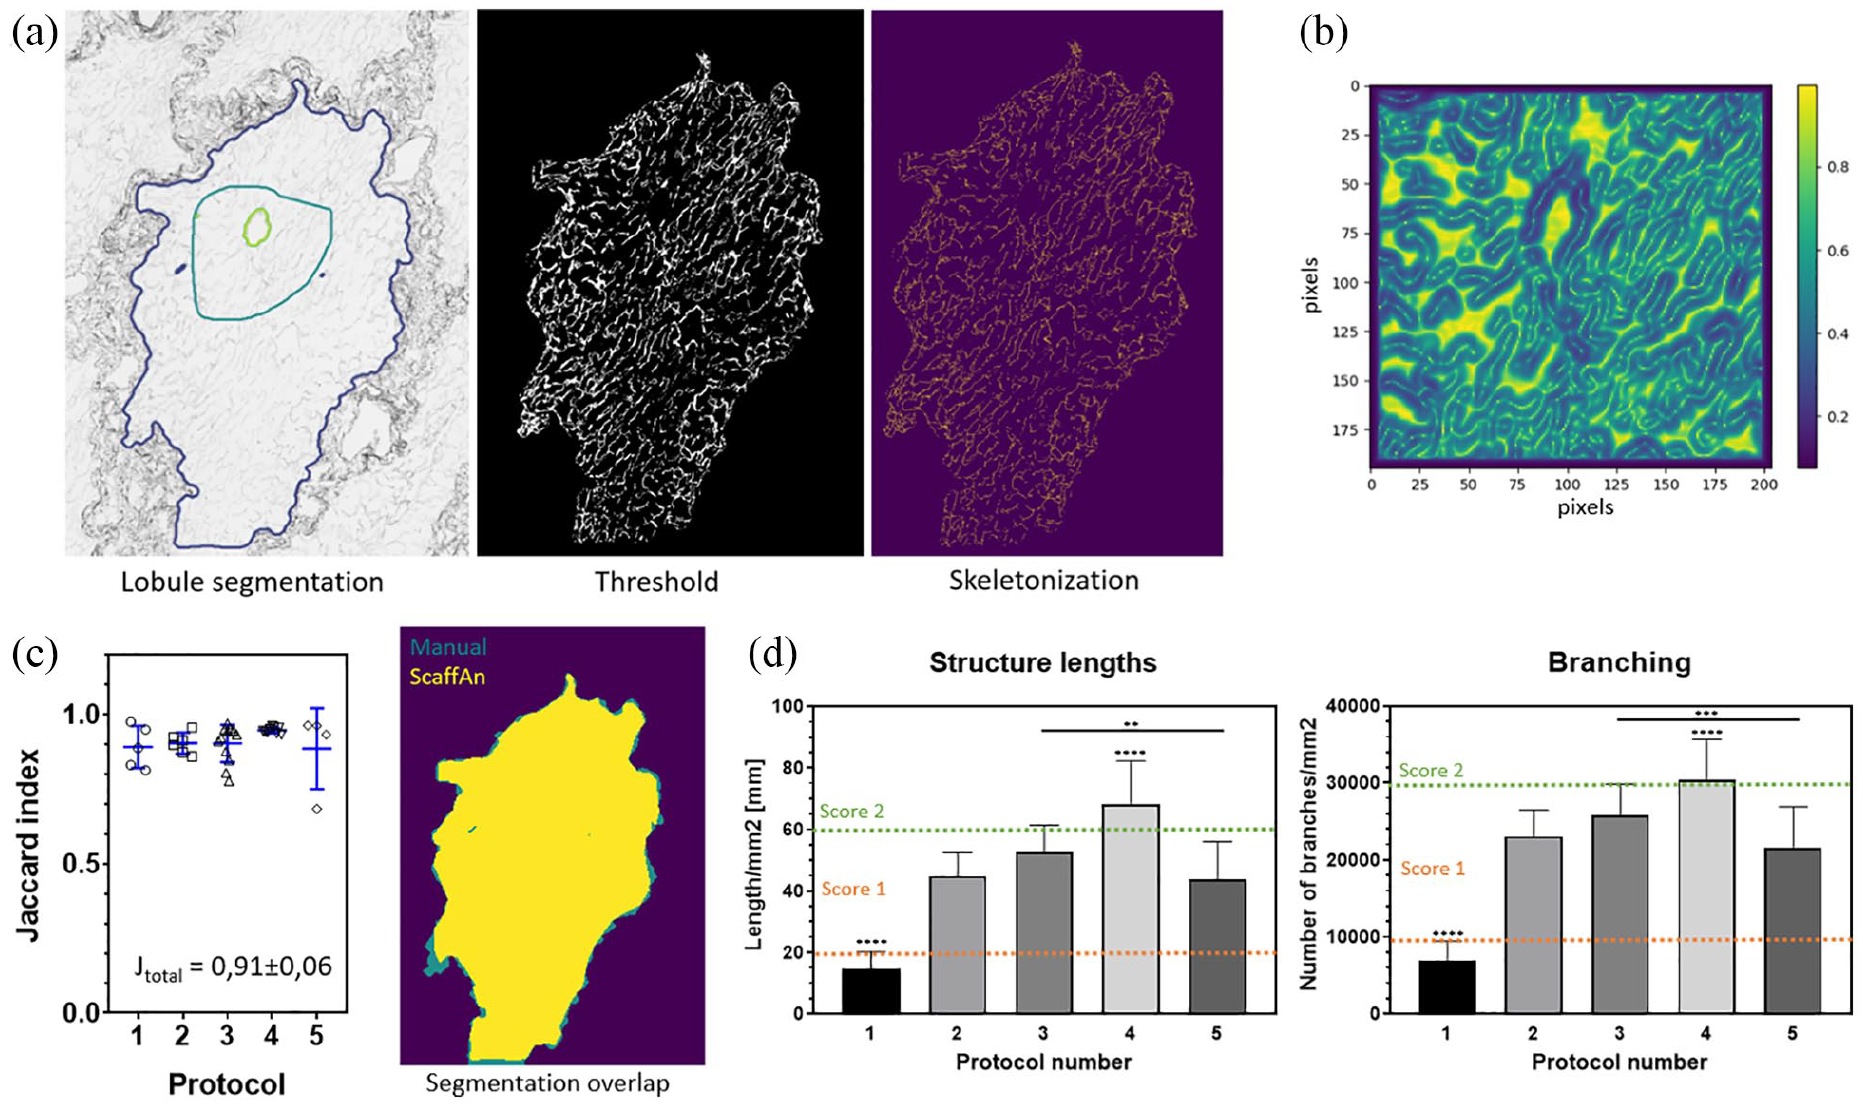
ScaffAn lobular network analysis: (a) Selected steps of the computer analysis: After manual annotation (dark green line), the individual lobule segmentation was done resulting in the automatic detection of central vein (green line) and the lobular border (blue line, left); setting of the threshold (center); an example of a skeletonized image of intralobular area (right). (b) Gradient image of intralobular area was used for central vein/lobular border segmentation algorithm to define the borders. (c) Correlation analysis of manual and computer segmentation: Manually segmented area (in green) overlapped with ScaffAn segmentation result (yellow); Jaccard similarity coefficient is shown for each type of scaffold with the overall Jaccard index for all tested lobules and scaffold types inserted in the graph. (d) Selected parameters characterizing the sinusoidal ECM network calculated by ScaffAn; the results for structure lengths and branching nodes are shown for each scaffold type; the classification into three levels used in the scoring system is demonstrated by the dashed orange and green lines.
The robustness of ScaffAn lobule segmentation was validated by calculating the Jaccard similarity coefficient comparing manually annotated lobule boundaries from different scaffolds with computer calculated boundaries. An example of an analyzed lobule is shown in Figure 4(c) right; manually defined areas (in green) showed very good overlap with computer calculated areas (in yellow). The data correlated well in scaffolds from all protocols with the overall Jaccard index equal to 0.91 ± 0.06 confirming the high reliability of the segmentation process (Figure 4(c) left).
ScaffAn: quantitative assessment of liver scaffold
We evaluated different parameters to identify the ones with the highest discriminative power. Using the whole slide scan analysis, we calculated the ratio between the intralobular area consisting of the sinusoidal network and the interlobular area comprised of the septa and the portal field (sinusoidal/interlobular ratio). Using the lobular network analysis, we quantified parameters describing the sinusoidal network (structure lengths, branching, and blind ends) of randomly selected liver lobules.
On the level of the whole-scan analysis, computer-based identification of sinusoidal and interlobular areas detected the holes in the tissue section of scaffold #1 representing the destroyed and missing sinusoidal network (Figure 3(a)). The software algorithm also detected a high level of fibrous area where lobular borders were difficult to be identified in scaffold #2; this suggested compression damage. In the images of most samples from scaffolds #3, #4, and #5, the lobular septa were clearly distinguishable with easily detectable central vein (Figure 3(a)), thus representing a structurally well preserved scaffold. For determining the standard range for the sinusoidal/fibrous area ratio, scans from scaffolds showing a high similarity of the lobular shape to the native liver were used. This standard ratio range was calculated as 2.0–2.4 with a mean of 2.2 ± 0.2. In other words, in native and well-preserved liver, the area occupied by the sinusoidal network area was twice as large as the area taken by the septa and small vessels.
Analysis of the three whole slide scans from different areas of each scaffold was performed to assess the severity of scaffold compression as quantitative parameter of scaffold damage (Figure 3(b)). The ratios obtained from scaffolds #1 and #2 were significantly lower than the standard ratio. However, the underlying damage pattern was strikingly different. In scaffold #1, lobules were not compressed but the sinusoidal ECM was mostly missing, and therefore identified by the software as background area. In scaffold #2, the sinusoidal ECM was mostly preserved (based on H&E images) but the lobules were strongly compressed. The ratios obtained from scaffolds #3, #4, and #5 showed high variability between the individual replicates. However, in scaffolds #4 and #5, the mean ratio was within the standard range. Since the calculated ratio was not clearly reflecting the type and severity of damage, this parameter was not included into the scoring system. Instead it was used as an additional information contributing to the estimate of the overall scaffold damage of lobular shape.
The second level of ScaffAn analysis, the intralobular area analysis resulted in a set of three parameters: structure lengths, branching, and blind ends. These parameters were calculated for each segmented and selected lobule. As the intralobular network represents the network of sinusoidal vessels, we used these parameters to quantify the level of preservation of these fine ECM structures after decellularization. Scaffold #1 had the shortest lengths and the lowest level of branching (15 mm and 6978 branches per mm2) in comparison to all other scaffolds. Scaffold #4 showed the best preserved sinusoidal network according to both parameters. Structure lengths and branches were significantly higher compared to all other scaffolds (68 mm and 30,330 branches per mm2). Graphs comparing structure lengths and branching in all scaffolds are shown in Figure 4(d). In order to integrate the results into the scoring system, we classified the results for structure lengths and branching into three categories as done for the conventional scoring system. Based on statistically significant differences in structure lengths and number of branching, we selected the value thresholds specifying the individual grading. In case of sinusoidal structure lengths, the score 2 was assigned when the value was higher than 60 mm/mm2 (the best preservation), and the score 0 was given when the value was lower than 20 mm/mm2. The score 1 was given when the calculated value was between these two numbers. In case of number of branches the score 2 was assigned to samples with more than 30,000 branches per mm2 while the score 0 was given to samples with less than 10,000 branches per mm2 (the least preserved). The samples with the number of branches between these two thresholds received the score 1. Table 1 highlights this grading as the new quantitative analysis type. An example of computer identification of branching nodes is shown in Figure S6(C).
According to this evaluation system, scaffold #1 was graded zero for both parameters, whereas scaffold #4 received score 2 for both parameters. The other scaffolds were graded as moderately preserved with score 1 for both parameters.
In contrast, the determination of blind ends did not allow any discrimination between scaffolds. We planned to calculate the standard range of the number of blind ends per area representing an average number of sinusoidal vessels interrupted during processing of the well preserved sample (cutting 4 µm sections). A higher incidence of blind ends was expected to point at a higher damage/loosening of the network structure. This analysis did not appear to be helpful for discriminating due to the high variability between samples (Figure S6(B)). Therefore, this parameter was not included into the evaluation system.
Establishing multi-level evaluation system: increasing discriminative power
For better discriminating fine differences in the microarchitecture of the scaffold, we combined the results of the conventional semi-quantitative scoring system with the computer-assisted quantitative assessment by simply adding up the scores. Basic conventional assessment was complemented by the newly developed quantitative evaluation system using the parameters calculated by ScaffAn. The list of the conventional semi-quantitative and new quantitative parameters together with the description of the scoring levels is highlighted in Table 1 in blue and red, respectively. The corresponding scores for individual scaffolds are given in Table 2. The total score spans from 0 up to 14 where the highest ranking represented a highly preserved structure, thus identifying the best quality scaffold (scaffold #4). All seven scored parameters were considered equally important as reflected by giving them the same weight in the score.
The scoring results for the individual scaffolds are shown as partial scores for conventional as well as for the ScaffAn-based approach, respectively (Table 2). Table 2 clearly illustrates the benefit of the combined scoring system resulting in a better discrimination of small differences between scaffolds. When summing up the two scores, scaffold #4 could be distinguished from scaffold #5, which was not achieved when only applying the semi-quantitative scoring. This finding clearly supports the use of the combined score.
Relationship between scaffold morphology and function: adhesion assay
The potential of detailed morphological assessment is related to its potential predicting functional properties of the decellularized scaffolds. One of the basic functions is the capacity to support adhesion of the cells used for seeding. Therefore, we designed the early adhesion assay utilizing HepG2 cells to link the results of scaffold evaluation to functional properties of the scaffold.
The graph in Figure 5(a) summarizes results of this adhesion assay. Scaffold #1 showed very poor cell adhesion (only 25 cells per image) which was significantly lower than in all other scaffolds. Scaffolds #2 and #3 attracted similar amount of HepG2 cells (184 and 173 cells per image, respectively). Scaffold #4 with the highest combined score of 14 attracted also the highest number of cells, 303 cells per image. Scaffold #5 with a slightly lower combined morphological score attracted 85% of maximal cell number adhered (256 cells per image). This was in agreement with the morphological scaffold evaluation using our novel set of criteria where scaffold #1 received the lowest and scaffold #4 the highest total score.

Early cell attachment to the decellularized scaffolds: (a) The number of HepG2 cells adhered to individual scaffolds was highly variable (also the red line in (b)); the best adhesion was observed on scaffold #4, which was significantly higher in comparison with scaffolds #1, #2, and #3. Adhesion on scaffold #5 was also good; however, it significantly differed only from scaffold #1 which showed the lowest performance in cell attachment. (b) The relationship of cell adhesion level and total scores from scaffold evaluation representing individual scaffold types: The red line representing cell adherence is parallel to the green line representing the scaffold quality as evaluated by our scoring. (c) Representative images of HepG2 cells adhered to individual scaffolds; collagen IV is stained in red for scaffold visualization, cells are in green (cytoskeleton staining).
The adhesion study showed that the total morphological score was closely related to the cell adhesion capacity of the individual scaffolds (Figure 5(b)). Representative images of HepG2 cells adhered to individual scaffolds are shown in Figure 5(c). It is important to note that the cell adhesion was analyzed exclusively on images with preserved ECM network. All images with less preserved sinusoidal areas where the sinusoidal ECM was damaged or completely missing (particularly in case of scaffold #1) were excluded from the analysis. This resulted in the additional observation that even in case the ECM proteins were still present and theoretically supportive of cell adhesion in all analyzed areas, the lower quality scaffolds showed lower affinity to cells. This finding suggests additional features of the ECM proteins such as secondary or tertiary structures were potentially more damaged during harsh decellularization procedure (as used for scaffold #1), and thus presenting, that is, less binding sites for cell adhesion.
Discussion
Decellularized tissue scaffolds represent a promising material in tissue engineering. This unique matrix can potentially regulate cell-scaffold interactions during recellularization thereby promoting 3D tissue maturation. Moreover, decellularized tissue can be readily available without the use of complex chemical syntheses and sophisticated manufacturing processes.11,23
We raised the hypothesis that preservation of the native micro- and ultrastructure of the scaffold is related to the functionality of the scaffold. Therefore, we proposed a novel assessment system based rather on morphology than on bulk properties of decellularized material. Then, we related the results to the cell adherence capacity as one of the key basic functions of the scaffold.
Our results support this hypothesis. Overall, the combined score corresponded well with the result of the basic functional cell adhesion assay. Cells adhered in higher numbers to better preserved scaffolds with a microarchitecture close to the one of native liver. Therefore, our observations confirmed that scaffold preservation determines the scaffold performance in terms of cell adhesion. This is in line with the study of Maghsoudlou et al. 24 where successful in vitro repopulation of rat liver scaffold was linked to a well-maintained matrix microarchitecture. Nevertheless, this highly promising relationship between form and function needs to be further confirmed by other functional assays. These assays can be represented, for example, by cell viability assay, cell proliferation assay, or by monitoring cell-specific behavior such as tube formation in case of scaffold repopulation with endothelial cells or albumin secretion in case of hepatocytes.
There are very few studies concentrating on rigorous morphological evaluation of decellularized scaffolds. The lack of a standardized approach in the evaluation of scaffold structure can be related to the fact that the ECM microarchitecture is tissue specific. Scoring systems reflecting the architectural preservation have been published for decellularized kidney from rat and pig by Caralt et al. 25 and Fischer et al., 26 respectively. However, their criteria describe the scaffold quality only in semi-quantitative way. Moreover, no evaluation system has been reported for other decellularized organs or tissues including liver tissue.
We aimed to address the need for standardization of the evaluation process of porcine liver scaffolds. In a way, we got inspired by Caralt’s and Fischer’s scoring systems for establishing the “conventional scoring” part of our system. We simplified the classification by decreasing the number of grading levels down to three from the five and four used by Caralt and Fischer, respectively. A three-grade approach is more robust compared to a five-grade system, especially if several investigators are involved, since it reduces the interobserver variability. Caralt’s study eliminated this source of error by having the assessment done by a single pathologist. 25 However, the assessment should be kept as simple as possible since such a highly specialized expert is not always available.
Interestingly, Fischer et al. 26 observed an inverse relationship between structure and function in comparison to our results. Performing a cell adhesion assay with porcine kidney scaffold sections, they observed that the scaffold with the highest structural and composition score had actually lower functional performance in terms of cell attachment. In their hands, the scaffold with lower structural and composition scores had a significantly better cell performance score. The possible reason for this discrepancy can be a high complexity of their scoring system with too many factors involved without considering the fact that their selected parameters can have different weights.
For the conventional semi-quantitative scoring, we proposed a multi-scale system. We used different magnifications to encompass the wide range of parameters from assessing the lobular shape down to the ultrastructural integrity of the sinusoidal wall. A similar but less scale-spanning approach was reported for porcine kidneys where the general appearance was assessed in addition to the detailed analysis of kidney-specific structures such as glomeruli, tubuli, or vessels. 26
Shrinking or compression of the lobular structure was also described earlier. Mattei et al. 27 reported lobular shrinking inevitably appearing in human liver scaffolds after cell removal from liver disks. They suggested to include a collapse correction factor by calculating the ratios between the lobular size of native and decellularized liver. Interestingly, we did not see this homogeneous shrinking of all lobules and in all scaffolds. Instead, we observed heterogeneous lobular compression of different severity in the scaffolds and considered the preservation of lobular shape as an indicator of scaffold quality. Therefore, we included lobular shape preservation in the semi-quantitative part of our evaluation system. As for some scaffolds, we obtained well-preserved lobular shapes similar to native liver (Figure S7), we assume that the inevitable shrinking/compression due to mechanical forces is present but at much lower level than previously described. 27
Mentioning mechanical forces, it would be very interesting to evaluate the overall mechanical properties of the tested scaffolds. However, as this study was aimed at the development of a set of purely morphological criteria, we did not include any bulk material properties in our evaluation system. Nevertheless, mechanical properties are very important for any biomaterial. Thus, and considering also the following paragraph discussing the freeze/thaw process that can affect mechanical behavior, further studies would highly benefit from measuring parameters such as material stiffness.
Our liver storage in the freezer prior the decellularization can theoretically introduce freezing-related damage to the ECM. On the contrary, freezing has been used as an additional measure to improve the decellularization process by inducing cellular damage prior to detergent perfusion for easier removal of cells.6,28 However, the interpretation regarding the impact of low temperatures might also be related to the read-out parameter used. In summary, detailed studies focusing on the impact of freezing are needed but require the use of adequate methods to detect the expected morphological and conformational alterations of the ECM in sufficient detail. Furthermore, the potential functional impact on repopulation characteristics needs to be explored in detail.
Reliable quantitative observer-independent assessment of scanned images of decellularized scaffolds can be performed by introducing computer analysis. Naturally, there has been progress in the development of software tools for general quantitative histological analysis. For example, the HisTOOLogy application was developed for easy color deconvolution of multicolor histological images. 29 QuPath offers a useful set of tools originally designed for tumor identification and high-throughput biomarker evaluation that is extendable for analyses of a wide range of biomedical images using pixel classifier, annotation, and other tools. 30 However, neither of these platforms was suitable to fulfill our goal to simply quantify morphological structures in decellularized scaffolds as an indicator of scaffold quality. Widely used ImageJ is a multipurpose tool utilizing some of the algorithms needed for our purpose such as thresholding or skeletonization. 31 Nevertheless, some manual input is needed, and large-scale image analysis is time-consuming. Moreover, ImageJ offers just limited support for pattern recognition and texture analysis. Therefore, we developed a software tool dedicated to the analysis of the specific morphological features of pig liver scaffold as visualized by H&E staining. The ScaffAn software allows for the first time to quantify selected parameters characterizing the preservation of lobular features and intralobular structures. Such automated analysis has not been available so far, thus ScaffAn can contribute to the standardized evaluation of decellularized scaffolds.
We incorporated ScaffAn output parameters into our multi-level scoring system, thus combining conventional semi-quantitative scoring with quantitative computer assessment. Following this approach, we expected to enhance the reliability of the morphological assessment. Furthermore, our results demonstrated that the combined system is improving the discrimination of small structural differences which cannot be distinguished using the conventional system on its own.
Our software was designed to analyze two-dimensional (2D) images from stained histological sections. This approach might be seen as not taking the 3D nature of the scaffold into account. However, the nature of the assessed parameters stemming directly from the 3D scaffold structure (e.g. sinusoidal network branching) and the option of the analysis of multiple sections from the same sample allow to compensate this shortcoming. Thus, we believe that the advantage of having a fast and easily applicable tool to assess scaffold quality in 2D outweighs the potentially missing additional information from other techniques.
ScaffAn was designed as an open source tool to be used and further developed by the scientific community. We believe it is suitable to serve as a basic platform that can be adapted and modified for analysis of liver scaffolds from other species, and eventually also for analysis of scaffolds from other organs. As a next step, we want to add quantitative pattern recognition analysis for replacing the conventional semi-quantitative analysis proposed here.
Our vision is to generate a universal open source tool which allows a robust qualitative and quantitative analysis of the morphological scaffold quality. While completing the first step toward this goal, we are well aware that further work is needed to include other functional assays into a detailed correlation analysis. Identification and evaluation of a set of functional parameters indicative of scaffold quality is thus the next step. Once this is achieved, the computer-based assessment can eventually save time and resources as only the good quality scaffolds should be further processed for expensive and time-consuming tests that are absolutely necessary for further development toward the repopulation of a full organ.
Conclusion
Our newly established multi-scale scoring system allows a detailed structural and ultrastructural assessment of the decellularized porcine liver scaffold. The scoring system consisting of conventional semi-quantitative histological scoring as well as computer analysis enabled a finer discrimination of scaffold quality than achieved with using the conventional and software analysis separately. The close relationship of the combined morphological score with the results of the cell adhesion assay revealed the potential of our scoring system to predict functional properties of the examined scaffold. Making our newly developed software ScaffAn available to the scientific community as an open source platform will hopefully speed up further development, particularly toward assessment of decellularized livers of other species and even other organs.
Supplemental Material
SupplementalMaterial-R-II – Supplemental material for Novel morphological multi-scale evaluation system for quality assessment of decellularized liver scaffolds
Supplemental material, SupplementalMaterial-R-II for Novel morphological multi-scale evaluation system for quality assessment of decellularized liver scaffolds by Vladimíra Moulisová, Miroslav Jiřík, Claudia Schindler, Lenka Červenková, Richard Pálek, Jáchym Rosendorf, Janine Arlt, Lukáš Bolek, Simona Šůsová, Sandor Nietzsche, Václav Liška and Uta Dahmen in Journal of Tissue Engineering
Footnotes
Acknowledgements
We would like to thank Torsten Heilmann from Avidal for his invaluable help with operating OrganOx and centrifugal pump perfusion systems.
Declaration of conflicting interests
The author(s) declared no potential conflicts of interest with respect to the research, authorship, and/or publication of this article.
Funding
The author(s) disclosed receipt of the following financial support for the research, authorship, and/or publication of this article: The work was supported by European Regional Development Fund-Project “AMTMI” (No. CZ.02.1.01/0.0/0.0/17_048/0007280) and grant UNCE/MED006 Center of Excellence (Charles University “Center of Clinical and Experimental Liver Surgery”).
Supplemental material
Supplemental material for this article is available online.
References
Supplementary Material
Please find the following supplemental material available below.
For Open Access articles published under a Creative Commons License, all supplemental material carries the same license as the article it is associated with.
For non-Open Access articles published, all supplemental material carries a non-exclusive license, and permission requests for re-use of supplemental material or any part of supplemental material shall be sent directly to the copyright owner as specified in the copyright notice associated with the article.