
Abstract
Autologous chondrocyte implantation is a cell-based therapy for treating chondral defects. The procedure begins by inserting chondrocytes into the defect region. The chondrocytes initiate healing by proliferating and depositing extracellular matrix, which allows them to migrate into the defect until it is completely filled with new cartilage. Mesenchymal stem cells can be used instead of chondrocytes with similar long-term results. The main differences are at early times since mesenchymal stem cells must first differentiate into chondrocytes before cartilage is formed. To better understand this repair process, we present a mathematical model of cartilage regeneration after cell therapy. We extend our previous work to include the cell–cell interaction between mesenchymal stem cells and chondrocytes via growth factors. Our results show that matrix formation is enhanced at early times in the presence of growth factors. This study reinforces the importance of mesenchymal stem cell and chondrocyte interaction in the cartilage healing process as hypothesised in experimental studies.
Introduction
Developing and improving upon the treatment of articular cartilage damage is a fundamental clinical problem. Articular cartilage damage occurs in several ways, from playing high-contact sport to natural wear and tear, affecting a variety of different age groups and sexes. The ability of damaged cartilage to self-repair is limited due to its avascularity and can often lead to osteoarthritis when left untreated.1,2 Almost nine million people in the United Kingdom are affected by osteoarthritis, which carries a lifetime risk in the knee of approximately 45%.3,4
Autologous chondrocyte implantation (ACI) is a commonly used cell-based therapy mainly used in the treatment of cartilage damage in the knee, first implemented clinically in 1987. 5 The treatment involves obtaining chondrocytes from a biopsy of healthy cartilage, culturing and expanding these chondrocytes in vitro for several weeks to an amount in excess of 5–10 million, 6 and a surgical implantation procedure of these cultured cells into the damaged (or defect) region.5,7 An alternate cell-based therapy, which we refer to as articular stem cell implantation (ASI), replicates the ACI procedure except that mesenchymal stem cells (MSCs) are used instead of chondrocytes. 8 The capacity of stem cells to differentiate into different cell types along with their abundance within the body and the ease with which they can be harvested makes them advantageous to be used in cell-based therapies instead of chondrocytes. Figures 1 and 2 show a cartilage defect in the knee and a schematic of the defect cross section, respectively. The diameter of the defect is about 10–20 mm and its thickness is about 2–3 mm. After debridement of the defect, chondrocytes or MSCs are implanted into the defect along the bottom and sides. The initial number of cells implanted are around 106 cells/cm2 of the defect area. 9

Arthroscopic image of a cartilage defect in the knee.

Schematic representation of a cross section of the defect. After debridement of the defect, either chondrocytes or MSCs are seeded along the defect walls.
The chondrocytes proliferate (by taking up nutrients) and migrate, in the process forming extracellular matrix (ECM) and new cartilage. In the case of MSCs, the process of forming new cartilage is initiated only after the stem cells first differentiate into chondrocytes. ECM comprises primarily water, proteoglycans such as GAGs (glycosaminoglycans) and proteins such as collagens. Chondrocytes sit within lacunae in the deepest layers of ECM and as such have limited motility within the matrix, giving rise to the poor reparative ability of articular cartilage. 10 ECM also acts as a structural component of cartilage and provides important mechanical properties. 11 The mechanical stresses generated by loading or unloading the knee joint, for example, can influence ECM production and hence the tissue’s overall structure by modulating the cell proliferation, differentiation and migration rates. 12 Growth factors, such as those from the transforming growth factor-beta (TGF-β) family, for example, TGF-β1 and bone morphogenetic protein (BMP-2), and fibroblast growth factor, FGF-1 and FGF-2, are also known to regulate cell migration, proliferation and differentiation, although their mechanisms are not clearly understood.
Recently, Wu 13 investigated the role of growth factors in a co-culture of stem cells and chondrocytes in vitro. Their findings show that when culturing a mixture of stem cells and chondrocytes, an increase in matrix deposition is observed. This increase can be approximately quantified to be 50% for a 50:50 ratio of MSCs to chondrocytes, and 30% for an 80:20 ratio in comparison with a 100% MSC seeding at 4 weeks. This increase in matrix deposition was attributed to specific growth factors produced by the stem cells and chondrocytes. They identified the growth factors to be BMP-2 and FGF-1. FGF-1 is produced by the MSCs and is shown to influence the proliferation of the chondrocyte population. On the other hand, BMP-2 is produced by the chondrocytes and is shown to induce chondrogenesis of MSCs. These two growth factors are hypothesised to mediate the mutual chondrocyte and MSC interaction as shown in Figure 3. This hypothesis assumes that the increased matrix production is explained by the increased number of chondrocytes due to the actions of both growth factors. The same authors also found evidence that FGF-1 leads to increased matrix production per chondrocyte, which could also explain the increased matrix deposition in their experiments.

Schematic representation of hypothesised cross-talking between chondrocytes and MSCs mediated by FGF-1 and BMP-2.
In humans, many details of tissue regeneration after surgical cell implantation are unknown. The only detailed data currently available are from magnetic resonance imaging (MRI) scans and 1-year biopsies which show the condition of the cartilage. 14 Some insight into cartilage healing can be obtained from animal models. 15 Characterising the success of the surgery is closely linked to the structural composition of the regenerated tissue. 16 However, there is little information on the cell-to-cell interactions which lead to the development and regeneration of the tissue. In this respect, theoretical models of tissue regeneration have contributed significantly to the understanding of the cell-to-cell interactions and other contributing factors influencing the healing process.
In our previous work, 17 a mathematical model was formulated to describe the various processes involved in the regeneration of a cartilage defect following the implantation of chondrocytes (ACI) or MSCs (ASI). Our model showed that during the healing process, there is very little difference in the overall time taken to heal the defect between the two cell therapies, suggesting that regeneration using stem cells alone is no better or worse than that using chondrocytes. The stem cells need to first differentiate into chondrocytes before forming ECM and new cartilage, a process that is initiated only after the stem cell density exceeds a threshold value. The overall healing time frame of about 18 months for the defect to reach full maturation corresponds with results from clinical studies and demonstrated that cartilage regeneration is a slow process. The only stem cell–chondrocyte interaction considered in this work was the one-way interaction in which MSCs differentiated to form chondrocytes once a threshold stem cell density was exceeded. This work did not include the influence of growth factors, as well as MSC–chondrocyte interaction. Related modelling studies have highlighted the importance of growth factors and MSC–chondrocyte interactions. Kimpton et al. 18 showed how different cell seeding strategies and growth factors effect the spatial distribution of cells within a hydrogel inserted into a chondral defect. Chen et al. 19 explored the interactions between MSCs, chondrocytes and TGF-β. They demonstrated how adopting this strategy combining growth factors produced by the cells and exogeneous addition of growth factors has advantages over each individual strategy. More relevant to our work is the mathematical model of fracture healing by Bailon-Plaza and van der Meulen. 20 They demonstrated the mediating effects of BMP-2 and TGF-β1 on the chondrocyte–osteoblast interaction and their influence on the bone regeneration during fracture healing.
In the literature, there are an abundance of theoretical models for tissue regeneration, taking either a discrete or continuum approach to modelling. We formulate our model using a continuum approach due to the high cell densities used in the surgical procedure (above a few million). Sherratt and Murray 21 present a reaction–diffusion mathematical model on epidermal wound healing, using their results to validate that biochemical regulation is a key mechanism in wound regeneration. Olsen et al. 22 assess the ECM involvement in tumour angiogenesis using a standard continuum modelling framework. Other examples of continuum reaction–diffusion-type equations can be found in the works by Bailon-Plaza and van der Meulen 20 and Obradovic et al. 23 Using these modelling approaches as motivation, we formulate our model using reaction–diffusion-type equations. This allows us to model migration of cells as a diffusive process and the differentiation, proliferation and death of cells as reaction terms. This modelling approach also allows for the uptake of nutrients by the cells to initiate proliferation, with nutrient uptake rates modelled following Michaelis–Menten kinetics. As in our previous work, 17 we focus our modelling on ECM production via stem cell differentiation to chondrocytes and chondrocyte proliferation. Cell behaviour is regulated by nutrients available within the defect, which in our case is oxygen. Cell proliferation and differentiation are influenced by the growth factors. We consider FGF-1 and BMP-2, which we subsequently anticipate will effect matrix deposition.
The primary focus of this article, encouraged by the findings of Wu, 13 is to investigate the role of growth factors and MSC–chondrocyte interactions in the regeneration of cartilage after stem cell implantation (ASI). Once stem cells differentiate into chondrocytes, we can expect to see the same cell-to-cell interaction observed in co-cultures of MSCs and chondrocytes with similar trophic effects. 13 In the second part, we consider a co-implantation of MSCs and chondrocytes to see how this impacts matrix deposition compared with ACI and ASI cell therapies, motivated by a potentially earlier healing time. To achieve this, we first seek to address the specific question of the impact of growth factors, released via cell-to-cell interaction, on the deposition of matrix during chondral healing. Co-implantation of MSCs and chondrocytes could have important implications on how clinicians approach surgical procedures of the regeneration of cartilage, indicating that a potentially superior procedure could be implemented involving a mixture of MSCs and chondrocytes. We extend our previous model 17 to include the actions of growth factors BMP-2 and FGF-1 and investigate their mediating role on chondrocyte and MSC interaction hypothesised by Wu 13 and shown in Figure 3. Including their proposed stem cell–chondrocyte interaction into our model would also enable validation of the enhanced matrix levels observed. 13
The plan of the article is as follows. In the ‘Mathematical model’ section, we describe the basic model and the assumptions made, the boundary and initial conditions used, estimates of the parameter values and the scalings used to non-dimensionalise the equations. The results of our simulations are discussed in the ‘Results’ section, for two cases in which no, either or both growth factors are present and their comparison. Results showing sensitivity to certain parameters are also shown here. Finally, in the ‘Discussion’ section, we examine the implications of the model results on ACI therapy and future work.
Mathematical model
Formulation
A typical catilage defect has a small thickness depth to length ratio. This enables us to simplify to a one-dimensional problem where cell growth is modelled along the defect thickness only, shown as the x-direction in Figure 2. The variables in our model are as follows: the stem cell density,
We follow the model of Lutianov et al. 17 to describe the evolution of the cell and matrix densities and nutrient concentration in time, t, and space, x, measured along the thickness of the defect (see Figure 2). We state with brief comments the equations and refer the interested reader to Lutianov et al. 17 for further details of modelling choices. We focus on the evolution of the growth factor concentrations FGF-1 and BMP-2 and their coupling to the chondrocyte proliferation and stem cell differentiation, respectively.
The rate of change of stem cell density, based on proliferation by uptake of nutrients, migration and differentiation into chondrocytes, is modelled as follows

The third term on the right of equation (1) models stem cell differentiation into chondrocytes at a rate

where
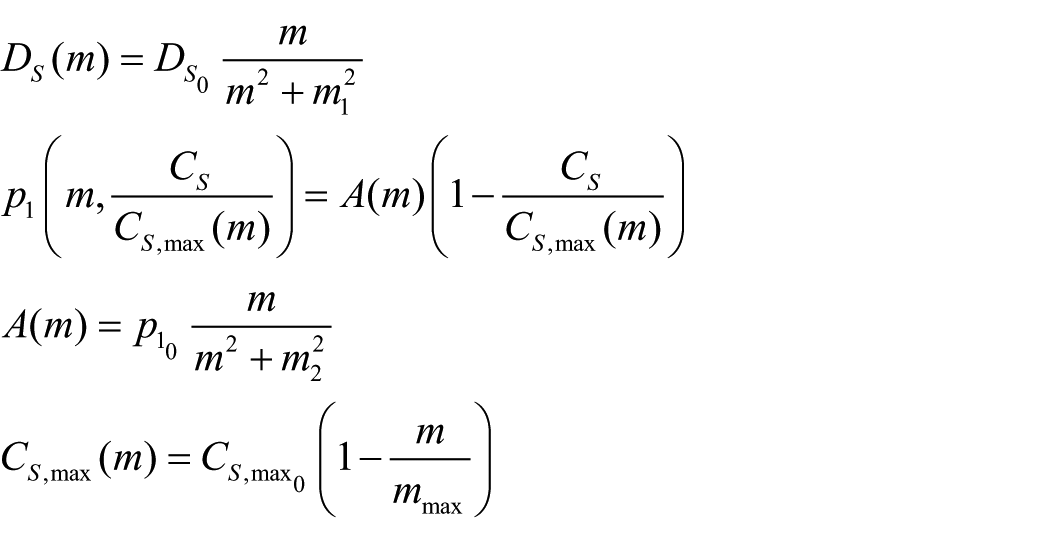
where
Similar to the above, the rate of change of chondrocyte density is modelled as follows
where

where
Estimated values of dimensional parameters.

In the above,
The rate of change of nutrient concentration and matrix density are as given with full modelling justification in the work by Lutianov et al. 17 with minor changes made to our m equation. The rate of change of nutrient concentration is modelled by a Fickian-type diffusion term with nutrient uptake terms proportional to chondrocyte and stem cell densities, with a Michaelis–Menten-type nutrient saturation. The rate of change of matrix density similarly comprises a diffusion term, a production term proportional to the chondrocyte density that is limited by a Michaelis–Menten-type nutrient saturation term


where
The growth factor FGF-1 is produced by the stem cells; it migrates along the defect, degrades and then diffuses out of the upper end of the defect. Using this information, we model the rate of change of FGF-1 as follows

The first term on the right of equation (6) models diffusion of FGF-1 along the defect, with
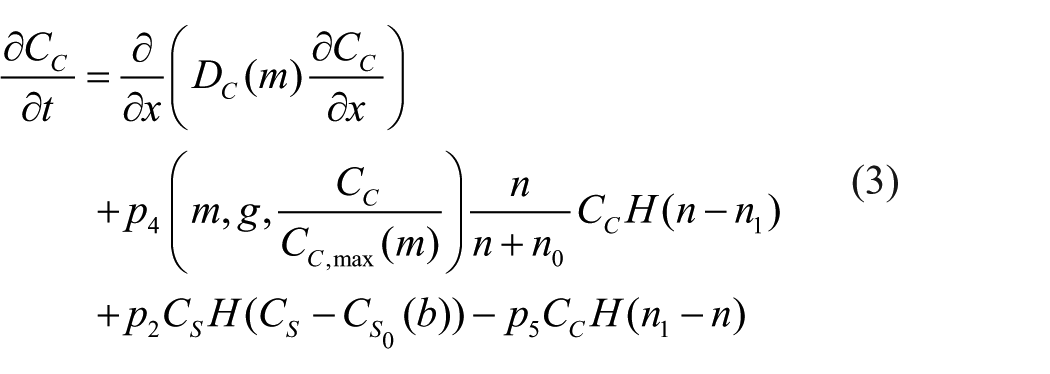
The growth factor BMP-2 is produced by the chondrocytes; it can migrate along the defect and degrades. Using this information, we model the rate of change of BMP-2 as follows

The first term on the right of equation (7) models diffusion of BMP-2 along the defect, with
Boundary conditions
We need to prescribe two boundary conditions for each variable. These boundary conditions are specified at the lower end of the defect, x = 0 (subchondral bone interface), and upper end of the defect, x = d (normal cartilage surface), where d is the thickness of the defect. At

At
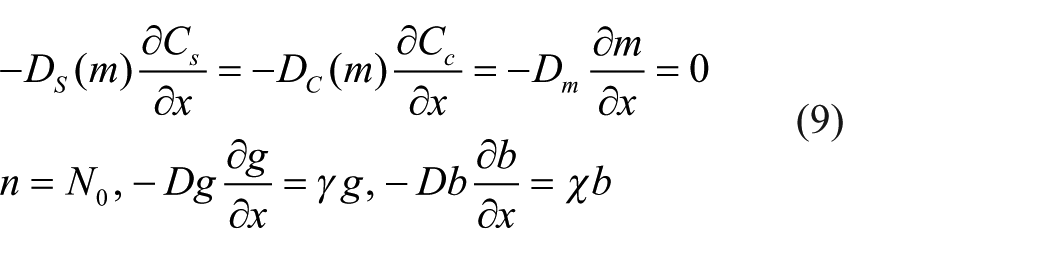
The first, second and third boundary conditions represent no flux of stem cells, chondrocytes and matrix, respectively, from the normal cartilage interface. We assume that a reservoir of nutrients with concentration,
Initial conditions
The initial conditions at

Here,
Non-dimensionalisation
There are several dimensional parameters appearing in the model. Their estimated values and the references from which they are obtained are provided in Table 1. All approximated parameters are disclosed in the table and references are given where available.
We non-dimensionalise equations (1)–(10) by introducing the following dimensionless variables based on characteristic quantities for each variable

where the overbars represent dimensionless quantities. The characteristic quantities used to measure the spatial variable, x; cell densities, matrix density and nutrient and growth factor concentrations are the defect thickness, d; the reference maximum total cell density,
Estimated values of dimensionless parameters.

The dimensionless equations using the above non-dimensionalisation are as follows


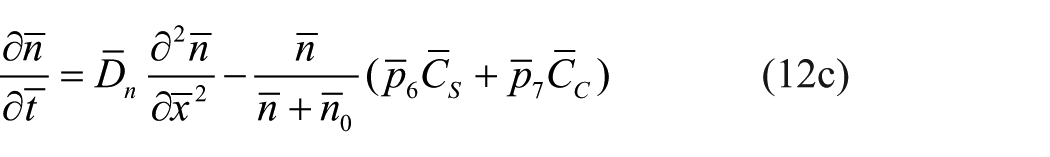


where

The non-dimensional boundary and initial conditions are as follows


The dimensionless parameters and their estimated values are provided in Table 2.
Results
We use a second-order accurate finite difference discretisation scheme to discretise the spatial variable x in equations (12)–(14), keeping the time derivative t continuous. The resulting ordinary differential equations are solved in MATLAB (Release 2013a; The MathWorks, Inc., Natick, MA, USA) using the stiff ODE solver ode15s. We refer the reader to Table 2 for information on parameter values.
We first consider the case where the defect is only seeded with stem cells and there are no growth factors present. These results will be used as a baseline case to compare with the case which includes the influence of growth factors. We re-run these simulations from Lutianov et al., 17 where a flux of MSCs entering from the bottom of the defect, thought to be sourced by the surrounding defect, was considered. Here, we omit this flux, as clinical guidelines state the underlying subchondral bone of a chondral defect is to be left intact, meaning we would not necessarily observe this flux. 7
Initially, stem cells are seeded close to the subchondral bone side of the defect

Evolution of cell and matrix densities and nutrient concentration at t = 0 days, 2 months, 3 months.

Evolution of cell and matrix densities and nutrient concentration at t = 6, 9 and 18 months.
We now consider the influence of growth factors FGF-1 and BMP-2 on the evolution of the cell and matrix densities. We have an initial seeding of stem cells at the bottom of the defect with a small concentration of both the growth factors

Evolution of cell and matrix densities and nutrient and growth factor concentrations at t = 0 days, 2 months, 3 months.

Evolution of cell and matrix densities and nutrient and growth factor concentrations at t = 6, 9 and 18 months.

Comparison of (a) stem cell, (b) chondrocyte and (c) matrix densities at t = 2 months when including FGF-1 and BMP-2 (dot-dashed lines), BMP-2 alone (dotted lines), FGF-1 alone (dashed lines) and no growth factors (solid lines).
We now highlight the differences at early time observed in the cell and matrix densities in the two sets of simulations above. We pick a representative time point at t = 2 months to depict this. We will also look at cases where either FGF-1 or BMP-2 alone is included to determine which growth factor has a stronger influence, if at all, on the system. In Figure 8(a), we observe that the stem cell density near the bottom of the defect is lower when growth factors are included. This suggests that stem cell differentiation has occurred earlier for this case due to the lowering of the threshold density. The higher level of stem cell density for the case when growth factors are absent implies delay in stem cell differentiation due to the threshold density not being exceeded. Looking at the chondrocyte levels in Figure 8(b), we observe that including growth factors results in a slightly higher chondrocyte density near the bottom of the defect compared to that without growth factors. These additional chondrocytes are produced by stem cell differentiation which occurs earlier in the presence of growth factors. This increase in chondrocyte density results in a significantly larger amount of matrix being formed compared to that without growth factors (Figure 8(c)). Moreover, there is no discernible difference in the cell and matrix densities when comparing the cases where both growth factors are included to that where BMP-2 alone is included. This indicates that BMP-2 alone has a much more significant influence on the system than FGF-1 alone at least at early time. This is mainly due to the lowering of the threshold density for stem cell differentiation into chondrocytes. However, at later time, this influence gradually decreases as the stem cell density falls well below its minimum threshold density for differentiation. Past 4 months, the system then evolves similar to that without growth factors.
To further highlight the effects of FGF-1 and BMP-2 on the system, we show comparisons of the overall densities of chondrocytes,
These results allow us to quantify the percentage difference between the cell and matrix types, with and without the effects of growth factors, enabling us to quantify our specific research question posed in the ‘Introduction’ section. This gives us an indication of how considering these growth factors in a co-culture will impact matrix deposition.
Figure 9(a) shows overall matrix densities between 1 month and 2 years in time increments of 1 month. From this figure it is clear that the main difference in matrix densities is at early times, with effects seeming to subside after around 4–5 months. At 2 months, we have a 65% increase in matrix density when growth factors are included, declining to 34% increase at 4 months. From 4 months onwards, the percentage change of matrix density is still greater with growth factors, but decreases in magnitude.

Mean densities of (a) matrix, m; (b) chondrocytes, CC ; and (c) MSCs, CS, as a function of the time, in months, from 1 to 24 months for simulations with (orange) and without (blue) growth factors.
Figure 9(b) shows the difference in chondrocyte levels within the defect up to 24 months. Chondrocyte proliferation and MSC differentiation into chondrocytes are mechanisms both effected by the growth factors, meaning we expect to see a pronounced increase in this cell type in the defect during healing. At 2 months, we see a 66% increase in chondrocyte levels, declining to only a 19% increase at 4 months. The main increase in overall chondrocyte densities is primarily observable up to 4 months and subsides thereafter.
Figure 9(c) shows MSC densities within the defect over 2 years. The stem cell differentiation into chondrocytes mechanism is directly effected by BMP-2, meaning we expect to see lower MSC levels in the defect at times that growth factors are most effective. At 1–3 months, we see a slight increase in overall MSC levels, but Figure 8(a) shows a diffusion front of MSCs forming sooner than without growth factors at 2 months due to the effects of FGF-1 and BMP-2. This indicates that MSC differentiation has been initiated sooner. In addition, at this time, chondrocyte densities are markedly higher than without growth factors (Figure 8(b)), meaning more BMP-2 is being produced. This implies evolution of MSCs is accelerated due to the effects of the growth factors during this time frame. At 4 months, we see a 13% decrease in MSC density, which is due to BMP-2 effects increasing due to increased chondrocyte densities around this time. After 4 months, a consistent trend of lower MSCs is observed in the defect for the case with growth factors.
These results indicate and validate that the time frame for FGF-1 and BMP-2 effects to be significant is at early times primarily up until 4 months. The effects of growth factors subside thereafter, as demonstrated by the similarity between Figures 5 and 7. The experiments of Wu. 13 are in vitro and therefore performed over short periods of time. This therefore corroborates the effects they observe. It is likely that the effects of FGF-1 and BMP-2 decline due to other limiting factors in the model such as nutrient concentration and motility of cells (Figures 6 and 7).
Sensitivity of parameters and initial conditions
The model is used to simulate a variety of parameter values and initial conditions. A sensitivity analysis will help in pinpointing those parameters that the system is sensitive to, which could indicate biological significance. In addition, a parameter whose value has been approximated and not deemed to be sensitive to change indicates that this approximate value is a good representation of that parameter value. Here, we only consider the sensitivity of the model to variations in the FGF-1 and BMP-2 parameters and initial conditions. These are described briefly in Table 3 and the ones which most influenced model results are discussed in detail below. The sensitivity to the other parameters and initial conditions are similar to that discussed by Lutianov et al. 17 and we refer the reader to Table 3 in this article.
Sensitivity of parameters.

Those highlighted in bold are further described in the text.
We described earlier that the increased levels of chondrocyte and matrix densities observed at early time in the presence of growth factors were primarily due to the reduction in the threshold stem cell density for differentiation into chondrocytes (Figure 8(a)–(c)). We have further investigated variations in the parameters we found that this reduction was most sensitive to the BMP-2 growth factor production constant,
Figure 10(a)–(c) shows the stem cell, chondrocyte and matrix density, respectively, at t = 2 months by varying

Comparison of (a) stem cell, (b) chondrocyte and (c) matrix densities at t = 2 months when varying the BMP-2 growth factor production constant,
An alternative method to implement the effect of BMP-2 on stem cell differentiation is to vary the stem cell differentiation rate,
Our sensitivity indicates that the values we have approximated are also not extremely sensitive to change and hence a good representation of that parameter value. Identifying the sensitive parameters from the sensitivity analysis could provide important information for in vitro studies, indicating which mechanisms need to be focused on or manipulated experimentally to produce a desired effect, such as increased cell and/or matrix densities.
Discussion
We have extended the model proposed by Lutianov et al. 17 to consider the influence of two growth factors, BMP-2 and FGF-1, on the regeneration of a cartilage defect. These two growth factors serve as examples that embody the type of interactions that can occur between MSCs and chondrocytes, which would typically affect stem cell and chondrocyte proliferation, differentiation and matrix production. The interactions in our model are those hypothesised by Wu, 13 which they formulated on basis of their and others’ experimental data. Our simulations show that the interactions from the growth factors enhance matrix production at early times. This is consistent with in vitro results of Wu, 13 whose findings show increased GAG levels in co-culture pellets of MSCs and chondrocytes up to 4 weeks after culture, indicative of increased matrix deposition. Of course, unlike the co-culture experiments which start with a mixture of stem cells and chondrocytes, our initial conditions represented implantation of only stem cells. However, once stem cells differentiated into chondrocytes in our model, they displayed the same stem cell–chondrocyte interaction observed in the co-culture experiments with similar trophic effects. 13
Our model considered two cell types, MSCs and chondrocytes, and therefore studied the actions of the two growth factors within these restrictions. However, it is important to realise that the growth factors probably also play a role beyond these two cell types. Besides promoting chondrogenic differentiation of MSCs, BMP-2 can also induce chondrocyte hypertrophy and lead to endochondral ossification. FGF-1, along with other members of the FGF family, is thought to enhance collagen 1 expression leading to a fibrous cartilage being formed during chondral healing. It is hypothesised that when FGF-1 and BMP-2 are both present during the healing process, chondrocyte hypertrophy and fibrocartilage formation are not observed in the defect, indicating that FGF-1 suppresses the hypertrophy and BMP-2 inhibits the formation of fibrous cartilage. 13 These functions indicate that both growth factors are involved in aspects of the healing process that we did not consider in this model, specifically chondrocyte hypertrophy and endochondral bone formation. In further work, we plan to extend our model to study these aspects. However, chondrocyte hypertrophy and endochondral bone formation have not been flagged as adverse effects after autologous stem cell or chondrocyte implantation to treat chondral defects, suggesting that with respect to the clinical application of these therapies, our model may be considered representative. 8
Our model allowed us to investigate the influence of either growth factor, independent of the other. This enabled us to determine the sensitivity of stem cell–chondrocyte interaction to each growth factor. The results obtained when including only BMP-2 were very similar to those including both FGF-1 and BMP-2, both showing clearly increased matrix production at early time points. On the other hand, for the case where only FGF-1 was included, the matrix density levels at early times were increased only marginally when compared to the baseline case of no growth factors. This suggests that BMP-2 dominates the interaction and that the main positive effect of a mixture of the two cell types is due to enhanced chondrogenesis.
Our model found that the influence of chondrocytes on stem cell differentiation through BMP-2 affected the result more than the influence of stem cells on chondrocyte proliferation via FGF-1. This may be related to the effects of nutrient concentration in our model, which did influence chondrocyte proliferation but did not directly influence stem cell differentiation, though a knock-on effect would be expected from nurtient’s limiting effect on stem cell proliferation, but we would not expect this effect to be significant in our simulations due to a 100% MSC cell seeding. The lack of effect of FGF-1 could potentially indicate the initial growth factor concentration and rates we have selected from the literature are contentious, but our sensitivity analysis indicates that these parameters are not sensitive to change. This enables us to make the assumption our parameters are within a realistic biological range of which FGF-1 is effective. In our model, a lower nutrient concentration reduced or, if below the threshold nutrient concentration, completely stopped chondrocyte proliferation. We think this may explain why the effects of FGF-1 were relatively small, because in all our simulations, the nutrient concentration seems to be the main limiting factor. That nutrient concentration influences chondrocyte proliferation and has been demonstrated experimentally. 25 In contrast, stem cell differentiation was not affected by nutrient concentration in our model, and as a result, a low nutrient concentration did not inhibit the effects of BMP-2. We are not aware of experimental studies addressing effects of nutrition on MSC differentiation into chondrocytes, but one study extensively addressed this issue related to osteoblast differentiation. 26 This study concluded that during three-dimensional (3D) micromass culture (a situation comparable to the one in our model) osteoblast differentiation was not affected by nutrition but was a function of cell–cell contacts and cell–cell communication, exactly the phenomena we included in our model.
In our model, the influence of BMP-2 on stem cell differentiation was implemented through a lowering of the threshold stem cell density
Our model used two specific growth factors, BMP-2 and FGF-1, to investigate the interactions between MSCs and chondrocytes during cartilage repair following cell implantation. However, we should stress that our results are not limited to these two. We see these two growth factors as examples of how such interactions could occur. For instance, some experiments have found evidence that the influence from chondrocytes on stem cell differentiation acts via direct cell–cell contact instead of soluble factors or that other growth factors might be involved (see the work by Wu 13 for an overview). A similar situation exists in relation to the influence of stem cells on chondrocyte proliferation. Nevertheless, whatever the precise mode through which the interaction occurs, the main aspect will always be that chondrocytes influence stem cell differentiation and stem cells influence chondrocyte proliferation. Although our model may therefore not capture all details, it does certainly capture the gist of the interaction between the two cell types and we therefore think that its broad conclusions are still relevant if the details may be incorrect.
Our model enables us to better understand the underlying mechanisms taking place during chondral healing when we consider the effects of growth factors. This model can be used as an informative tool for clinicians and experimentalists alike, giving insight into the effects of the growth factors FGF-1 and BMP-2 on chondrocyte proliferation and MSC differentiation. This work provides insight regarding the clinical significance of the mechanisms involved in the FGF-1–BMP-2 feedback loop without requiring experimentation, also enabling us to identify with ease the most effective growth factor in our model. Our sensitivity analysis demonstrates that increasing FGF-1 and BMP-2 will have minor effect due to limiting factors such as nutrient concentration and growth factor degradation. Our results also provide corroboration for experimental work already undertaken. 13
The consideration of growth factors and their mediating influence on cell-to-cell interactions is an important step towards looking at more complex models such as implantations of a mixture of cells. The work by Wu 13 shows how inserting a mixture of stem cells and chondrocytes together into a defect can promote matrix deposition, and therefore a faster healing time due to the trophic effects growth factors such as BMP-2 and FGF-1 have on the system. This currently is being investigated and will be published in the second part of this article.
Footnotes
Declaration of conflicting interests
The author(s) declared no potential conflicts of interest with respect to the research, authorship and/or publication of this article.
Funding
The author(s) disclosed receipt of the following financial support for the research, authorship and/or publication of this article: We are grateful to Keele University (ACORN fund) and the AR-UK Tissue Engineering Centre (grant no. 21156) for supporting this work, which forms part of Kelly Campbell’s PhD research.