
Abstract
We present a mathematical model of cartilage regeneration after cell therapy, to show how co-implantation of stem cells (mesenchymal stem cells) and chondrocytes into a cartilage defect can impact chondral healing. The key mechanisms involved in the regeneration process are simulated by modelling cell proliferation, migration and differentiation, nutrient diffusion and Extracellular Matrix (ECM) synthesis at the defect site, both spatially and temporally. In addition, we model the interaction between mesenchymal stem cells and chondrocytes by including growth factors. In Part I of this work, we have shown that matrix formation was enhanced at early times when mesenchymal stem cell-to-chondrocyte interactions due to the effects of growth factors were considered. In this article, we show that the additional effect of co-implanting mesenchymal stem cells and chondrocytes further enhances matrix production within the first year in comparison to implanting only chondrocytes or only mesenchymal stem cells. This could potentially reduce healing time allowing the patient to become mobile sooner after surgery.
Introduction
Autologous chondrocyte implantation (ACI) is the most commonly used cell-based therapy to treat chondral defects. 1 The treatment comprises obtaining chondrocytes from a small harvest of healthy cartilage, a period of culturing the chondrocytes to expand their numbers, and implantation of these cells into the defect under a membrane. It does have some drawbacks, in particular the need for an extra knee surgery procedure to harvest the chondrocytes, difficulties in obtaining an adequate number of chondrocytes and donor site morbidity. 2 Mesenchymal stem cells (MSCs) are increasing in popularity as a cell source for regenerative medicine approaches for cartilage regeneration, such as cell implantation to treat articular cartilage defects of the joints. 3 The benefits of using MSCs instead of chondrocytes have been well documented, including their larger availability within the body and their ability to undergo chondrogenesis and deposit matrix under the influence of growth factors. 4
An alternative cell-based therapy, denoted here as articular stem cell implantation (ASI), reproduces the approach of culture expansion and implantation, except MSCs are used instead of chondrocytes. 2 Lutianov et al. 5 developed a mathematical model to simulate and compare the repair of a chondral defect with new cartilage following implantation of either chondrocytes (ACI) or MSCs (ASI) along the bottom of the defect. This model assumed that following implantation, MSCs only contributed to cartilage formation via their differentiation into chondrocytes. One difference between ACI and ASI according to this model was that cartilage formation after ASI started later than after ACI. As is now widely recognised, MSCs used in this way do not only contribute to the repair process via their differentiation into chondrocytes but also via their secretion of growth factors and cytokines, termed as their ‘trophic’ effect.6,7 Work by Wu 8 identifies two growth factors, Fibroblast Growth Factor 1 (FGF-1) and Bone Morphogenetic Protein 2 (BMP-2), as particularly important during cartilage regeneration. These two growth factors were identified when investigating the effect of co-cultures of MSCs and chondrocytes on cartilage formation. 8 They are released by MSCs and chondrocytes and mediate MSC-to-chondrocyte interaction, enhancing chondrocyte proliferation and MSC chondrogenesis (see Figure 3 for a schematic of this cell-to-cell interaction in Part I of our work 9 ). Their observations were modelled mathematically in Part I, which studied the effects of these growth factors after MSC implantation (ASI) into the defect. 9 Our simulations showed that matrix formation following ASI was enhanced at early times when cell-to-cell interactions mediated by these growth factors were taken into account. This was mainly due to the presence of BMP-2, resulting in increased formation of chondrocytes via increased chondrocyte proliferation and MSC chondrogenesis, and hence enhancing early matrix production in comparison to the case when no growth factors are present. At later time points, no differences were found.
Several in vitro studies have suggested that co-culturing a mixture of MSCs and chondrocytes increases matrix formation.7,10,11 In these mixtures, the chondrocytes could immediately start forming cartilage, and trophic effects due to the growth factors released in the system would boost this effect further. 8 However, these in vitro studies are, by necessity, short-term studies, and it is therefore not clear how these differences develop in the longer term if they are maintained. To our knowledge, the only in vivo study used a rat model and found no difference in quality of cartilage defect repair 12 weeks after implanting scaffolds with either a 90:10 MSC:chondrocyte mixture or pure chondrocytes but did not study other time points. 12
In Part II of our work, we aim to explore the longer term patterns over time of cartilage defect healing following implantation of mixtures of MSCs and chondrocytes at various ratios, and investigate the differences between them. The plan of the article is as follows. In the section ‘Mathematical model’, we state the model equations, boundary and initial conditions. Next, section ‘Results’ shows the results of simulations for five co-implantation ratios and their comparison with respect to matrix density levels over healing time. Results showing sensitivity to variations in co-implantation ratios are also considered here, in particular, comparisons are made with 100% stem cell (ASI) and 100% chondrocyte (ACI) implantations. Finally, section ‘Discussion’ explores the implications of the model results on co-culture cell therapy and future work. We refer the interested reader to Campbell et al. 9 where full details of non-dimensionalisation and a sensitivity analysis of the model has been conducted, which will not be shown here.
Mathematical model
Our mathematical model follows the same formulation as our earlier work 9 with the initial cell implantation profile changed to accommodate a varying ratio of stem cells and chondrocytes. We only state the dimensionless equations, and boundary and initial conditions here. For more information on the formulation and non-dimensionalisation of these equations and assumptions made, the reader is referred to Campbell et al. 9 and Lutianov et al. 5
We consider a cartilage defect with a small depth to diameter ratio (see Figure 1) which enables us to simplify to a one-dimensional problem where cell growth is modelled along the defect depth
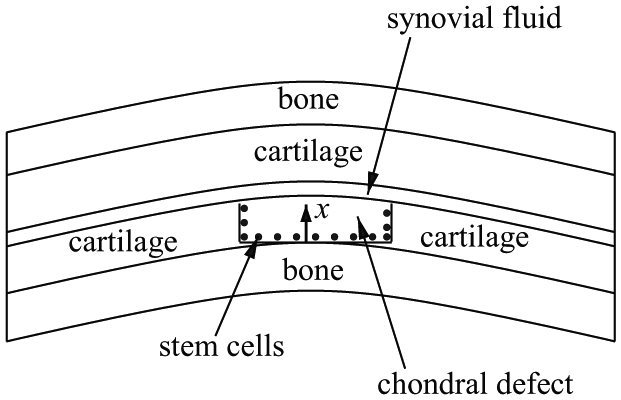
Schematic cross-section of a chondral defect. The thickness along the defect is labelled
Following the non-dimensionalisation given in Campbell et al.
9
and provided in Appendix 1, the dimensionless equations (overbars omitted), boundary and initial conditions for the evolution of the cell and matrix densities and nutrient concentration in time,

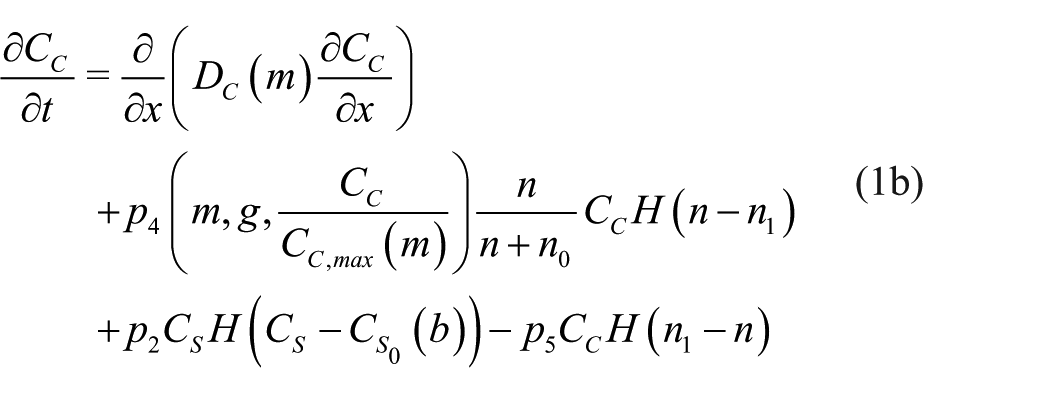


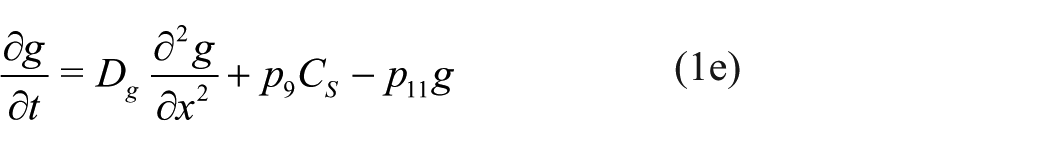

where

The estimated values of the parameters in dimensional form and the dimensionless parameters are provided in Appendix 1 (Tables 1 and 2) and Campbell et al. 9
The non-dimensional boundary and initial conditions are


with
The new initial conditions representing the different co-culture ratios of stem cells and chondrocytes are highlighted in bold in equation (3). Here,
We used a second-order accurate finite difference scheme to discretise the spatial derivatives in
The initial stem cell and chondrocyte density spatial profile is
The general evolution characteristics of the cell and matrix densities, nutrient and growth factor concentrations using this model are described in Part I of this work Campbell et al.
9
and in Lutianov et al.
5
and hence are not repeated in detail here. The main focus of our simulations is to vary the initial stem cell and chondrocyte implantation densities through the parameter
We simulate cartilage repair following implantation of five mixtures, namely,
Results
Co-implantation of 90% stem cells and 10% chondrocytes
We first show the simulations corresponding to

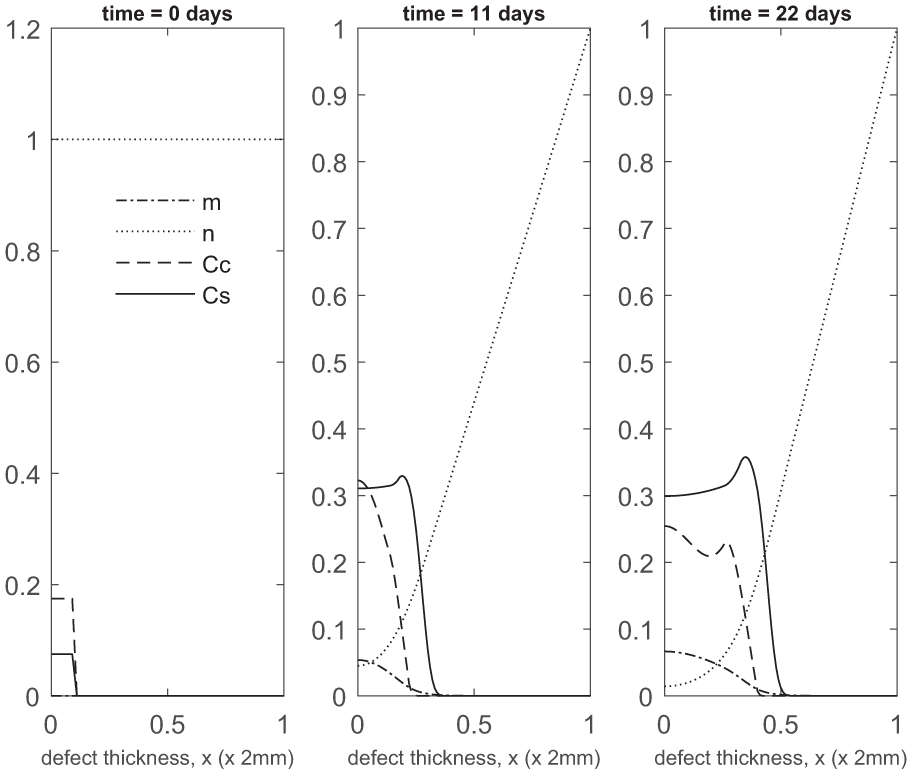
Evolution of cell and matrix densities, and nutrient concentration at times t = 0, 11 and 22 days following co-implantation of 90% stem cells and 10% chondrocytes.
Over the course of the first few months, chondrocyte density is generally larger in the co-implantation case compared to the 100% stem cell and 100% chondrocyte implantation cases (compare Figure 3 with Figure 5 in Campbell et al.
9
and Figure 3 in Lutianov et al.
5
). This larger chondrocyte density comes not only with increased matrix production but also with increased uptake of nutrients. The latter results in a drop of chondrocyte density towards the bottom of the defect once the nutrient concentration falls below the minimum threshold level
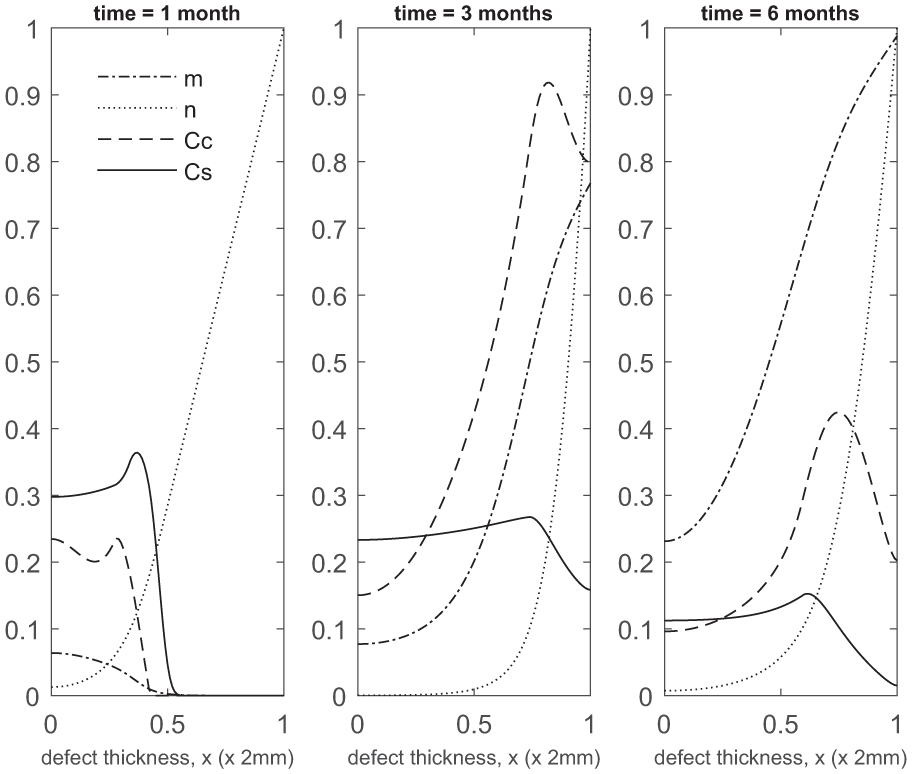
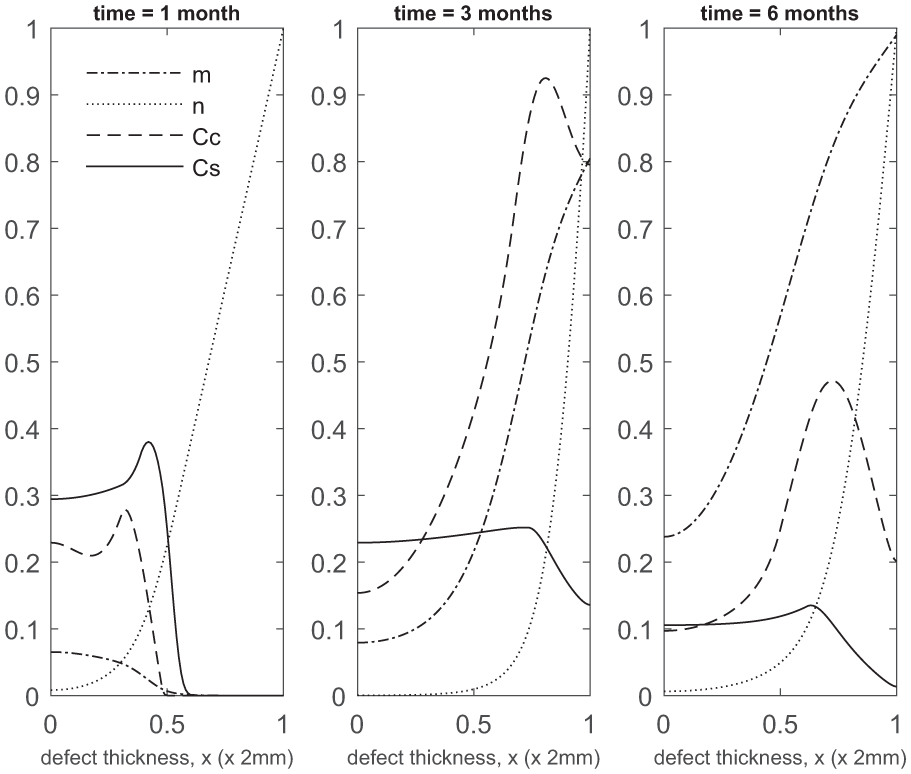
Evolution of cell and matrix densities, and nutrient concentration at times t = 1, 3 and 6 months following co-implantation of 90% stem cells and 10% chondrocytes.
At later times (Figure 4), matrix deposition slows down and the defect fills up in 18 to 24 months. This timescale is similar to the two single-cell-type implantation cases (Figure 4 in Lutianov et al. 5 and Figure 6 in Campbell et al. 9 ).

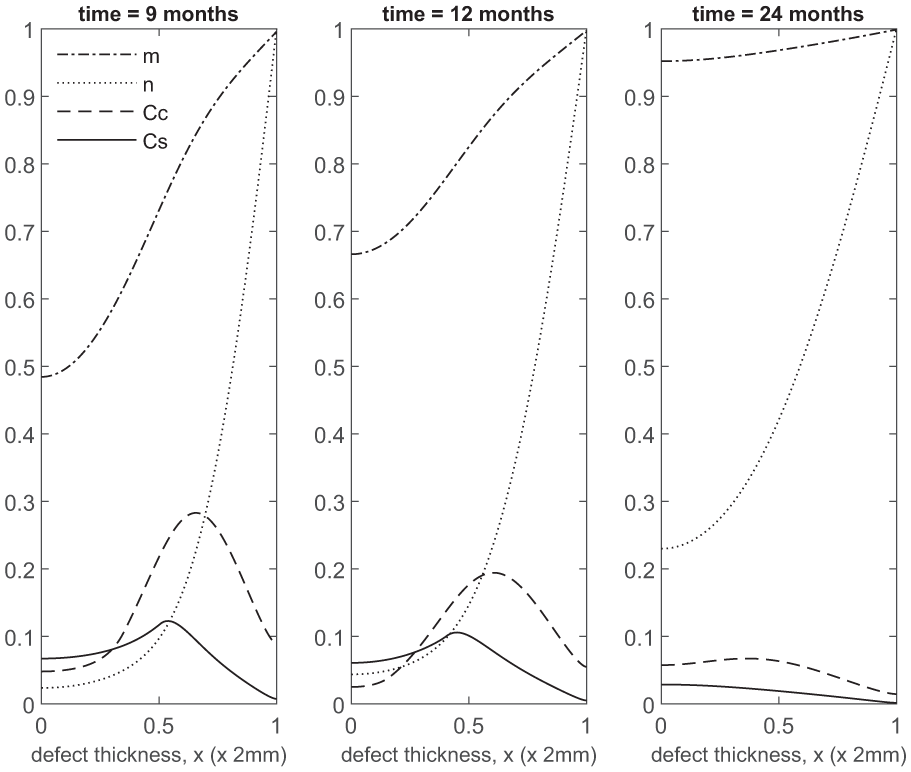
Evolution of cell and matrix densities, and nutrient concentration at times t = 9, 12 and 24 months following co-implantation of 90% stem cells and 10% chondrocytes.
Co-implantation of 70% stem cells and 30% chondrocytes
Next we show simulations of

Evolution of cell and matrix densities, and nutrient concentration at times t = 0, 11 and 22 days following co-implantation of 70% stem cells and 30% chondrocytes.
Evolution of cell and matrix densities, and nutrient concentration at times t = 1, 3 and 6 months following co-implantation of 70% stem cells and 30% chondrocytes.

Evolution of cell and matrix densities, and nutrient concentration at times t = 9, 12 and 24 months following co-implantation of 70% stem cells and 30% chondrocytes.
Co-implantation of 50% stem cells and 50% chondrocytes
We next show the simulations corresponding to

Evolution of cell and matrix densities, and nutrient concentration at times t = 0, 11 and 22 days following co-implantation of 50% stem cells and 50% chondrocytes.

Evolution of cell and matrix densities, and nutrient concentration at times t = 1, 3 and 6 months following co-implantation of 50% stem cells and 50% chondrocytes.

Evolution of cell and matrix densities, and nutrient concentration at times t = 9, 12 and 24 months following co-implantation of 50% stem cells and 50% chondrocytes.
Co-implantation of 30% stem cells and 70% chondrocytes
Figures 11–13 show cell and matrix densities, and nutrient concentration for
Evolution of cell and matrix densities, and nutrient concentration at times t = 0, 11 and 22 days following co-implantation of 30% stem cells and 70% chondrocytes.

Evolution of cell and matrix densities, and nutrient concentration at times t = 1, 3 and 6 months following co-implantation of 30% stem cells and 70% chondrocytes.

Evolution of cell and matrix densities, and nutrient concentration at times t = 9, 12 and 24 months following co-implantation of 30% stem cells and 70% chondrocytes.
Co-implantation of 10% stem cells and 90% chondrocytes
We finally show the results for a 90% chondrocyte and 10% MSC mixture corresponding to

Evolution of cell and matrix densities, and nutrient concentration at times t = 0, 11 and 22 days following co-implantation of 10% stem cells and 90% chondrocytes.
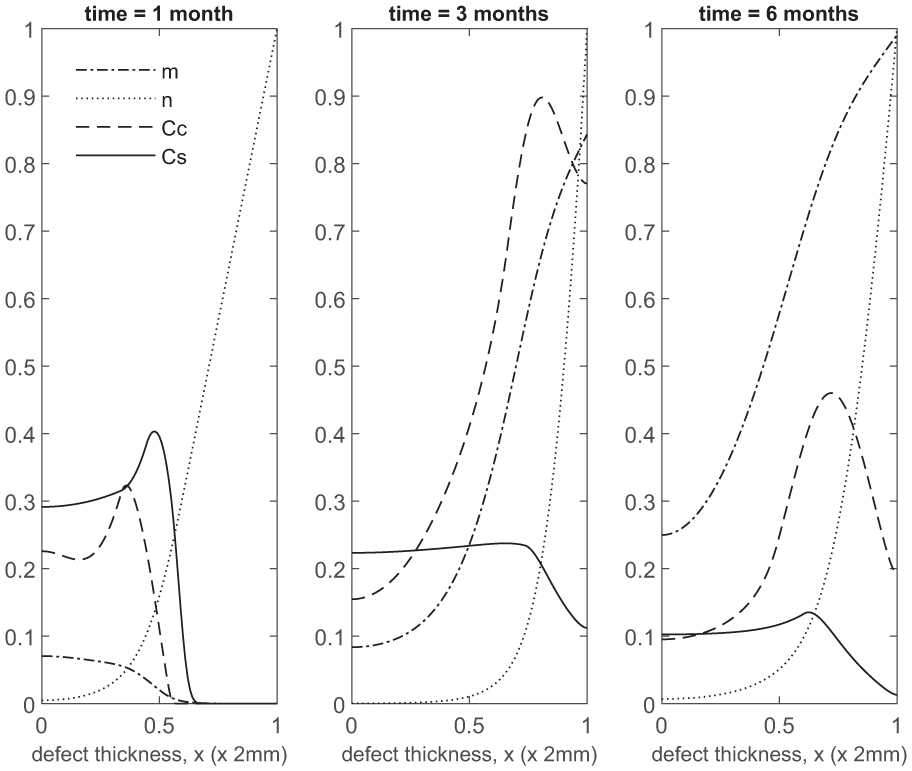
Evolution of cell and matrix densities, and nutrient concentration at times t = 1, 3 and 6 months following co-implantation of 10% stem cells and 90% chondrocytes.
Evolution of cell and matrix densities, and nutrient concentration at times t = 9, 12 and 24 months following co-implantation of 10% stem cells and 90% chondrocytes.
Next, we make a comparison between the five co-implantation cases with ACI and ASI to identify both spatial and temporal differences in matrix and cell densities.
Comparison of matrix density of co-implantation, ACI and ASI at early times
Figures 17 and 18 compare matrix densities at early times for five co-implantation cases with ACI and ASI.

Comparison of matrix density profiles for all cases at times t = 11 days and 1 month.

Comparison of matrix density profiles for all cases at times t = 3 and 6 months.
Up to 1 month, the 100% chondrocyte case (0:100) has the largest amount of matrix (Figure 17). Although at 11 days the chondrocyte density in the 90:10 case is close to that of other co-implantation cases containing higher chondrocyte densities, and even higher than in the 0:100 case (compare Figures 2, 5, 8, 11 and 14, and Figure 2 in Lutianov et al. 5 ), the additional nutrient demands of the stem cells bring the nutrient concentration below the minimum threshold value, resulting in matrix densities much lower than the 0:100 case (Figure 17). In the 100:0 case, the stem cells have not yet differentiated into chondrocytes at these early time points, and hence no matrix at all is produced (Figure 17).
The 10:90 case has the highest level of matrix at 3 months (Panel 1 in Figure 18), consistent with the observations in Figures 14, 15 and 16. The five co-implantation cases produce more matrix than the 0:100 case, despite the 0:100 case having the largest matrix density at earlier times and the highest implantation of chondrocytes. The 100:0 implantation case, relevant to ASI, still has the lowest matrix levels, indicating that the implantation of MSCs alone delays healing initially (Panel 1 in Figure 18).’ Can be changed to ‘case’ instead of ‘implantation case’ if required.
These findings highlight the importance of early matrix deposition, as it is clear at late times that the differences we observe in matrix levels between our co-implantation cases are more moderate (Figures 4, 7 10, 13 and 16, Panel 2 in Figure 18). At late times, our simulations are more likely to be constrained by low nutrient concentrations, therefore slowing the rate of healing down. At early times, more nutrients are available within the defect, primarily at the top, where formation of cartilage is most notable in our ASI and co-implantation cases. We find our ACI case forms matrix primarily at the bottom of the defect as nutrient levels never become very low here, unlike for our other cases, meaning cells are not forced to diffuse to areas of higher nutrient concentration to continue proliferating (Figure 18). Chondrocytes also have a lower cell motility rate in comparison to MSCs, meaning diffusion to the top of the defect will be slower.
Comparing mean cell and matrix densities versus time for co-implantation, ACI and ASI
Here we compare the mean matrix, chondrocyte and MSC densities over a period of 24 months for four cases: 0:100 (ACI), 100:0 (ASI) and two co-implantation strategies, 90:10 and 10:90. We choose to focus on 90:10 and 10:90 as they represent our two most extreme co-implantation cases, with all other results, that is, 70:30, 50:50 and 30:70, lying within the bounds of these two sets of results (see Figures 17 and 18). The two single-cell implantation cases are investigated in Lutianov et al. 5 and Part I of our work Campbell et al., 9 and the interested reader is referred to these studies.
In Figure 19(a), at 1 month, the mean matrix density produced is largest for the 0:100 case (blue). This is not only because this case has the largest concentration of chondrocytes directly producing matrix from the beginning but also because only chondrocytes are seeded in the defect. The co-implantation cases also have a population of stem cells competing for nutrients, thus reducing the average matrix production by the chondrocytes. At 2 months, the 100:0 (grey) case has produced barely any matrix due to MSCs having to first differentiate into chondrocytes before matrix deposition can begin. Also at this time, our co-implantation cases (90:10 grey, 10:90 orange) have already surpassed the matrix levels of 0:100 despite containing less implanted chondrocytes. This is due to growth factors being released by the cell-to-cell interaction of the MSCs and chondrocytes 9 and the balance of the effects of cell proliferation and nutrient levels. In our model, MSCs have a high demand for nutrients to support their high proliferation rate and their differentiation into chondrocytes. In the 90:10 case, the large concentration of MSCs therefore consumes a large amount of nutrients, leaving less for the chondrocytes to produce matrix. On the other hand, in the 10:90 case, the MSC density is lower, and therefore these cells consume less nutrients, leaving more nutrients for the chondrocytes to proliferate and deposit matrix. This difference is mainly observable at early times.
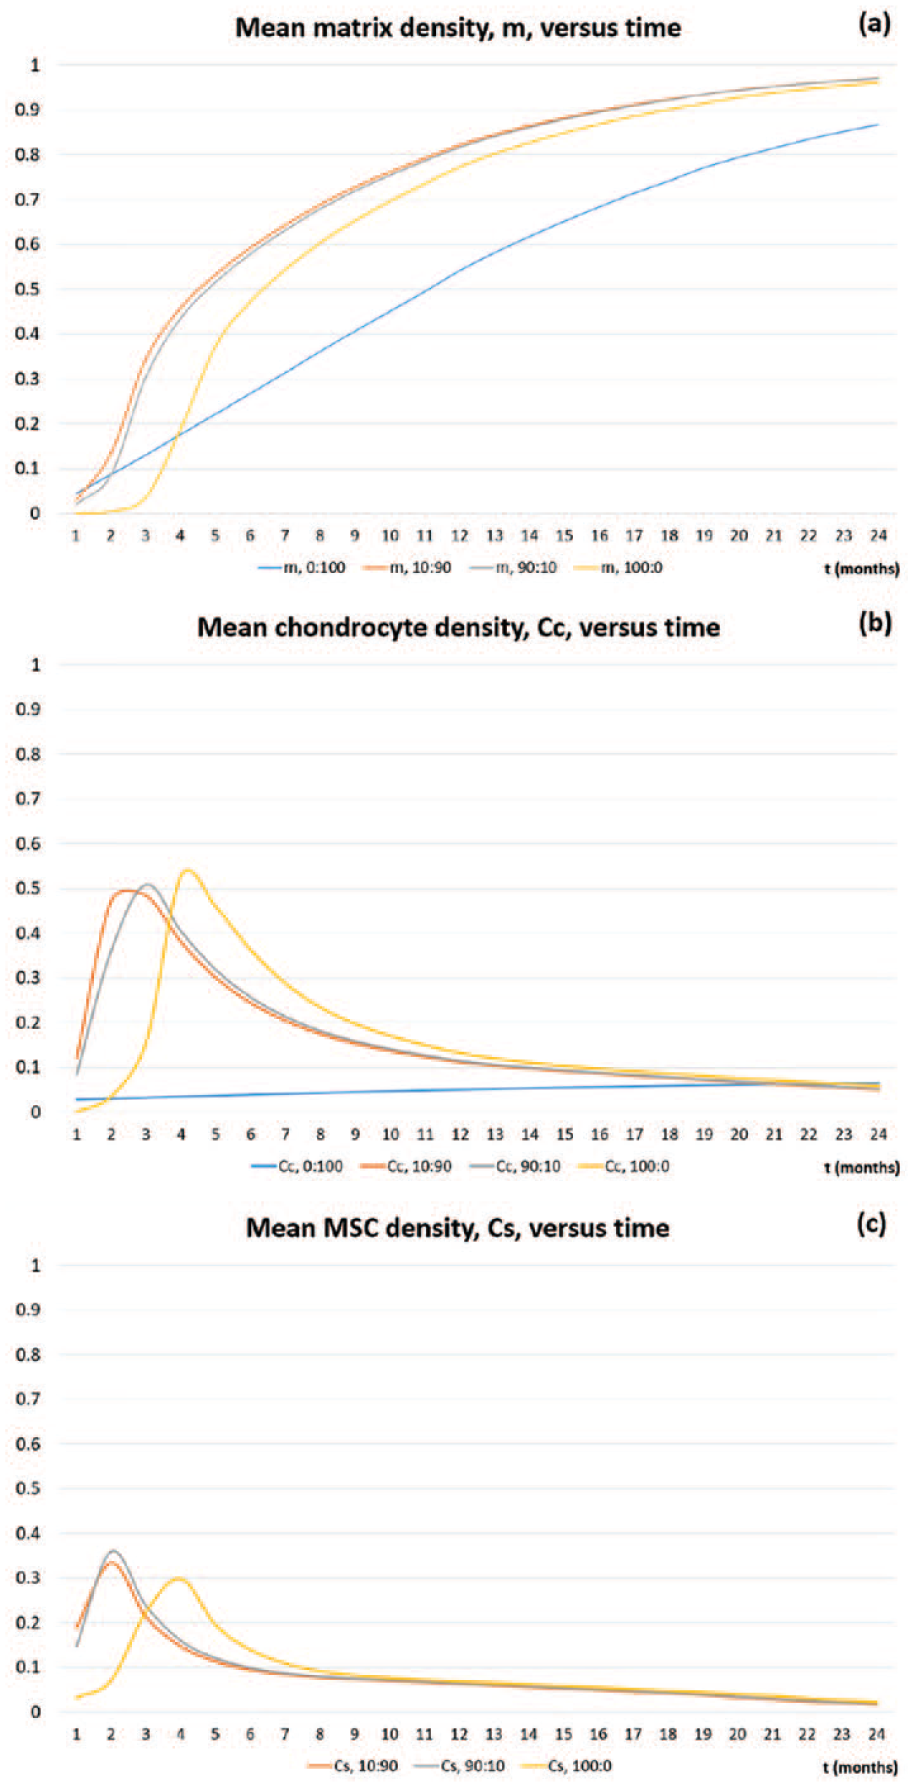
Mean densities of (a) matrix
At 3 months, the mean matrix density for the 90:10 (grey) case is 136% higher than the 0:100 case (blue), and has an even higher percentage difference when compared with the 100:0 case (yellow). This marked increase in matrix density is due to the effects of the growth factors. 9 We see a higher percentage difference when compared to 100:0 due to lower mean chondrocyte density at this time compared to 90:10 and 0:100 (see Figure 19(b) for the mean chondrocyte density comparison between the co-implantation cases and ACI and ASI). Beyond 3 months, this increase in mean matrix levels is sustained for the co-implantation cases with an 80% increase at 12 months when compared with 0:100 for our 90:10 case. The percentage difference is smaller when compared with the 100:0 case, with a 5.5% increase at 12 months. Past 1 year, we see that the co-implantation cases maintain the highest mean matrix levels, which is an accumulation of the differences in matrix levels at early times.
In Figure 19(b), we compare the mean chondrocyte densities for the 10:90 (orange), 90:10 (grey) and 100:0 (yellow) cases. We do not show the evolution of the mean cell density of the 0:100 case since it is more localised to the bottom of the defect, and therefore not a good comparison for mean cell levels. We see at 1 month that the 10:90 case (orange) has the highest level of chondrocytes, but despite this matrix deposition is slow initially due to nutrient levels falling below the critical condition,
In Figure 19(c), we compare the mean MSC densities for the 10:90 (grey) and 90:10 (orange) co-implantation and 100:0 (yellow) cases. The 0:100 contains no MSCs. At 1 month, the 90:10 case has the highest density of MSCs, despite the 100:0 case having the highest implantation of MSCs. In the 10:90 and 90:10 cases, cell-to-cell interaction releases growth factors almost immediately, meaning chondrocyte proliferation and MSC differentiation are enhanced.8,9 This is likely to be the cause of the marked increase in MSC levels in the defect at this time.
Discussion
This study aimed to develop a mathematical model to explore the longer term patterns over time of cartilage defect healing following implantation of mixtures of MSCs and chondrocytes at various ratios, and investigate the differences between them. First, our simulations suggest that co-implanting MSCs and chondrocytes will increase matrix deposition within the first half year of healing when compared with 100% MSC (ASI) or 100% chondrocyte (ACI) implantation therapies, indicating a chondral defect could fill with new cartilage at earlier times when a co-culture procedure is the chosen treatment. Although 10:90 appears to have the highest matrix density at early times, clinically a co-implantation ratio that uses less chondrocytes is desirable if the aim would be to develop a single-stage ACI procedure. 11 Opting for the lower proportion of chondrocytes in these co-implantation therapies could mean sufficient chondrocytes can be isolated from the cartilage harvest obtained during arthroscopy for a successful co-implantation procedure. 13 This alleviates the need for expansion of cells in vitro if the fresh chondrocytes are combined with allogeneic stem cells, allowing cells to be harvested and inserted into the defect region during one procedure. 14 Alternatively, the fresh chondrocytes can be mixed with fresh bone marrow, which despite the lower total cell number has been suggested to be clinically effective. 15
Our model enabled us to compare matrix densities following co-implantation of MSCs and chondrocytes at various ratios, not only visualising the cartilage matrix density distribution at any time point but also investigating how the concentrations of MSCs, chondrocytes and nutrients change within the defect in response to different co-implantation ratios. The five ratios we focused on were 90% MSCs plus 10% chondrocytes, 70% MSCs plus 30% chondrocytes, 50% MSCs plus 50% chondrocytes, 30% MSCs plus 70% chondrocytes and 10% MSCs plus 90% chondrocytes, with 90:10 and 50:50 having been or are being investigated clinically.14,16 We compared these to ACI (100% chondrocytes) and ASI (100% MSCs). When comparing co-implantation scenarios with the ACI and ASI results from our previous work,5,9 it is clear that a mixture of MSCs and chondrocytes delivers the desired effect of increased matrix deposition, as hypothesised in the literature 17 and in previous experiments. 8 This effect is especially marked during the first few months following cell implantation, but from around sixth month onwards, the differences, especially with ASI, become small. As time progresses, the 0:100 case continues to produce matrix at a steady rate, but the 100:0 and co-implantation cases soon surpass these levels. Figure 19(a) shows how total matrix levels of 100:0 (ASI), 90:10, 10:90 and 0:100 (ACI) simulations compare at over a period of 2 years. At early time, there is a monotonic increase in the total matrix density with the 0:100 case having the highest density, 100:0 having produced almost no matrix at all and the co-implantation cases having almost similar intermediate levels of matrix. This indicates that at early time, chondrocyte proliferation balanced with adequate nutrient availability is the main identifiable mechanism responsible for the formation of new cartilage in our model. As time progresses, 0:100 continues to produce matrix at a steady rate, but 100:0 and co-implantation cases soon surpass these levels. Beyond 6 months, there is a non-monotonic increase in the total matrix density with a peak in matrix levels in the co-implantation cases, and the 100:0 case still producing the lowest level of matrix. Although we cannot say with any certainty that the maximum matrix density is obtained precisely for the 10:90 or 90:10 case, there is a definite optimal ratio of stem cells and chondrocytes that can produce maximum matrix at intermediate times. This indicates that at these times, cell differentiation and diffusion are the important mechanisms driving new cartilage formation. From 6 months onwards, we found little difference in the distribution of cell types and cartilage matrix between the five co-implantation cases and implanting only stem cells. This suggests that implanting a cell population that includes stem cells will lead to a stable solution path, regardless of the exact proportion of stem cells. Although co-implantation of chondrocytes and stem cells led to more matrix deposition at earlier time points, this difference was not maintained, and by 12 months, the difference in matrix production between the five cases was very small. Similar small differences have been found between 1-year biopsies obtained in human trials of co-implanted cells, stem cells or chondrocytes.2,14 Nevertheless, the larger matrix deposition at earlier time may give advantages with respect to the rehabilitation, which could be faster if matrix is formed earlier. This alone could be an important clinical advance in the treatment of articular cartilage damage.
A mixture of stem cells and chondrocytes produces more consistent levels of matrix due to the balance of nutrients used between the two cell types and the release of important growth factors that influence chondrocyte proliferation and stem cell differentiation. In our model, this effect is partly due to the cell–cell interactions between MSCs and chondrocytes, releasing growth factors such as FGF-1 and BMP-2 that cause an increase in matrix deposition from increased chondrocyte proliferation and enhanced chondrogenesis. 8 In addition, the increase of matrix deposition and chondrocyte density at early times for our co-implantation cases is in part due to the lower proliferation rate of the chondrocytes, allowing more nutrients to be available in the defect for MSC proliferation and differentiation.
An important assumption in our model concerns the role of chondrogenesis, the differentiation of stem cells into chondrocytes. Our results suggest that stem cell differentiation played an important part in increasing the number of chondrocytes, and eventually the matrix, due to large quantities of chondrocytes, comparable to our 50:50 case, being present in the defect when 90% MSCs are implanted. Most in vitro co-culture studies suggest that the more important contribution from the stem cells is their positive effect on chondrocyte proliferation whereas their differentiation into chondrocytes is less important. 7
Other mixtures of MSCs and chondrocytes could be investigated to find an ‘optimal’ MSC/chondrocyte ratio, where nutrient constraints are minimised and matrix deposition maximised. Our criterion for suggesting an optimal co-implantation ratio is based on mean matrix densities. However, other criteria could also be used to determine an optimal ratio. Some justifications of our current criterion are clinical data comparing magnetic resonance imaging (MRI) and clinical outcome that suggests the signal intensity on MRI correlates with better clinical outcome of ACI. 18 The signal intensity is a measure of mean matrix density, and thus our chosen measure will give a clinically relevant comparison. However, other parameters such as the required time for cartilage matrix to fill the defect and the required time to achieve a threshold density at the surface might also be appropriate. The spatial distribution of matrix might also be relevant, as seen in Figures 17 and 18. However, our results suggest that this may be difficult to translate in a criterion. The comparison between MRI and clinical outcome suggests that the articular surface of the repair tissue may be most important, 18 which would suggest that the repairs including stem cells, which form denser matrix at the defect surface, might be better. However, the distribution of matrix density is less homogeneous for these cases, and poor matrix homogeneity is associated with poorer clinical outcome. 18 The limitations of our model dictate that all simulations are subject to nutrient concentration constraints, typically meaning an optimal split of MSCs and chondrocytes is not at all obvious; this would require further investigation. This effect of nutrient concentration impacting the overall healing process has been hypothesised in our previous model as well as similar work, 19 with this co-implantation model now corroborating this hypothesis further. Availability of cell types, overall cost and efficacy of the procedure are factors that would also have to be considered when considering an optimal MSC–chondrocyte co-implantation ratio.
Footnotes
Appendix 1
Declaration of conflicting interests
The author(s) declared no potential conflicts of interest with respect to the research, authorship, and/or publication of this article.
Funding
The author(s) disclosed receipt of the following financial support for the research, authorship and/or publication of this article: We are grateful to Keele University (ACORN fund) and the AR-UK Tissue Engineering Centre (grant no. 21156) for supporting this work, which forms part of Kelly Campbell’s* PhD research.