
Abstract
Cancer is a serious death causing disease having 8.2 million deaths in 2012. In the last decade, only about 10% of chemotherapeutic compounds showed productivity in drug screening. Two-dimensional culture assays are the most common in vitro drug screening models, which do not precisely model the in vivo condition for reliable preclinical drug screening. Three-dimensional scaffold–based cell cultures perhaps mimic tumor microenvironment and recapitulate physiologically more relevant tumor. This study was carried out to develop bi-functional oxidized dextran–based cell instructive hydrogel that provides three-dimensional environment to cancer cells for inducing microtumor. Oxidized dextran was blended with thiolated chitosan to fabricate an in situ self-gelable hydrogel (modified dextran–chitosan) in a one-step process. The hydrogels characterization revealed cross-linked network structure with highly porous structure and water absorption. The modified dextran–chitosan hydrogel showed reduced hydrophobicity and has reduced protein absorption, which resulted in changing the A549 cell adhesiveness, and encouraged them to form microtumor. The cells were proliferated in clusters having spherical morphology with randomly oriented stress fiber and large nucleus. Further microtumors were studied for hypoxia where reactive oxygen species generation demonstrated 15-fold increase as compared to monolayer culture. Drug-sensitivity results showed that microtumors generated on modified dextran–chitosan hydrogel showed resistance to doxorubicin with having 33%–58% increased growth than two-dimensional monolayer model at concentrations of 25–100 µM. In summary, the modified dextran–chitosan scaffold can provide surface chemistry that induces three-dimensional microtumors with physiologically relevant properties to in vivo tumor including growth, morphology, extracellular matrix production, hypoxic phenotype, and drug response. This model can be potentially utilized for drug toxicity studies and cancer disease modeling to understand tumor phenotype and progression.
Introduction
Cancer is a serious death causing disease with 14.1 million cancer occurrence and 8.2 million deaths worldwide. 1 In the last decade, there is an escalation in the number of potential chemotherapeutic agents screened for anticancer drug development. 2 However, only about 10% of them showed productivity throughout clinical development. 3 The most commonly used method for initial drug screening includes the cell culture of human-derived tumor cell lines in two-dimensional (2D) Petri dishes. However, lack of physical micro-environmental cues remains major bottleneck of 2D method. In 2D, cells attach to substrate and can interact with other cells only at their periphery, which alters the cell surface receptor expressions, cell–cell, and cell–matrix interactions. 4 – 9 Cells are not allowed to grow on top of one another, forced to adopt monolayer morphology, which is physiologically not natural for all cell types. When chemotherapeutics drugs are screened on these models, it may raise the issues of altered efficacy during animal studies, one of the main reasons for drug failures. 10 This technical uncertainty should be improvised at initial assays to reduce the overall cost of drug development process.11,12 It is, therefore, essential to improve in vitro cell culture assays for more predictive and reliable preclinical drug screening. Three-dimensional (3D) cell culture methods perhaps can overcome these limitations and can be used as a model to explain how cell–matrix interaction affects the cellular morphology, proliferation, gene expressions, and drug responses.13–15
Tissue engineering approach has been employed to fabricate 3D scaffold–based cultures for generation of tumor models.16,17 These polymeric engineered scaffolds recapitulate physiologically relevant tumor to understand how microenvironmental cues affect the tumor behavior. For instance, 3D scaffolds were explored to study the effect of topography and mechanical property on metastatic potential of cancer cells, 18 the chemical structure and geometry on enrichment of cancer stem cell population, 19 and impact of tissue stiffness in 3D environment on tumor cell migration. 20 The hypoxic environment is a characteristic feature of solid tumors, which activate hypoxia-inducible factors (HIF)-1α and other downstream proteins. In a recent study, 3D tumor models demonstrated the effect of hypoxia on enhanced cell proliferation, migration, epithelial–mesenchymal transition (EMT) activation, and increased migratory potential of cancer cells. 21 These studies ascertained the role of 3D geometry for creating a microenvironment which alters cell–cell interactions. In addition, it provides cell–matrix interactions that lead to generate physiologically relevant microtumor. These scaffolds recapitulate the physical features including porous structure, 3D geometry, topography, and mechanical properties and biochemical composition. However, they merely focus on the chemical cues on tumor cell phenotype and their effect on 3D microtumor formation. The surface chemistry of scaffold may influence the cell adhesion, receptor expression, and intracellular signaling, which influence tumor cell growth, morphology, and phenotype. Creating a scaffold with providing chemical environment such as surface charge and presence of adhesive molecules along with physical properties would be beneficial to create complex tumor microenvironment. Furthermore, it would provide information that how biochemical–physical properties and their interaction would collectively influence cancer cell behavior and drug response.
Limited studies have been performed on 3D scaffold–based tumor models to assess the effect of 3D microenvironment on drug response of cancer cells. For instance, fibroblast-derived 3D scaffold was explored to determine tumor growth and drug responsiveness for different epithelial cancer cell lines. This study revealed that cells that undergo β-integrin-dependent morphological change in fibronectin matrix have lesser effect of chemotherapeutic drug taxol. 22 In another study, 3D co-culture microfluidic platform was utilized to mimic the tumor microenvironment and tumor permeability. The model demonstrated that drug diffusion and permeability in 3D environment were affected by matrix geometry. 23 To this point, it is important to understand that the model should be easy to employ for drug screening assays, yet intimately represent the physiochemical properties of native tumor microenvironment and encourage cells to form 3D tumor. The materials should be biocompatible and structurally similar, yet easy to process.
In this study, authors reported a modified polysaccharides-based cell instructive hydrogel to induce 3D microtumor formation. Two natural polymers dextran and chitosan were selected and modified for fabrication of hydrogel. Since both the polymers are polysaccharides, it can provide the glycosaminoglycan (GAG) structural mimicking scaffolds for microtumor formation. The GAG can swell and provide structural cues to cells which open up pathways for invasion and migration of cells associated with cancer metastasis, as suggested for hyaluronan (HA). 24 Mimicking these structural properties of GAGs could be relevant to recreate the in vitro tumor.
Apart from that, dextran is known for its antifouling properties.25,26 It was oxidized by periodate to generate multiple aldehyde groups in its backbone which can cross-link carboxyl groups present in chitosan. Thiolated chitosan (TC) was produced by grafting the cysteine molecules to chitosan chain by 1-ethyl-3-(3-dimethylaminopropyl) carbodiimide (EDC), which have imparted the aqueous solubility to chitosan. Blending of both modified polymers in aqueous medium was anticipated to generate binary interpenetrating network based on imine bond and disulfide linkage as a single-step process. In this study, the modification of polymers was performed to make easily reproducible biocompatible hydrogel without which can provide structural mimicking environment. This oxidized dextran (Odex)-based hydrogel would have advantages over other models like Matrigel or collagen gel that the present scaffold would have reproducible structure with tunable porosity, mechanical properties along with cell instructive biochemical cue inclusive in one model.
In this perspective, authors hypothesized that modified dextran–chitosan (MDC) will form in situ self-cross-linkable network with tunable porosity and mechanical properties. Moreover, due to its antifouling nature, Odex will alter the hydrophobicity and protein absorption capacity of hydrogel. The altered surface property is anticipated to restrict the cancer cell spreading and will induce 3D microtumor formation inside the scaffolds. We have used different feeding concentrations of Odex during hydrogel fabrication and optimized it for morphology and porosity. The effect of Odex on cell morphology and lung microtumor formation was analyzed on optimized scaffolds. Generation of reactive oxygen species (ROS) as an indirect marker for hypoxia, expression of extracellular matrix (ECM) markers, and drug response of lung tumor cells with a model drug were performed to validate MDC scaffold as a 3D tumor model for drug toxicity assay.
Experimental
Materials
Dextran (MW ~70,000), chitosan (medium molecular weight),
Methods
Oxidation of dextran
Dextran of 10 g was dissolved in 800 mL of deionized water. Sodium periodate was added as molar equivalent or half molar equivalent to dextran in 200 mL of water with continuous stirring. The reaction performed under dark conditions at room temperature (RT) for 1 h. An equimolar amount of DEG was added to the reaction mixture to stop the oxidation reaction. The reaction mixture dialyzed for 3 days. For dialysis, entire solution was filled in dialysis tubing with MWCO ~ 12 kDa and kept in 20 L miliQ water in dark at RT. The water was stirred very slowly and changed at every 24 h. The modified dextran was freeze-dried and stored at 4°C in dark for further use.
Thiolation of chitosan
Thiolation of chitosan was achieved by grafting cysteine amino acid to chitosan side chain with EDAC as a cross-linker. Chitosan of 1 g was dissolved in 100 mL of 1% v/v acetic acid solution. A total of 3 M solution of cysteine (10 mL) was added to chitosan solution and allowed to dissolve. The reaction was started by adding EDAC solution (0.1 M, 10 mL) to the reaction mixture and carried out for 3 h in dark. The modified polymer was dialyzed (MWCO ~ 12,000 Da) with 5 mM HCl for 1 day, followed by 5 mM HCl–1% NaCl for next day and finally with 1 mM HCl for a day. The purified product was lyophilized and kept at 4°C in dark for further use.
Determination of oxidation degree of dextran
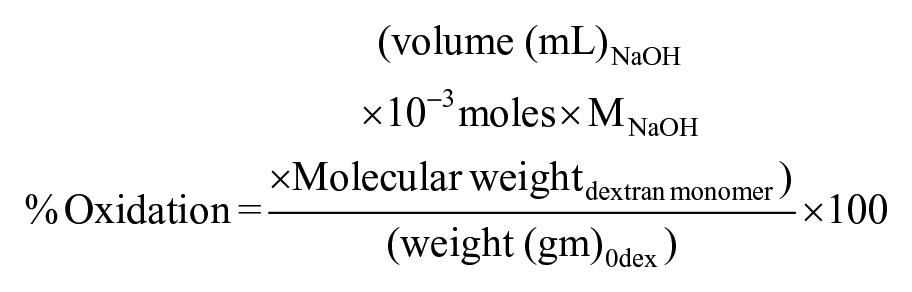
The amount of aldehyde in the Odex was determined by hydroxylamine hydrochloride method described by Zhao and Heindel 27 Briefly, 0.1 g of purified product was dissolved in 0.25 M NH4OH · HCl–methyl orange solution and allowed to solubilize for 2 h at RT. The reaction product released hydrochloride molecule which was quantified by titrating the solution with standard NaOH to bring out to the original color solution. The degree of oxidation was determined as moles of aldehyde produced per moles of dextran monomers in the sample by calculation given below
Determination of chitosan thiolation
The amount of thiol group in the chitosan polymer was determined by Ellman’s assay. Briefly, 2.5 mL of reaction buffer (0.1 M sodium phosphate, 1 mM ethylenediaminetetraacetic acid (EDTA), pH 8) and 50 µL of Ellman’s reagent (4 mg/mL in reaction buffer) were added to 250 µL of polymeric sample and incubated for 15 min at RT and the absorbance was measured at 412 nm.
Molecular weight of dextran
Gel permission chromatography (GPC) was performed to analyze the molecular weight of Odex with infinity 1260 system (Agilent Technologies). The pure dextran and Odex were dissolved in diH2O with a concentration of 0.5 mg/mL and analyzed with PLAquagel-OH mixed column (8 µm 7.5 × 300 mm) at a flow rate of 1 mL/min.
Hydrogel fabrication
A solution of Odex with 3%, 4%, and 5% w/v and 4% w/v TC was prepared. An equal volume of both solutions was mixed and poured into cylindrical molds to fabricate hydrogel. For control scaffold, 4% w/v TC solutions were cross-linked with 1% w/v solution of glutaraldehyde. Both the solutions were allowed to cross-link at RT for 2 h. Following to that, the gels were frozen at −20°C and −80°C for 24 h and then lyophilized to form porous hydrogel scaffolds.
Scanning electron microscopy analysis
Lyophilized hydrogel disks (9 × 1 mm, d × h) were sputter coated with palladium gold. Surface morphologies were recorded with a scanning electron microscope (SEM; Evo® 18, Carl Zeiss GmBH, Germany) at 10–20 kV. The pore size of the hydrogel was evaluated from SEM images, where pores were determined by their longest dimension. In all, 50 pores per image were selected randomly for three different images and analyzed for pore size distribution and mean pore size using ImageJ software.
For cell-laden hydrogel, cells were fixed with 2% glutaraldehyde in cacodylate buffer (0.1 M) following dehydration with series of concentrations of ethanol that is, 30%, 70%, 80%, 90%, and 100% for 10 min each. The samples were air-dried, sputter coated with gold–palladium and analyzed under SEM.
1 H nuclear magnetic resonance
1 H nuclear magnetic resonance (NMR) spectroscopy of dextran and Odex was performed to determine the modification of dextran. A total of 0.01 g of each dried sample was dissolved in 1 mL of D2O by sonication. The solutions were then poured into NMR tube and spectra were acquired with a 500 MHz Fourier transform nuclear magnetic resonance spectrometer (Bruker, Germany) at RT. The spectra were collected and analyzed in Mnova NMR software.
Fourier transform infrared spectroscopy
The dried powder of dextran, Odex, chitosan, TC, and dried hydrogel were used for Fourier transform infrared spectroscopy (FTIR) analysis using a Thermo Scientific, USA, instrument with attenuated total reflectance (ATR). All spectra were acquired in the 4000–400 cm−1 range with a resolution of 4 cm−1 for 20 scans. The data were collected and graph was prepared using Origin software.
Hydrophobicity index
The hydrophobicity of hydrogels with different Odex concentrations was determined by previously reported method. 28 Briefly, freeze-dried samples of each formulation were cut into disks and their corresponding dry weights (Wd) measured. The scaffolds were consequently immersed in diH2O (W) or 70% isopropanol (IP) for 36 h and their respective swollen weight were recorded as WS. The swelling ratio (q) for each solvent was calculated as

The hydrophobicity was calculated as H-index by the following equation

Protein adsorption study
Protein adsorption on hydrogel was determined by indirect measurement of BSA protein concentration. Dried hydrogels having 9 mm diameter were cut in to 5 mm height and their dry weight was measured. Each scaffold was saturated in 1× phosphate-buffered saline (PBS) for 24 h. Saturated scaffold was submerged in 1 mL BSA protein solution (50 µg/mL) for 1 h. After 1 h, scaffold was removed and protein concentration of the remaining solution was determined by bicinchoninic acid assay with measuring absorbance at 562 nm. The amount of adsorbed protein was calculated by subtracting the remaining amount of protein from an initial concentration of BSA protein solution.
Mechanical analysis
Mechanical testing studies were conducted using a Tinus olsen H5KT system with a 50 N load cell and Herison software. Cylindrical hydrogels were cut into 5 mm height and pre-wetted in 1× PBS for 30 min. Uniaxial compression at 5 mm/min was applied and compressive modulus was measured by calculating the ratio of stress versus strain.
Swelling study
The dried scaffolds were taken with pre-determined dry weight (Wd) and were immersed in the diH2O. At specified time point, the scaffolds were removed, placed on filter paper to remove excess water, and weighed for swollen weight (Ws). The equilibrium water content (EWC) for each time point was calculated by the following equation

The hydrogels were analyzed as n = 3 samples and the EWC versus time was plotted using GraphPad Prism software.
Cell culture and growth
The A549 lung adenocarcinomic basal epithelial cells were cultured in 2D monolayer with RPMI 1640 media supplemented with 10% FBS. Cells were trypsinized after they reached 60%–70% confluence, and 0.5 × 10⁵ cells were seeded on hydrogel (1 mm × 11 mm Hxø disk). The cells were allowed to adhere on the scaffold for 3 h. Subsequently, sufficient media was added and incubated at 37°C in humidified incubator with 5% CO2. Cell proliferation was determined by the Alamar blue assay. At each time point, sterile resazurin solution (0.15 mg/mL in PBS) was added per well as 100 µL with 1 mL media and incubated for 1 h at 37°C. Post incubation, 200 µL of suspension was collected and fluorescence was measured by microplate reader (BioTek Instruments, Inc.) at 560 nm excitation and 590 nm emission wavelength. Cultures were kept for further growth studies, as the process is non-toxic. 29 The cell number was determined by standard curve. GraphPad Prism software was used to plot the graph and t-test was performed to analyze statistical data.
ImageJ analysis
For quantitative measurement of cellular morphological features, ImageJ software was used. The SEM images were utilized to calculate the cell structures. The cellular boundaries in the images were drawn manually by free hand drawing tool in the software and measurement command was applied to record the dimensions of that shape. In all, 12 shapes were drawn from three different images for analyzing shape features. The cell morphological features were calculated in ImageJ using the following formula

The value of 1.0 indicates a perfect circle. As the value approaches 0.0, it indicates an increasingly elongated shape. The solidity was calculated as


Confocal microscopy
The cell viability and 3D microtumor formation in the hydrogel were analyzed by fluorescence-based LIVE/DEAD™ assays in confocal microscope. Briefly, cells were cultured on MDC scaffolds for 2, 4, and 6 days. After each time point, scaffolds were washed with 1× PBS and treated with assay solution containing 2 µM calcein acetoxymethyl (AM) and 4 µM ethidium homodimer-1 (EthD-1) and incubated for 30 min at 37°C. After that, cells were directly observed in confocal laser scanning microscope with z-stacking (LSM780, Zeiss, Germany). For cytoskeleton arrangement, cells-laden scaffold was fixed with 2% paraformaldehyde after 6 days of culture. Followed by 1× PBS washed cells were permeabilized with triton X-100 and treated with phalloidin–FITC. The nucleus was counterstained with DAPI.
Immunocytochemistry
The collagen immunostaining was performed with paraffin-sectioned scaffolds. The cell-laden hydrogels were sectioned to 3–5 µm and mounted on glass slides. The sections were dewaxed by immersing in xylene for 10 min two times, rehydrated sequentially through a 100%, 95%, 70%, and 50% ethanol for 5 min each and washed with PBS.
For staining, cells were permeabilized with 0.1% Triton-X 100 for 10 min. Followed by PBS wash, cells were incubated with blocking buffer for 30 min at RT and treated with primary anti-collagen IV mouse antibody (1:1000) at 4°C overnight. Then, the cells were incubated with Alexa Fluor® 568 tagged secondary anti-mouse antibody (1:500) prepared in 1% BSA for 1 h at RT in the dark. The cells were counterstained using DAPI and observed under confocal microscope (LSM780, Zeiss, Germany).
Detection of ROS generation
The total ROS production in the microtumors was determined by DCFDA assay and compared with cells grown on the 2D surface. 2′,7′-DCFDA is a non-fluorescent compound oxidized by ROS present in the cell, into highly fluorescent molecule 2′,7′-dichlorofluorescein (DCF). The cells were washed with Krebs-Ringer bicarbonate (KRB) buffer followed by treatment with 50 µM DCFDA (prepared in KRB buffer) and incubated for 4 h at 37°C in dark. The cell-laden scaffolds were then homogenized in cell lysis buffer. Finally, the suspension was centrifuged and 200 µL supernatant was used for recording absorbance at 495/529 nm.
Drug sensitivity of cells on MDC scaffold
A total of 0.5 × 10⁵ cells were grown on 2D monolayer and 3D scaffolds. The cells were treated with doxorubicin (dissolved in 4 µL dimethyl sulfoxide (DMSO)) as 25, 50, and 100 µM concentration in total media (1 mL) after 1 day (60%–70% confluence) for 2D. The similar dosage was applied to the cells after 2, 4, or 6 days of growth for 3D scaffolds. After 24 h of treatment, the viability of cells was determined by the Alamar blue assay and normalized with respect to untreated DMSO control. The percent cell viability with respect to control was plotted for each dosage at 2D or 3D conditions. Each dosage was compared in 2D versus 3D conditions and in both conditions the difference between cell viability at different dosage was also analyzed.
Statistical analysis
All quantitative results were performed with n = 3 and results were expressed as mean ± standard error of mean. Statistical analysis was performed using Student’s t-test in GraphPad Prism software for comparing control with treatment or 2D with 3D. All values of p < 0.05 were considered as statistically significant.
Results and discussion
Modification of polymers and characterization
To avoid conventional cross-linkers such as glutaraldehyde, which otherwise require multiple washing steps to remove it, dextran was modified. The dextran oxidation by the sodium periodate is a catalysis-free aqueous reaction which yields a polyaldehyde dextran that can serve as a macromolecular cross-linker for amino group bearing polymers to form hydrogel. The functional groups of dextran and Odex were identified by FTIR spectra (Figure 1(a)). The broad peak at the region of 3500 cm−1 corresponded to the OH stretching vibration of the polysaccharide in both the spectra.
30
However, a decrease in the intensity of OH in the Odex spectra might be attributed to the conversion of OH group into CHO group during oxidation reaction. Similarly, the peak at 2920 cm−1 was assigned to C–H stretching vibrations of dextran and Odex.30,31 The sharp peak appears at 1003 cm−1 and shoulder peak at 1143 cm−1 were the characteristic band of asymmetrical C–O–C vibrations.
32
Small shoulder peaks at 816 and 920 cm−1 confirmed the presence of (1→3)-α-

(a) FTIR spectra of dextran and Odex. The inset graph represents the spectra at specified range, exhibiting difference in peaks of both spectra. The arrow in inset graph shows the signature peak for aldehyde group in Odex spectra, which was absent in Dextran spectra. (b) NMR spectra of pure dextran and Odex. The inset chemical structures represent respective structure of dextran and Odex representing opening of glucose chain and formation of aldehyde groups in Odex.
The 1H-NMR spectra of dextran and Odex are shown in Figure 1(b). The spectrum shows multiple peaks at 3.1–3.8 corresponding to protons of the glucopyranosyl ring of dextran monomer. Aldehyde proton was expected between 9.0 and 9.5 ppm in NMR spectrograph of Odex, which is not observed however.36,37 The absence of aldehyde proton might be due to the formation of hemiacetals or hemialdals by reaction of an aldehyde with neighboring hydroxyl groups. The presence of multiple peaks between 4.0 and 5.5 ppm could be the indirect evidence of the occurrence of hemiacetal groups during the reactions. 36 These observations confirmed the oxidation of dextran that produced aldehyde groups on the dextran chain. The utility of Odex as cross-linker and potential to form network structure was further confirmed during the fabrication of hydrogel. The oxidation degree of dextran that is, amount of aldehyde group was quantified by reaction with hydroxylamine hydrochloride. It was observed that the reaction was completed in 1 h and no further oxidation was observed at 24 h reaction (Figure 2(a)). The oxidation with equimolar and 50% equimolar sodium periodate was 55.85% and 27.62%, respectively (Figure 2(b)). The lower aldehyde concentration was anticipated because of the double oxidation reaction and/or hemiacetal formation in the Odex chain as supported by 1H NMR. The hemiacetal could be formed by reaction of aldehyde group with vicinal OH group. It was reported that Odex with approximately 25% oxidation have least protein absorption. This is because of the relative conversion of –OH to –CHO, which maintain the amount of hydrogen bond donor and acceptor molecules; this balance of donor/acceptor molecules encourages the interactions of polymer with surrounding water molecules and perturbs the interactions with proteins. 38 Therefore, Odex with 27.62% oxidation was selected for the hydrogel formation. The molecular weight of these Odex was determined by GPC and was reduced to 44,416 Da from 70,000 Da with 1.4 polydispersity index. This study demonstrated that with half equimolar NaIO4 reaction, the Odex chain length was reduced to 37%. This reduction in chain length resulted in contributing factor for (1) the rate of cross-linking and (2) homogeneous distribution of polymeric chain network, which may be attributed to semi-interpenetrating network.

Amount of aldehyde produced per dextran monomer, determined by titration with ammonium hydroxide hydrochloride: (a) effect of time of reaction on oxidation of dextran by sodium periodate and (b) effect of amount of sodium periodate on the dextran oxidation. All experiments were done with n = 3.
To perform entire polymerization reaction at physical pH, it was essential to modify the chitosan which usually solubilizes in an acidic environment. The cysteine was grafted on chitosan side chain by zero length cross-linker EDAC. The cross-linking of amino acid was characterized by FTIR. The FTIR peaks showed at 1646 cm−1 (amide I), 1574 cm−1 (–NH2 bending), and 1368 cm−1 (amide III) support the presence of chitosan structure in both the spectra (Figure 3(a)). The absorption bands at 1061 and 1018 cm−1 (skeletal COO stretching vibration) confirm the saccharine structure of chitosan. The occurrence of thiol group at 2364 cm−1 in FTIR spectra confirmed the grafting of cysteine on chitosan. Furthermore, the amount of thiol grafted on chitosan was quantified by Ellman’s reagent. DTNB reacts with a sulfhydryl group present on cysteine to yield a mixed disulfide and 2-nitro-5-thiobenzoic acid (TNB), which was quantified to give measure of cysteine grafted in the chitosan polymer. The amount of cysteine was 6 µM/g of chitosan which is considered to be safer for cellular studies. Importantly, cysteine with more than 100 µm concentration in the cell culture media was reported to be toxic to the cells by producing hydrogen peroxide and free radicals.39–41 Moreover, in this study, the purpose of cysteine grafting was to increase the solubility of chitosan in aqueous solution at neutral pH. The grafting of 6 µM/g cysteine in chitosan had solubilized the chitosan at pH 7. In addition to that, cysteine provided the thiol group to chitosan chain, which can interact with other thiol groups to form disulfide linkages network in the hydrogel.

FTIR spectra of (a) TC and chitosan, (b) hydrogel. The inset graph represents the spectra at specified range, exhibiting difference in peaks of both spectra. The arrow in inset graph (a) shows the signature peak for thiol group at 2364 cm−1 in TC spectra, which was absent in pure chitosan spectra. The arrow shows signature peak of modification. The arrow in (b) inset graph at 1548 cm−1 depicts the formation of imine bond in the hydrogel.
Fabrication of hydrogel
Three different feeding concentrations of Odex (3%, 4%, and 5%) were selected for optimizing hydrophobicity, pore size, and morphology while TC concentration, that is, 4% w/v was kept constant for all hydrogel fabrication. Cylindrical hydrogel with a diameter of 9 mm was cut into the height of 1 mm and used for remaining studies. The presence of imine bond (C=N) formation at 1548 cm−1, confirmed the cross-linked network of polymer chains (Figure 3(b)). The interconnected porous network and surface morphology of scaffold were further studied by SEM analysis.
The pore size was measured from SEM images by ImageJ software (Figure 4). The pore size distribution graph shows that the maximum number of pores in 3% Odex hydrogel was between 190 and 200 µm, while in 4% and 5% Odex hydrogel, the maximum pores were between 160–170 and 150–160 µm, respectively. The pore size distribution in 3% and 4% Odex hydrogel was in the range of 120–280 µm, whereas in 5% Odex hydrogel, the pore size range extended from 90 to 280 µm. The pore distribution pattern of increasing Odex concentration indicated the increase in cross-linking density which was resulted in the reduction of pore size. Moreover, this distribution also revealed that the 4% Odex hydrogels had more than 70% of pores positioned between 140 and 180 µm (40 µm range), while in the case of 3% and 5%, it was 160–220 µm (60 µm range) and 120–190 µm (70 µm range), respectively. The narrow distribution of pore size for 4% Odex hydrogel represented very uniform pores throughout the hydrogel. Furthermore, scaffolds having 140–180 µm pore size is desirable as it can have sufficient void space for cells to grow and form microtumors with size of greater than 100 µm, which is necessary for creating hypoxic condition. The mimicking of in vivo hypoxic characteristics is not possible with microtumors having 99 ± 20 µm size.42,43
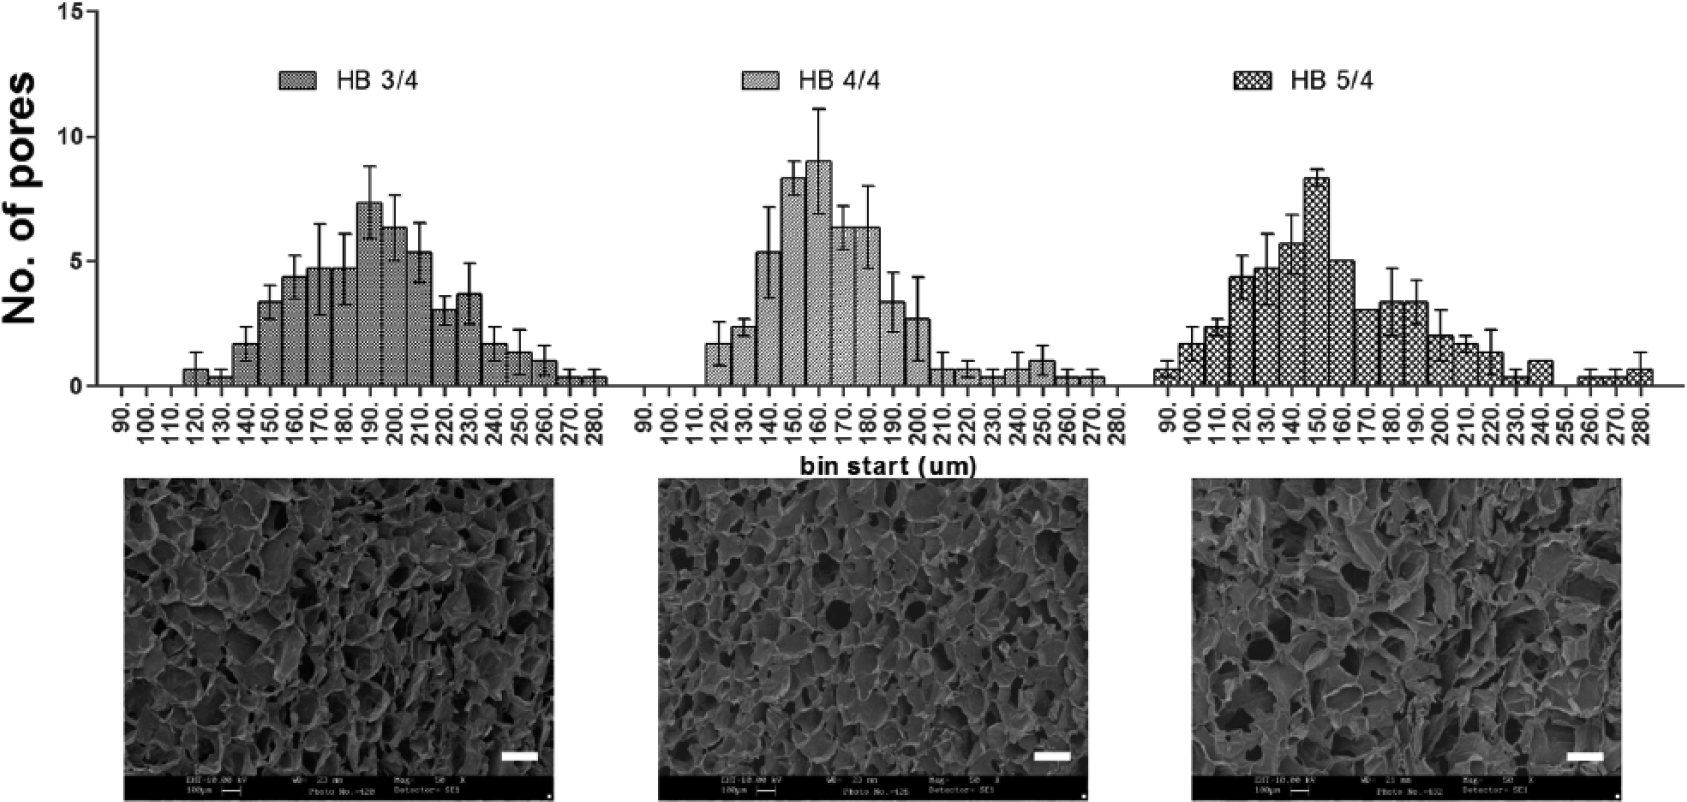
Pore size distribution of MDC hydrogel with different Odex feeding concentration calculated from SEM images. The upper row shows pore size distribution graph for hydrogel formulations having 3%, 4%, and 5% Odex. The lower panel shows SEM image of respective hydrogels. Total n = 3 images were selected for each formulations and 50 random pores was selected per image for analysis. The upper row shows pore size distribution graph for hydrogel formulations having 3%, 4%, and 5% Odex. The lower panel shows SEM images of respective hydrogels. A total of 50 random pores were selected per image with n = 3 images.
The hydrophobicity index (H-index) was calculated to determine the role of Odex and its concentration on hydrophobicity to the hydrogel. All three concentrations of Odex hydrogel and glutaraldehyde cross-linked hydrogel were used for measuring H-index (Table 1). The H-index was decreased in Odex-based hydrogel. However, a very small decrease was observed by increasing the concentration of Odex from 3% to 5%. The decrease in H-index from 0.3528 to 0.3019 of Odex hydrogel as compared to non-Odex hydrogel demonstrated the role of dextran in hydrophobicity of scaffold. The presence of –CHO from Odex and –OH from unmodified dextran bound to water molecules stronger than chitosan.
Hydrophobicity index (H-index) of hydrogel formulations.
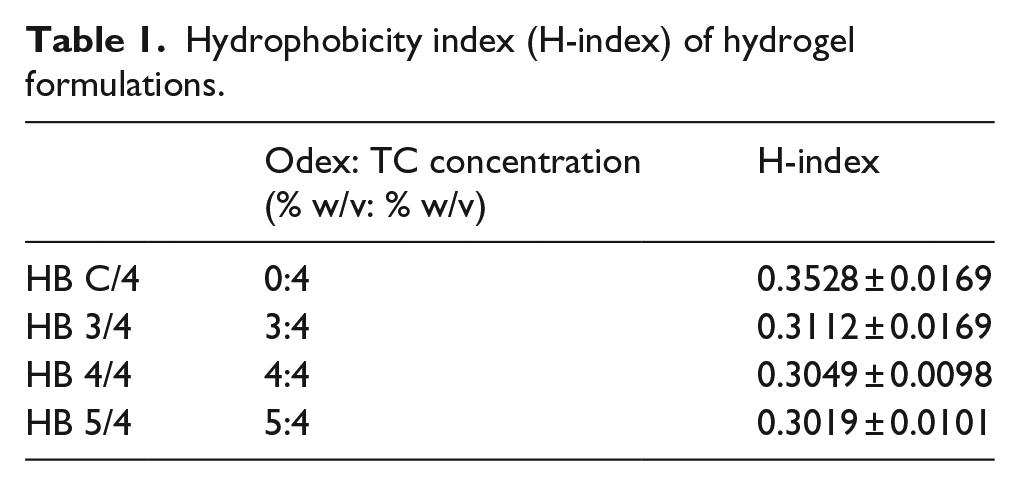
These studies have demonstrated the successful fabrication of scaffold by varying concentration of modified dextran; however, for further studies, 4% Odex–4% TC hydrogel (named as MDC now onward) had been selected due to their uniform pores compared to other scaffolds. Moreover, the hydrogel having 70% of pores in the range of 140–180 µm, which is reported as very much suitable for the majority of cells and their fate process.44–46 Furthermore, the hydrophobicity index was also lower compared to 3% hydrogel, however, not much difference with 5% Odex scaffolds.
Characterization of MDC hydrogel
Protein adsorption study was performed to analyze the relation between Odex-based hydrophobicity and antifouling nature of hydrogel. The study demonstrated that hydrogel cross-linked with glutaraldehyde had adsorbed BSA protein 5.15 µg/g on the surface while in MDC hydrogel it reduced to 2.24 µg/g. Almost 50% reduction in BSA protein adsorption evident the antifouling property of Odex on the hydrogel surface. It is important to understand that the protein adsorption was rather reduced however not completely hindered, which could be due to the presence of TC in the hydrogel. The fine balance between fouling and antifouling surface confines the protein adsorption and hence cell adhesion to the surface and possibly encourage cells to form aggregates.
The swelling study was done in diH2O for 24 h at 37°C. In the course of 24 h, EWC was more than 98% in less than 5 min and no significant change had been observed afterward; the hydrophilized scaffold surface and porous network allowed speedy water adsorption (Figure 5). The scaffold contains 98.5% porosity which increases the surface to volume ratio significantly as demonstrated by change in diameter of the scaffold from 9 to 11 mm after swelling (Figure 5, inset). The rise in water adsorption and its affinity for water molecule also affected the mechanical properties of scaffold. The results showed Young’s modulus (YM) of swelled MDC hydrogel was 33.1 ± 2.6514 kPa while in glutaraldehyde cross-linked hydrogel was 24.767 ± 3.4847 kPa. The increase in stiffness could be due to the presence of Odex-based cross-linking and increased water affinity in the gel. It has been well studied that tumor has stiff microenvironment. The normal lung has YM of 4–10 kPa which increases to 25–35 kPa in the diseased state. 47 Interestingly, data show that MDC scaffold closely resembles this property of lung tumor compared to tissue culture polystyrene surface (TCPS) having 2–4 GPa stiffness. 48 Cells exposed to highly stiff substrate could alter the focal adhesion assembly on the surface which results in altered cellular signaling inside the cells. 49 Therefore, it is crucial to maintain matrix stiffness for precisely recapitulating the native tumor phenotype, which is appropriately present in MDC hydrogel.

Swelling kinetics of MDC scaffold for 24 h, showing equilibrium water content of hydrogel with respect to time. All data points were generated with n = 3. The inset image was the digital picture of dry hydrogel and wet hydrogel after swelling. The swelling has increased the size and transparency of hydrogel.
Cell growth and morphology
To mimic the 3D tumor formations for drug toxicity assay, the biocompatibility and cell growth on the scaffold were accessed by cell proliferation assay (Figure 6). The result demonstrated that the number of cells were 3.66 ± 2.29 × 10⁵ at day 2 as compared to seeding population of 0.5 × 10⁵. This steep cell proliferation rate was reduced to 1.5-fold on successive days. The initial fourfold increase in cell number can attributed due to availability of cell adhesive surface and nutrient to majority of cells, which makes all the cells in actively growing state. However, as cells were kept growing, the unavailability of adhesive surfaces forced cells to form microtumors inside the scaffolds. In this closely packed tumor spheres, nutrient, oxygen, and waste gradient could be generated. Because of that, unlike in monolayer culture, it would form differential zones including active zone of proliferative cells, quiescent zone of viable non-proliferating cells, and necrotic core.50,51 Therefore, overall proliferation rate was compensated, as like in vivo solid tumors.52,53

Alamar blue assay for cell numbers of A549 cells on MDC hydrogel as a function of time. The bars exhibiting significant increase in cell numbers at each time point. All data points were generated with n = 3.
To analyze the surface encouraged cell behavior, SEM analysis of cell-laden hydrogel was performed (Figure 7). The SEM images confirmed that cells were adhere selectively to the walls of Odex scaffolds and indicating for initiation of cellular clump on day 2 (Figure 7(a) and (b)). To confirm the role of Odex-based surface chemistry, hydrogel having TC cross-linked by glutaraldehyde was used as a control for cell adhesion and tumor formation analysis. On control scaffolds, cells were attached consistently with fibroblastic morphology (Figure 7(c) and (d)). The cellular clumps on MDC hydrogel were grown in size from 44.63 ± 5.87 µm at day 2 to 68.38 ± 16.92 at day 4. While the control surfaces continued to represent as cell adhesive substrate (Figure 7(e)–(l)). The size of microtumor was not grown significantly from days 4 to 6 on MDC scaffold; however, an increase in number of microtumors per scaffold and ECM production was observed. The size of microtumor was not grown significantly from days 4 to 6 on MDC scaffold; however, an increase in number of microtumors per scaffold and ECM production was observed. The number of microtumor were 10.33 ± 0.88 at day 4 which were increased to 16.33 ± 4.25 microtumors per area (1000 × 750 µm2 area). Moreover, the SEM images display tumor spheroids at day 4 had distinct cell periphery (Figure 7(f)). Interestingly, at day 6, the images are showing compact microtumor structure where cells were entirely covered by ECM molecules. The microtumors were visualized as single sphere without having any cellular boundary (Figure 7(j)). These results indicate ECM production in microtumors at day 6. The presence of collagen in the microtumor displayed in immunostaining images confirms that the microtumors are producing ECM in MDC hydrogel. The SEM images revealed that the morphology and topography of control scaffold and MDC scaffolds were similar. Interestingly, A549 cells when grown on control were proliferating but were flattened, homogeneously spreaded as monolayer, whereas the tumor cells were having spherical morphology and multilayer growth on MDC scaffold. These studies indicated that MDC scaffolds are biocompatible for the lung cancer cells to proliferate, along with that it encourages the cells to initiate the 3D tumor formation at multiple sites from day 2 onward.

SEM micrograph of cell growth and morphology on MDC versus control hydrogel. Cellular morphology at day 2 on (a, b) MDC scaffold and (c, d) control scaffold. Cellular structure at day 4 on (e, f) MDC and (g, h) control; at day 6 on (i, j) MDC and (k, l) control. Scale bar: a, c, e, g, i, k: 200 µm; b, d, f, h, j, l: 30 µm.
Furthermore, to quantify the cellular morphological features, the structural measurement of cells in SEM images was accomplished with ImageJ software. The result showed that area of cell was 101.08 ± 29.72 µm in MDC hydrogel, while in control it was 156.15 ± 36.36 µm (Figure 8(a) and (b)). These data confirmed flattened and spreaded morphology of cells in control scaffold. Moreover, the perimeter, major axes, and minor axes of cells in MDC hydrogel were smaller than the control. This could be due to increase in geometry of cellular structure in MDC hydrogel, which decreased the cell spreading and therefore 2D surface area.54,55 In support to that, the circularity of cells, which indicates the shape of cell, was 0.87 ± 0.09 µm for MDC hydrogel while in control it was 0.39 ± 0.055 µm (Figure 8(c)). These data confirm that the cells in MDC hydrogel had round shape compared to control, which had more elongated structure. The solidity of cell positively associated with matrix stiffness. The increased solidity represents more smoother and compact cellular shape and less cell deformability.56,57 The cells in MDC hydrogel showed little higher solidity than control which demonstrated that the stiffer substrate provides higher contractile forces to cell resulting in formation of smoother cell membrane.
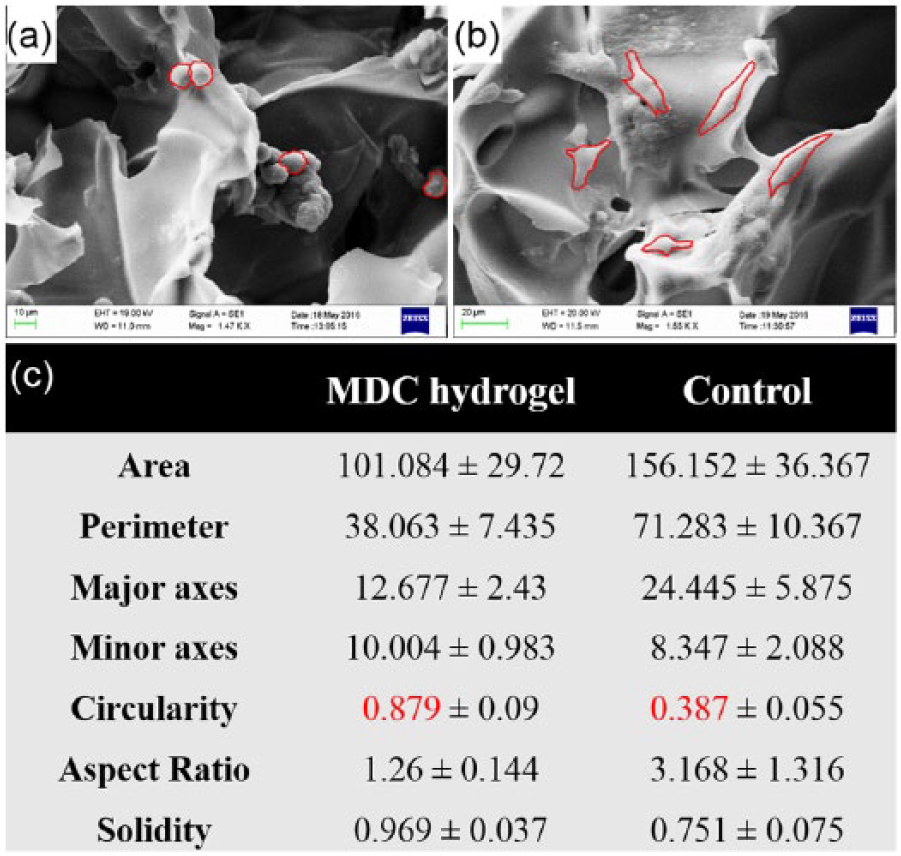
SEM images showing cellular morphology of the microtumors generated on MDC hydrogel and control. (a) Cell morphology on MDC hydrogel. (b) Cell morphology on control scaffolds. (c) Table showing the morphological characteristics of cells on respective hydrogel calculated from respective SEM images. Red line in the SEM images shows peripheral area of individual cell. For each calculation, n = 3 images were selected and the structural parameters were determined by ImageJ software.
The surface chemistry of MDC scaffolds has restricted the cell adhesion to scaffold. The cells adhere to adjacent cells and ECM molecules via adhesion receptors. These adhesion molecules such as integrin, selectin, and cadherin bridge over the external ECM molecules to intracellular cytoskeleton and transpose the external signals to nucleus and determine cell fate. Consequently, cell adapts the structural features depending upon the chemical cues from external environment. The change in structure alters the exposure of signaling proteins, which ultimately results in changing the cell fate.58,59 As shown in a study, 3D aggregates of A549 cells exhibited expression of epithelial markers collagen IV and laminin at basolateral surface than monolayer culture, consequently resulting in higher cytokine level and infection resistance to pathogenesis in 3D cellular aggregates. 60 It was well studied that the cell’s association to its surrounding environment directs the cellular morphology, proliferation, apoptosis, and gene expressions.61–64 For instance, breast tumor cells endogenously express β4 integrin and are sensitive to apoptosis in both 2D and 3D conditions. Nevertheless, when these cells were induced to form polarized structure by biochemical signaling in 3D reconstituted basement membrane (rBM), they acquired an apoptosis-resistant phenotype with endogenously activated nuclear factor (NF)-κB p65. 65 This resistance highlights a connection between cellular polarity and intracellular signaling directing cell fate. In another study, the effect of surface property on cancer stem cell phenotype was studied. It was observed that human glioblastoma cell lines U-87 MG and U-118 MG were formed spheroids on chitosan–alginate scaffolds which was having 62% CD 133+ stem cell population. Conversely, when these cells cultured on poly(ε-caprolactone) (PCL) scaffolds or PCL-coated chitosan–alginate scaffolds having similar 3D structure to chitosan–alginate scaffolds, they were grown as clusters. 66 Moreover, there was a 1%–2% CD 133+ cells were observed on these scaffolds. This study suggested that it was probably a combination of the 3D environment and chemical property of the scaffolds that promoted formation of the microtumor. The development of microtumor was encouraging the growth of cancer stem cells. These studies proposed the relation between surface chemistry based cell morphology and their effect on tumor cell phenotype. It supports the microtumor formation on MDC hydrogel in this study was having different phenotypic expression and resemblance of in vivo solid tumors.
To evaluate the viability of cells grown on MDC scaffolds, confocal microscopy with live-dead staining was performed (Figure 9). The result demonstrated that the cells were grown as aggregates with negligible number of dead cells. The size of microtumors were 60 ± 23 µm on day 2 (Figure 9(a)–(c)), 146 ± 29 µm on day 4 (Figure 9(d)–(f)), and 178 ± 24 µm on day 6 (Figure 9(g)–(i)). Moreover, the number of microtumors per scaffold was also increased from day 4 to day 6. Z-stacking image of 100 µm range was implemented on day 6 for the cell-laden scaffolds (see Supplementary Video). The microtumors were not only expanded in x-, y-axes but the z-axis also showed the size more than 100 µm. These results demonstrated that MDC scaffold is highly supportive of tumor cell viability and growth. In addition to that, these results confirm 3D distribution of cells inside the scaffold establishing 3D microtumors consistent with previous results.

Confocal images of A549 cells on MDC hydrogel stained with live-dead stain. The green color cells represent live cells and red for dead cells. (a–c) 2 days, (d–f) 4 days, (g–i) 6 days of culture. Scale bar: 200 µm.
Cytoskeleton organization
The stress fibers were randomly distributed throughout the cell having large nuclear area surrounded by actin fibers (Figure 10(a)). Expansion in gross nuclear size is often associated with cancerous tissue. 67 It has been also reported that majority of animal cells exhibit intense stress fibers aligned with their major axes when exposed to rigid substrates, like plastic or glass. On the other hand, cells grown on compliant substrates show very thin and randomly arranged stress fiber structures.49,68 Since MDC scaffold stiffness is closer to native tumor ECM, similar arrangement of randomly oriented stress fiber was observed (Figure 10(b) and (c)).

Confocal images of A549 cells on MDC hydrogel. (a–c) Stress fiber arrangement and nucleus size on microtumor, (a) Z-stacking and 3D reconstructed image of microtumor formation in scaffolds having cells cytoskeleton arrangement in microtumors. Scale bar: 100 µm. (b) 40×, (c) 100×. Scale bar: 20 µm.
ECM protein expression
Increased ECM proteins deposition is associated with cancer progression. Cancer cell-derived ECM proteins increase matrix density and provide cell-stromal crosstalk. Collagen is a major component of ECM. To evaluate whether cancer cells in MDC hydrogel produce ECM proteins, collagen IV expression was determined by immunostaining. Figure 11(a)–(c) shows the expression of collagen throughout microtumor. The increased collagen deposition in tumor stroma directly associated with matrix stiffness, which enhances the integrin signaling and elevates cell survival and proliferation.4,69–71 Microtumor formation in the MDC scaffolds was having not only tumor cell aggregates, but having ECM-based complex microenvironment like in vivo tumor. On the whole, these observations suggested a well representative microtumor formation in the MDC scaffolds.

Immunostaining of paraffin-sectioned cell-laden MDC scaffold showing collagen expression: (a) nucleus stained by DAPI, (b) collagen expression stained by Alexa Fluor® 568 tagged antibody, and (c) merged image, scale bar: 50 µm.
ROS generation
As tumor expands beyond oxygen diffusion limit, it generates oxygen gradient toward the core. Reduction of oxygen inside the tumor creates tissue hypoxia. Hypoxia directly or indirectly generates ROS. 72 ROS was determined as preliminary indicator of hypoxia in the microtumor generated on MDC scaffolds and compared with cells grown on 2D TCPS surface. The each absorbance from DCFDA assay value was divided by cell numbers from respective scaffolds indicating arbitrary units per cell. The graph showed more than 15-fold increase in ROS generation in MDC scaffolds compared to 2D TCPS culture (Figure 12(a)) at every time points. These data corroborate with morphology analysis where microtumor formation was observed from day 2. The ROS was increased to 19.61-fold at 6-day grown microtumors. Cells proliferated on flat tissue culture plate had monolayer morphology. Therefore, the oxygen diffusion was homogeneous throughout the area in 2D culture. On the other hand, oxygen diffusion was decreased in the core of microtumor, which produced a gradient of oxygen concentration. In this study, the cells were grown on scaffolds as 3D and on TCPS as 2D control with having similar nutrient, cell passage, cell numbers, and external conditions. The dimensionality was the major difference between the samples which could induce ROS by hypoxic pathways. It was studied that ROS can be produced by hypoxic conditions and ROS level was reported as indirect evidence of hypoxia in 3D models73,74 Therefore, in the study, it was anticipated that the increased ROS could be due to hypoxic conditions in 3D. However, the ROS would be the indirect indicator of hypoxic condition, additional study would be performed to confirm this finding. The hypoxic environment is the characteristic feature of solid tumor having poor oxygen and nutrient tension leading to produce hypoxia.75,76 Hypoxia, in turn, activates HIF-1α which modulate cell survival, proliferation, metastasis, and drug response.77–80 Therefore, mimicking hypoxic condition could increase the consistency of this model for drug toxicity assays.

(a) DCFDA assay showing ROS production in 2D versus in the microtumors at specific time point. (b) Cell viability of A549 cells after treatment with doxorubicin drug. All experiments were done with n = 3.
Drug toxicity
To determine the utility of MDC scaffold as a model for drug screening assays, doxorubicin was used as a model anticancer drug to evaluate drug toxicity. Doxorubicin is a well-recognized chemotherapeutic drug known to stabilize deoxyribonucleic acid (DNA)-winding enzymes, intercalate with DNA, and target several downstream molecules to exhibit various cytotoxic effects. For 2D condition, cells were grown for 24 h and treated with 25, 50, and 100 µM drug for 24 h. For 3D scaffolds, cells were allowed to grow for 2, 4, or 6 days and after each time point, similar dosage was applied to 2D condition. Figure 12(b) represents percent cell viability with respect to control for each time point. The graph showed that at 25 µM concentration, 50% cells were viable in the case of the 2D surface while in case of all 3D conditions, the cell viability was more than 39% after 2 days, while at 4 and 6 days grown microtumors, 57% and 83% cells, respectively, were survived. The microtumors size was increased when grown for a longer duration, which might restrict the drug diffusion toward the center. Contrariwise in 2D, equivalent drug was available throughout the culture. Therefore, overall effect of drug was reduced in 3D culture compared to monolayer culture. At higher dosage of 50 and 100 µM, the cell survival was continued to decrease to 46% and 19%, respectively, in TCPS culture. Nevertheless, the cell viability was 55% and 51% on 4-day and 78% and 77% on 6-day grown microtumors for 50 and 100 µM dosage, respectively. These data indicated that increasing dosage from two- to fourfold did not show significant effect on cell viability as the microtumor size increases. The cells might have less susceptibility to drugs in 3D tumor compared to monolayer.53,81 Hence, dose-dependent toxicity was minimized in expanded microtumors.
This higher drug resistance of cells, when grown as 3D microtumor, might be due to the following aspects. The primary difference in physiological condition of cells in 2D and 3D may attribute to alter the drug response. The 2D cultures were having cells with stretched and monolayer morphology, while in present 3D tumor model, cells were having rounded and clustered morphology which represents in vivo tumors.82,83 Next, due to morphological changes, 3D distributions and spatial organizations of surface receptors would be differently expressed in 3D tumors. 84 Thus, drugs which target these specific receptors would change the drug efficacy in 3D tumors. Moreover, the cells growing in 3D microenvironment have different gene expression than cells in monolayer having an unnatural condition. 5 The collagen expression could increase the cell–ECM interaction which gives rise to complex microenvironment. Overall, the 3D tumor sphere surrounding with ECM proteins could subjugate the drug diffusion and penetration. Therefore, the drug toxicity could be reduced. Furthermore, the larger microtumors had oxygen and nutrient gradient throughout the sphere forming heterogeneous populations, having dormant cells in the core, while actively proliferating cells in the outer region. These might evolve stem cell population, which are more resistant to drugs. However, this possibility should be further investigated by P-glycoprotein (P-gp) expression in the cells to validate multi-drug resistance in the cells. Furthermore, hypoxic conditions and higher glycolysis may change intracellular pH which reduces the efficacy of weakly basic drug like doxorubicin by reducing drug uptake, developing drug resistance.85,86
Conclusion
The primary objective of this study was to fabricate a cell-instructive 3D scaffold for controlled cell adhesiveness to the cells to expand in clumps. Two natural biopolymers, chitosan and dextran, were modified for this work. The Odex has aldehyde groups in its backbone, which reacted with the amine group of chitosan and formed polymer network structure. This self-gelling property makes present model very easy to fabricate and eliminates the dependency of small chemical cross-linkers which otherwise should be removed after fabrication process. The reported hydrogel can be produced in any shape and size without affecting the physiochemical properties which makes it versatile scaffolds for cell growth study to bioimaging. Furthermore, 3D microporous structure could compartmentalize the cells and facilitate multiple tumor tissue formation which is not possible in existing scaffold-free spheroid culture methods. The incorporation of biocompatible dextran demonstrated the reduction in hydrophobicity of scaffold which has improvised its mechanical property and twofold increase of the cell circularity indicating 3D tumor tissue formation. This study clearly demonstrates that 3D geometry not only could support the 3D tumor formation, but its biochemical property is also very much required for the 3D microtumor formation. The growing tumor tissues were characterized by SEM and confocal microscopy for their shape, cytoskeleton organization, and ECM synthesis. The change in cell morphology and random stress fibers further supported the contribution of scaffold in tumor formation. As the 3D tumors expand, there are nutrient and oxygen diffusion rate limitations occur, which can create hypoxic conditions. A similar observation was made in this study with elevated ROS level resembling to in vivo condition. At the end, this study demonstrated the drug toxicity assay for microtumors and compared it with conventional 2D culture model. The drug toxicity assay clearly indicated that the tumor behavior was affected by geometry and biochemical microenvironment and presented an altered drug response compared to 2D culture.
In summary, this study demonstrated two-step method for developing 3D tumor including scaffold fabrication and cell seeding. However, it can be upgraded to one step by live cell encapsulation during fabrication and could also be explored for 3D printing of cells. We have utilized this scaffold for tumor cells; nevertheless, it could have applicability to use for other tissue engineering applications. In future, the scaffold can be potentially utilized for cancer disease modeling to understand fundamental questions regarding the effect of stiffness and cross-linking density on tumor phenotype and progression.
Footnotes
Acknowledgements
DK would like to thank the Department of Biotechnology (Govt. of India) for a research fellowship. Authors would also like to acknowledge Mr N.L. Chauhan, FCIPT-IPR, Gujarat, for SEM analysis.
Declaration of conflicting interests
The author(s) declared no potential conflicts of interest with respect to the research, authorship, and/or publication of this article.
Funding
This work was supported by the Gujarat State Biotechnology Mission (Govt. of Gujarat, India).
References
Supplementary Material
Please find the following supplemental material available below.
For Open Access articles published under a Creative Commons License, all supplemental material carries the same license as the article it is associated with.
For non-Open Access articles published, all supplemental material carries a non-exclusive license, and permission requests for re-use of supplemental material or any part of supplemental material shall be sent directly to the copyright owner as specified in the copyright notice associated with the article.