
Abstract
Lightweight protective armour solutions have potential applications ranging from infrastructure cladding and damage tolerant aerospace composites to sports helmets and body armour. Elastomeric cellular structures are a promising candidate solution and with advances in 3D-printing technology, ever more complex geometries can be explored in the pursuit of enhanced performance. Auxetic structures, which exhibit negative Poisson’s ratio behaviour and reported improved mechanical properties are of interest. Recently, 3D-auxetic structures have demonstrated the potential to outperform their 2D counterparts. This work investigates the performance of four candidate elastomeric cellular structures, 3D-printed in thermoplastic polyurethane (TPU): one non-auxetic, two 2D-auxetic and one 3D-auxetic. The structures are subjected to quasi-static compression, cyclic compression and low-velocity impact tests. Energy absorption diagrams, based on quasi-static compression data, are produced which demonstrate that the choice of most efficient energy absorbing structure depends on the specific energy of the threat. It is found that the 3D-auxetic re-entrant honeycomb structure outperforms all others for specific energies greater than 13.3 mJ/cm3. Cyclic compression tests demonstrate excellent recoverability, and thus reusability of all structures. Hysteresis is observed for all specimens, increasing with increasing maximum strain. Generally, the 3D-auxetic structure provides the greatest energy dissipation. The behaviour observed in the low-velocity impact tests appear consistent with the trends identified in the quasi-static tests. The 3D-auxetic structure is the best choice for absorbing high impact energies since it results in a lower stress being transferred when subject to an impact energy which causes densification. This work demonstrates the potential for 3D-auxetic elastomeric cellular structures to provide superior protective performance.
Introduction
Due to their high specific strength and impressive energy absorbing capabilities, cellular structures have gained interest for protective applications ranging from infrastructure cladding to personal protective armour (Ghazlan et al., 2020; Gibson and Ashby, 1999; Imbalzano et al., 2016; Qi et al., 2017; Wu and Sheikh, 2013). Advances in 3D-printing technology have enabled researchers to more readily explore a variety of cell geometries and cellular architectures in the pursuit of improved performance characteristics. Cellular structures that exhibit negative Poisson’s ratio (NPR) have attracted particular attention, beginning with the seminal work of Lakes (Lakes, 1987) and continuing to the present day (Zhang et al., 2020). Structures that exhibit NPR are known as auxetic structures - they differ compared to conventional structures in that when subjected to compressive loading, they contract in the direction perpendicular to the applied force. This unusual behaviour gives rise to beneficial mechanical properties such as improved energy absorption, fracture toughness, shear modulus and indentation resistance (Bezazi and Scarpa, 2007; Evans and Alderson, 2000; Ingrole et al., 2017; Liu, 2006; Qi et al., 2017; Sanami et al., 2014).
Auxetic structures continue to be studied for their protective performance (Al-Rifaie & Sumelka, 2019, 2020; Dudek et al., 2017; Hou et al., 2016; Imbalzano et al., 2018). Most historic efforts have been dedicated to the examination of 2D-auxetic structures i.e. structures comprised of periodic 2D extensions of the same unit cell. Investigations have typically focused on re-entrant (Alomarah et al., 2018; Gao et al., 2020; Liu et al., 2016; Masters and Evans, 1996; Wan et al., 2004; Wang et al., 2018), arrowhead (Boopathi et al., 2020; Qiao and Chen, 2015; Zhang et al., 2014), chiral and rotational (Fu et al., 2018; Jiang and Li, 2017; Zhang et al., 2018) geometries where authors have interrogated the links between geometry, NPR behaviour and mechanical properties via a combination of analytical modelling, finite element analysis and experimentation.
However, it has been noted that 2D-auxetic structures work only within a plane which significantly limits their practical applications (Cui et al., 2023). Instead, more recent research efforts have been dedicated to the development of 3D-auxetic structures i.e. structures which contract along two normal lateral directions under compression along the third direction (Ren et al., 2018). Advancements in additive manufacturing have enabled relative ease of manufacture of these complex 3D-auxetic designs in a variety of base materials including titanium (Yang et al., 2015), steel (Sun et al., 2022; Wei et al., 2023; Yang et al., 2019) and polymers (Alomarah et al., 2019; Cui et al., 2023; Fu et al., 2016). Once again, research efforts have been focused on understanding how the geometrical parameters affect the NPR behaviour, and thus the mechanical properties. For example, Yang et al. (Yang et al., 2015) developed an analytical model of a 3D re-entrant honeycomb auxetic cellular structure, indicating that a wide range of mechanical property control is achievable through altering the geometrical design parameters. Fu et al. (Fu et al., 2016) also interrogated a 3D-auxetic structure based on the 2D re-entrant honeycomb, fabricating it using acrylonitrile–butadiene–styrene (ABS) via 3D-printing. Numerical modelling was then used to interrogate the effect of geometrical parameters and deformation on the auxetic behaviour. Alomarah et al. (Alomarah et al., 2019) proposed a novel 3D re-entrant chiral auxetic structure, 3D-printing it in polyamide 12. They found the deformation mode, energy absorption and Poisson’s ratio were strongly influenced by the loading direction. A recent study by Wei et al. (Wei et al., 2023) examined the in-plane compression behaviour of a novel 3D star-triangular honeycomb (STH) manufactured from stainless steel. They found that compared to the 2D-STH, the 3D-STH had better deformation stability and energy absorbing characteristics.
Despite these encouraging results, it is interesting to note the lack of studies on elastomeric 3D-auxetic structures. Elastomers offer significant potential in lightweight armour design owing to their hyperelasticity, strain recoverablity and flexibility - attributes which could offer particular advantages in the design for personal protective armour for example. Thermoplastic polyurethane (TPU) is an elastomer block co-polymer known to have excellent impact properties and abrasion resistance (Bates et al., 2019; Yi et al., 2006). Yuan et al. (Yuan et al., 2017) investigated the fabrication of 3D soft auxetic structures using selective laser sintering with TPU powders. They reported that the soft TPU auxetic lattices were capable of withstanding repeated compression cycles over large deformations and highlighted the large potential for the design of TPU-based cellular structures for energy absorption.
However, to the best of the authors’ knowledge, no studies exist comparing the performance of elastomeric 3D-auxetic structures to their 2D counterparts under both quasi-static compression and low-velocity impact loading. This work aims to address these unknowns, contributing new knowledge towards the design of elastomeric protective armour. The present study considers four candidate elastomeric cellular structures: one non-auxetic, two 2D-auxetic and one 3D-auxetic. The specimens are manufactured via 3D-printing with TPU. An experimental study is pursued, subjecting the specimens to quasi-static compression and low-velocity impact loading. The performance of the four candidate specimens is then assessed and compared at each strain rate.
Specimen geometry
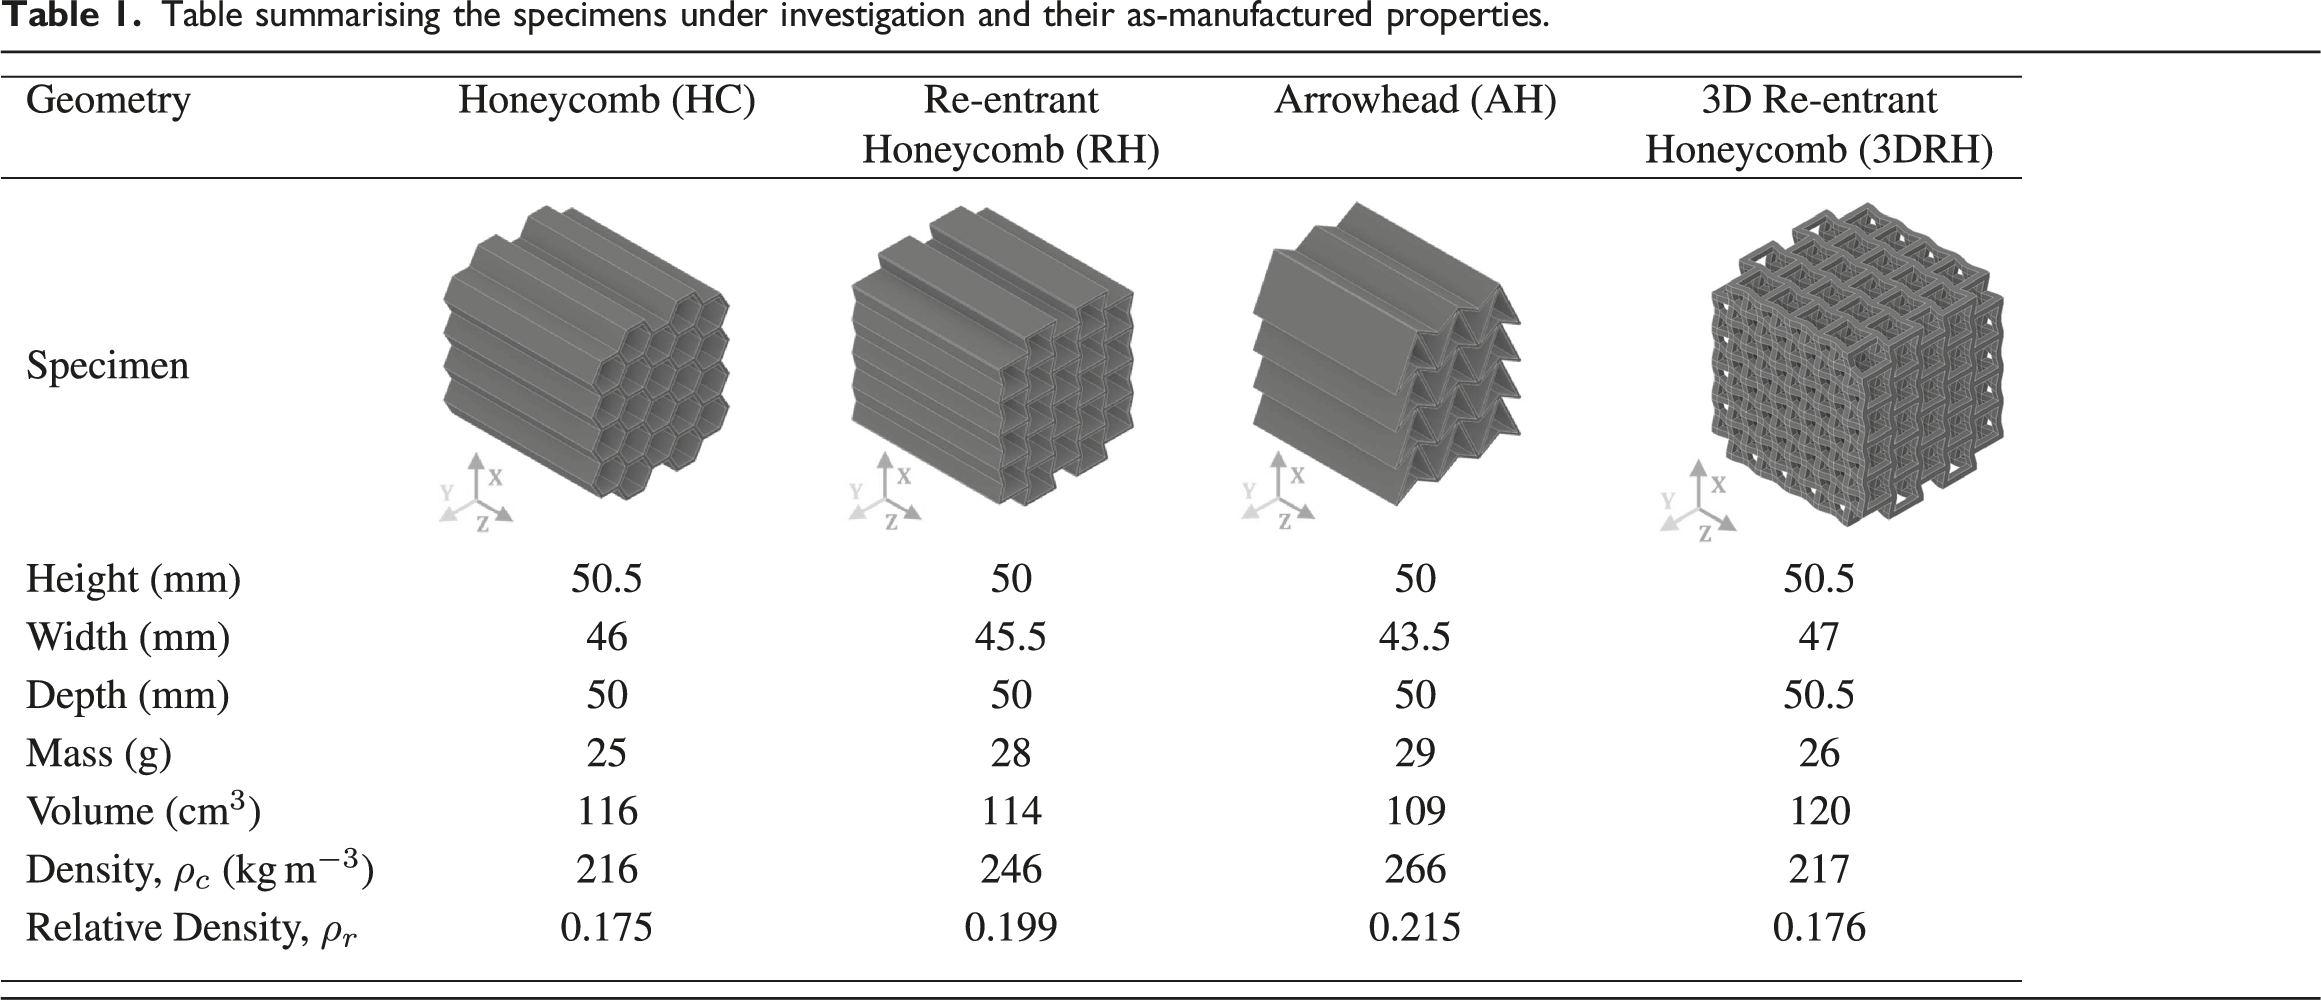
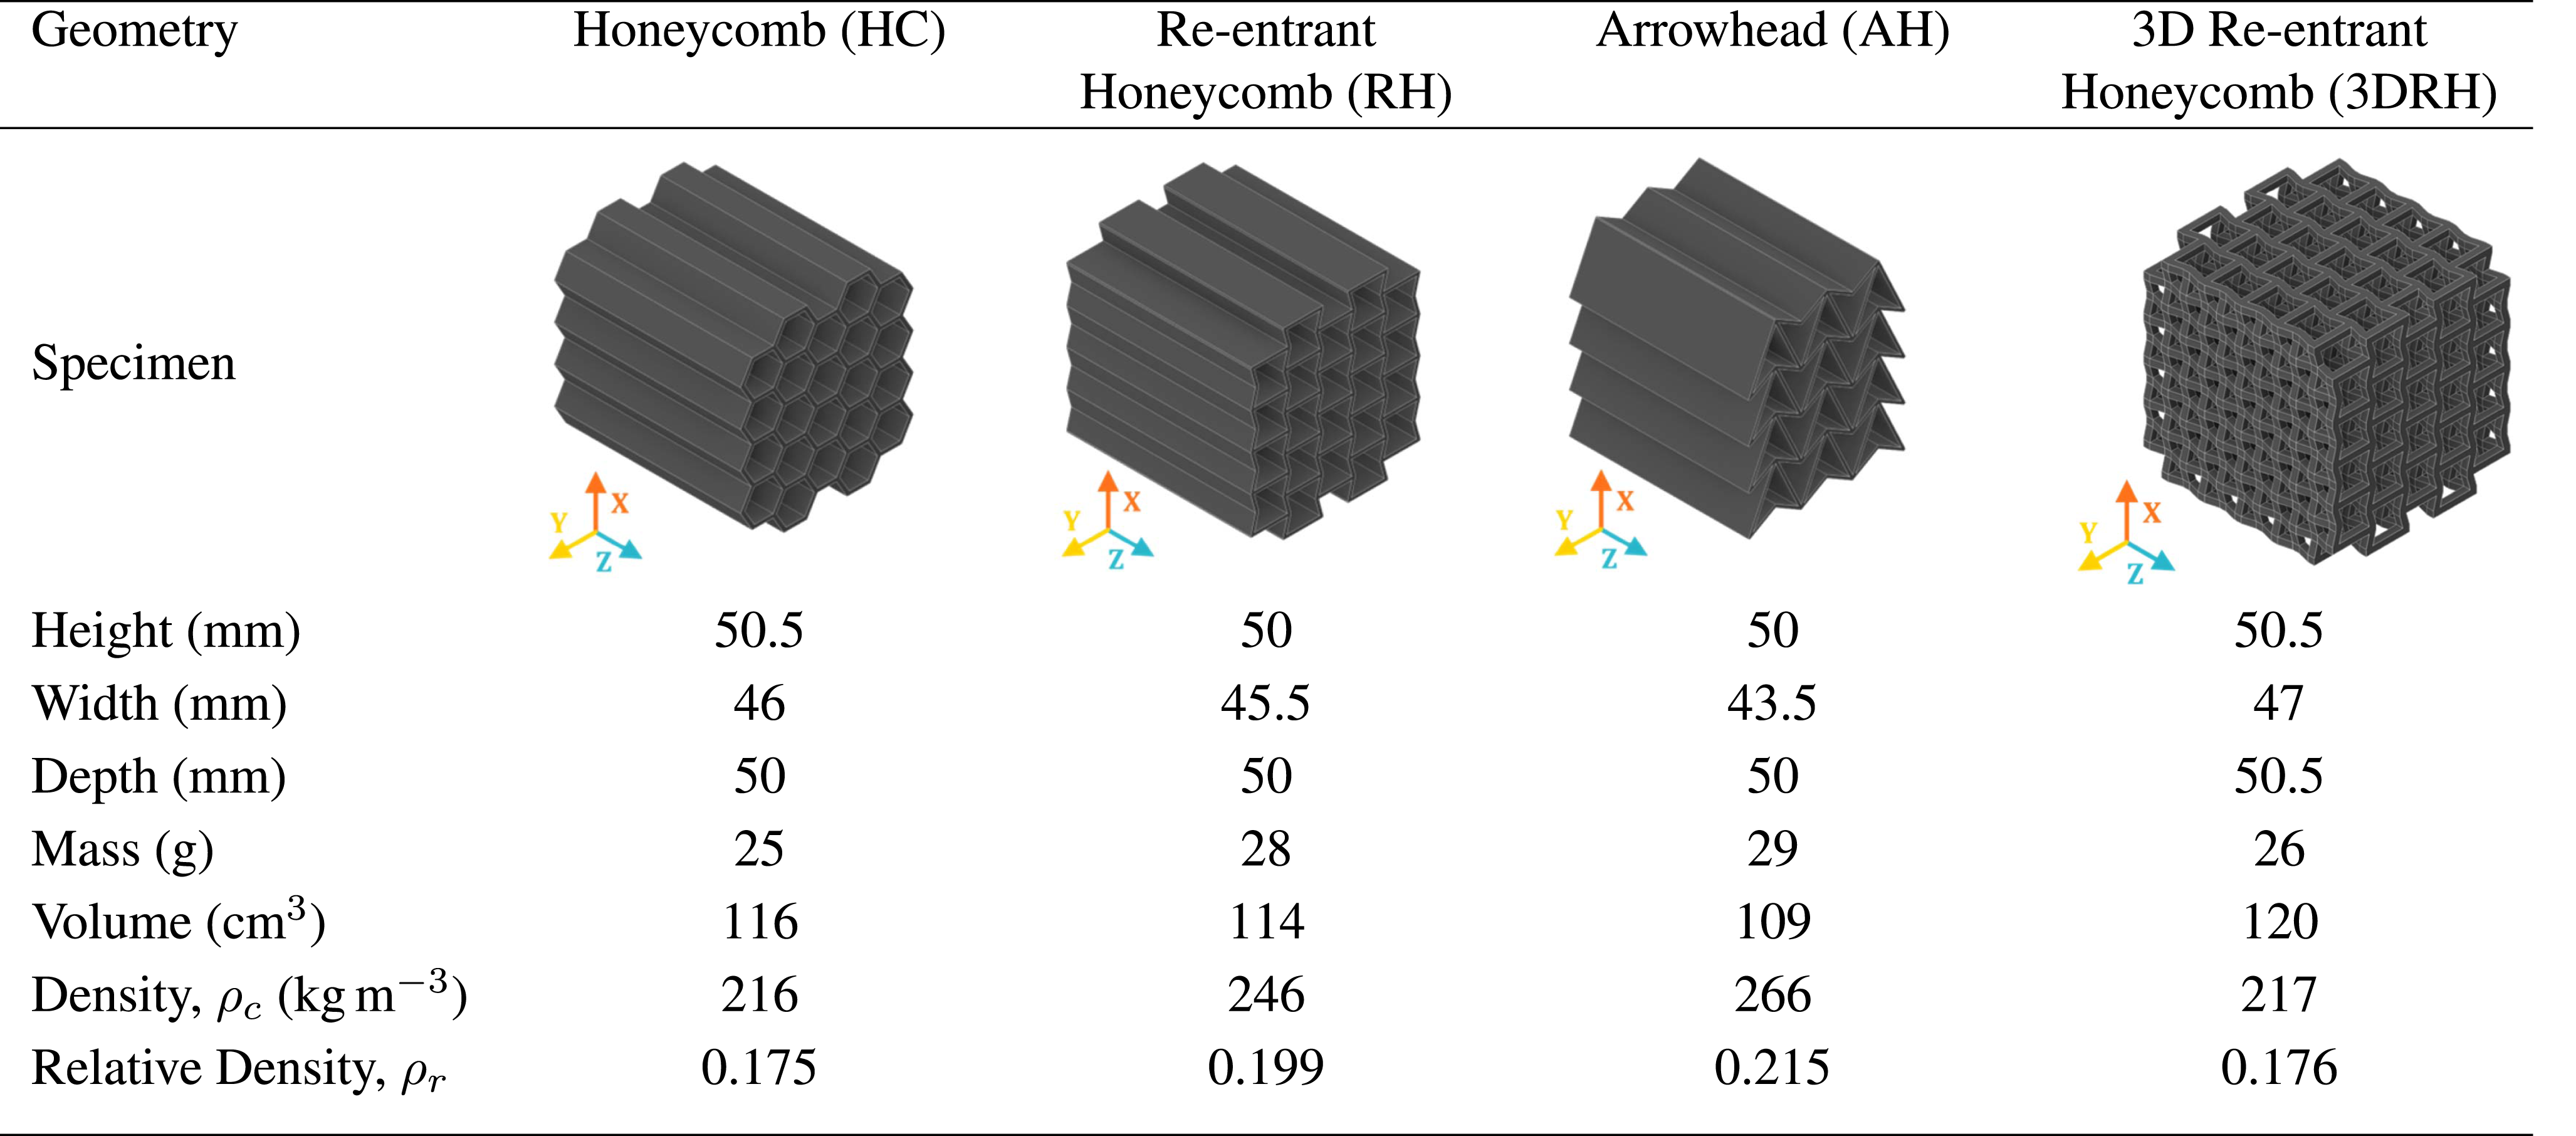
Table summarising the specimens under investigation and their as-manufactured properties.
Non-auxetic honeycomb (HC)
Figure 1 presents the regular hexagon unit cell geometry of the non-auxetic honeycomb structure investigated in this work. It was chosen for its simplicity and the prevalence of the honeycomb cellular structure in the literature. The regular honeycomb is an example of a non-auxetic structure and provides an interesting comparison to the other auxetic structures studied in this work. Unit cell geometry of the non-auxetic honeycomb specimen where h = 8.80 mm and t = 1 mm.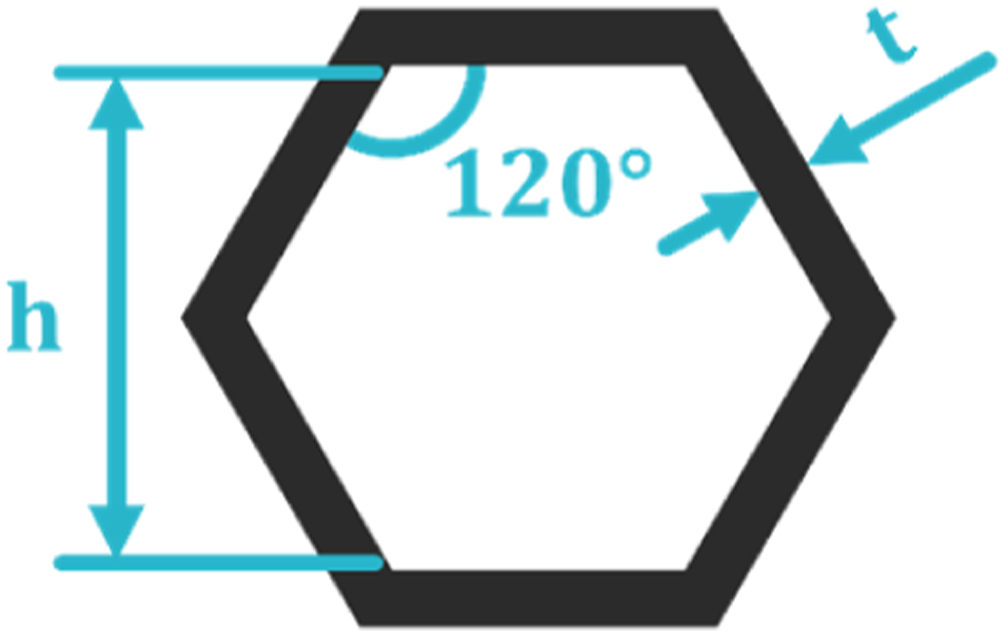
2D-auxetic Re-entrant honeycomb (RH) and arrowhead (AH)
For the 2D-auxetic structures, two unit cell geometries were chosen which are particularly common in the literature (Montgomery-Liljeroth et al., 2023): the re-entrant honeycomb and the arrowhead, as illustrated in Figure 2. The geometry of the re-entrant honeycomb unit cell was inspired by the work of Critchley et al. (Critchley et al., 2022) and for the arrowhead unit cell, inspiration was taken from the study by Remennikov et al. (Remennikov et al., 2019). Unit cell geometries of the 2D-auxetic specimens where in a) h = 8.98 mm and t = 0.85 mm and in (b) h = 15.05 mm and t = 0.72 mm.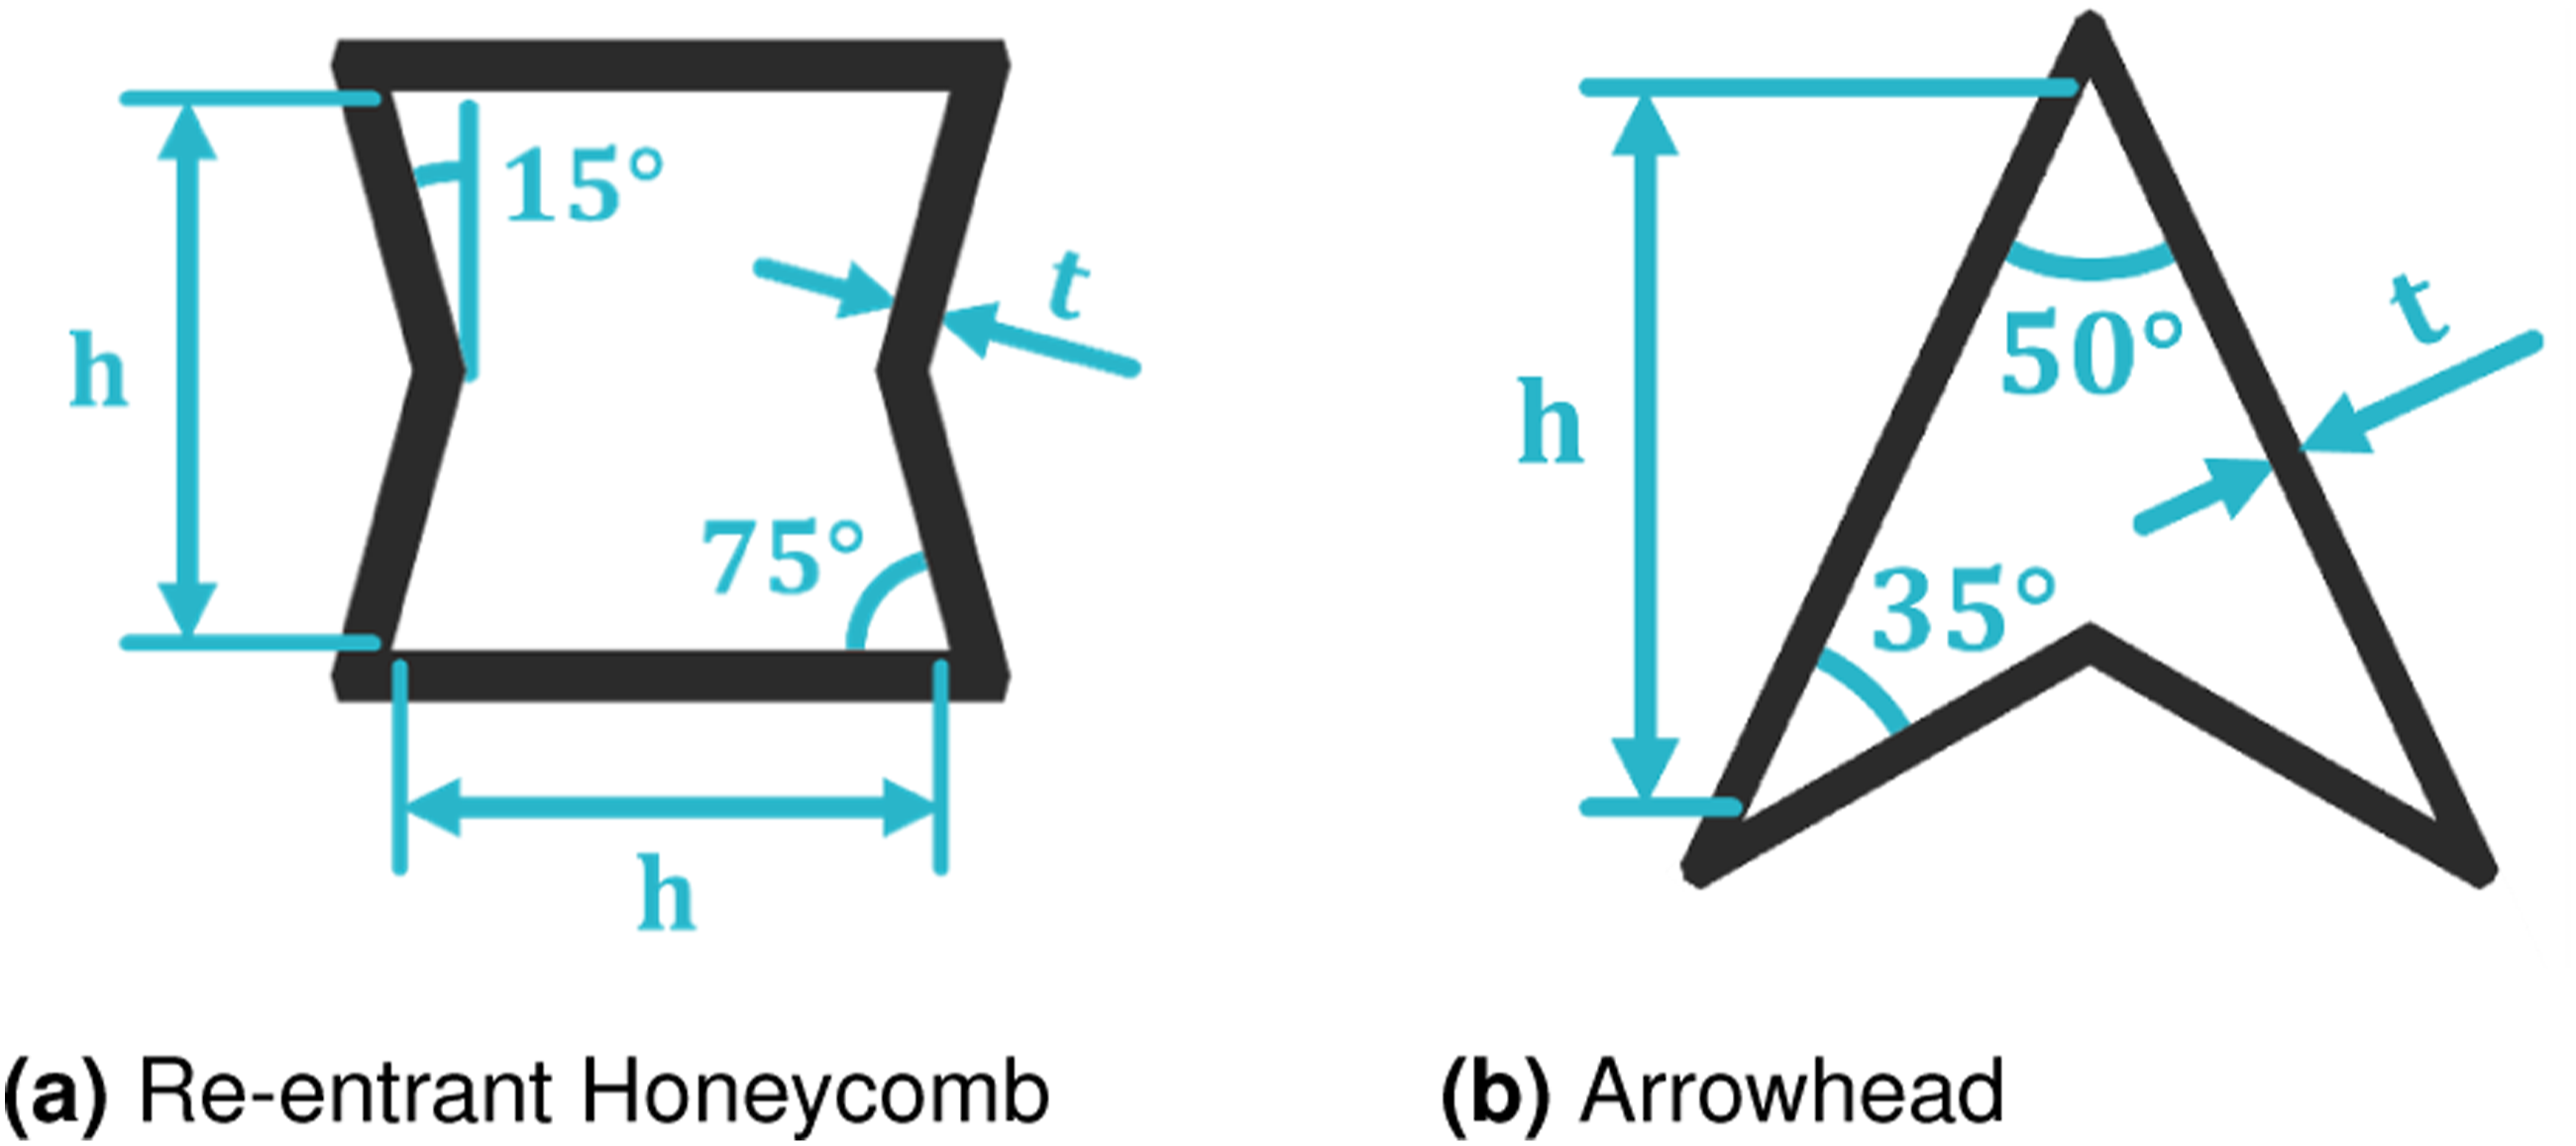
3D-auxetic Re-entrant honeycomb (3DRH)
The unit cell geometry for the 3D-auxetic re-entrant honeycomb structure is shown in Figure 3. This structure was first proposed by Evans et al. (Evans et al., 1994) and was further investigated analytically by Yang et al. (Yang et al., 2015). It has been shown that this type of auxetic structure exhibits orthotropy with negative Poisson’s ratios in all three principal directions (Yang et al., 2015). Unit cell geometry of the 3D-auxetic, re-entrant honeycomb specimen where h = 7.95 mm and t = 1.71 mm.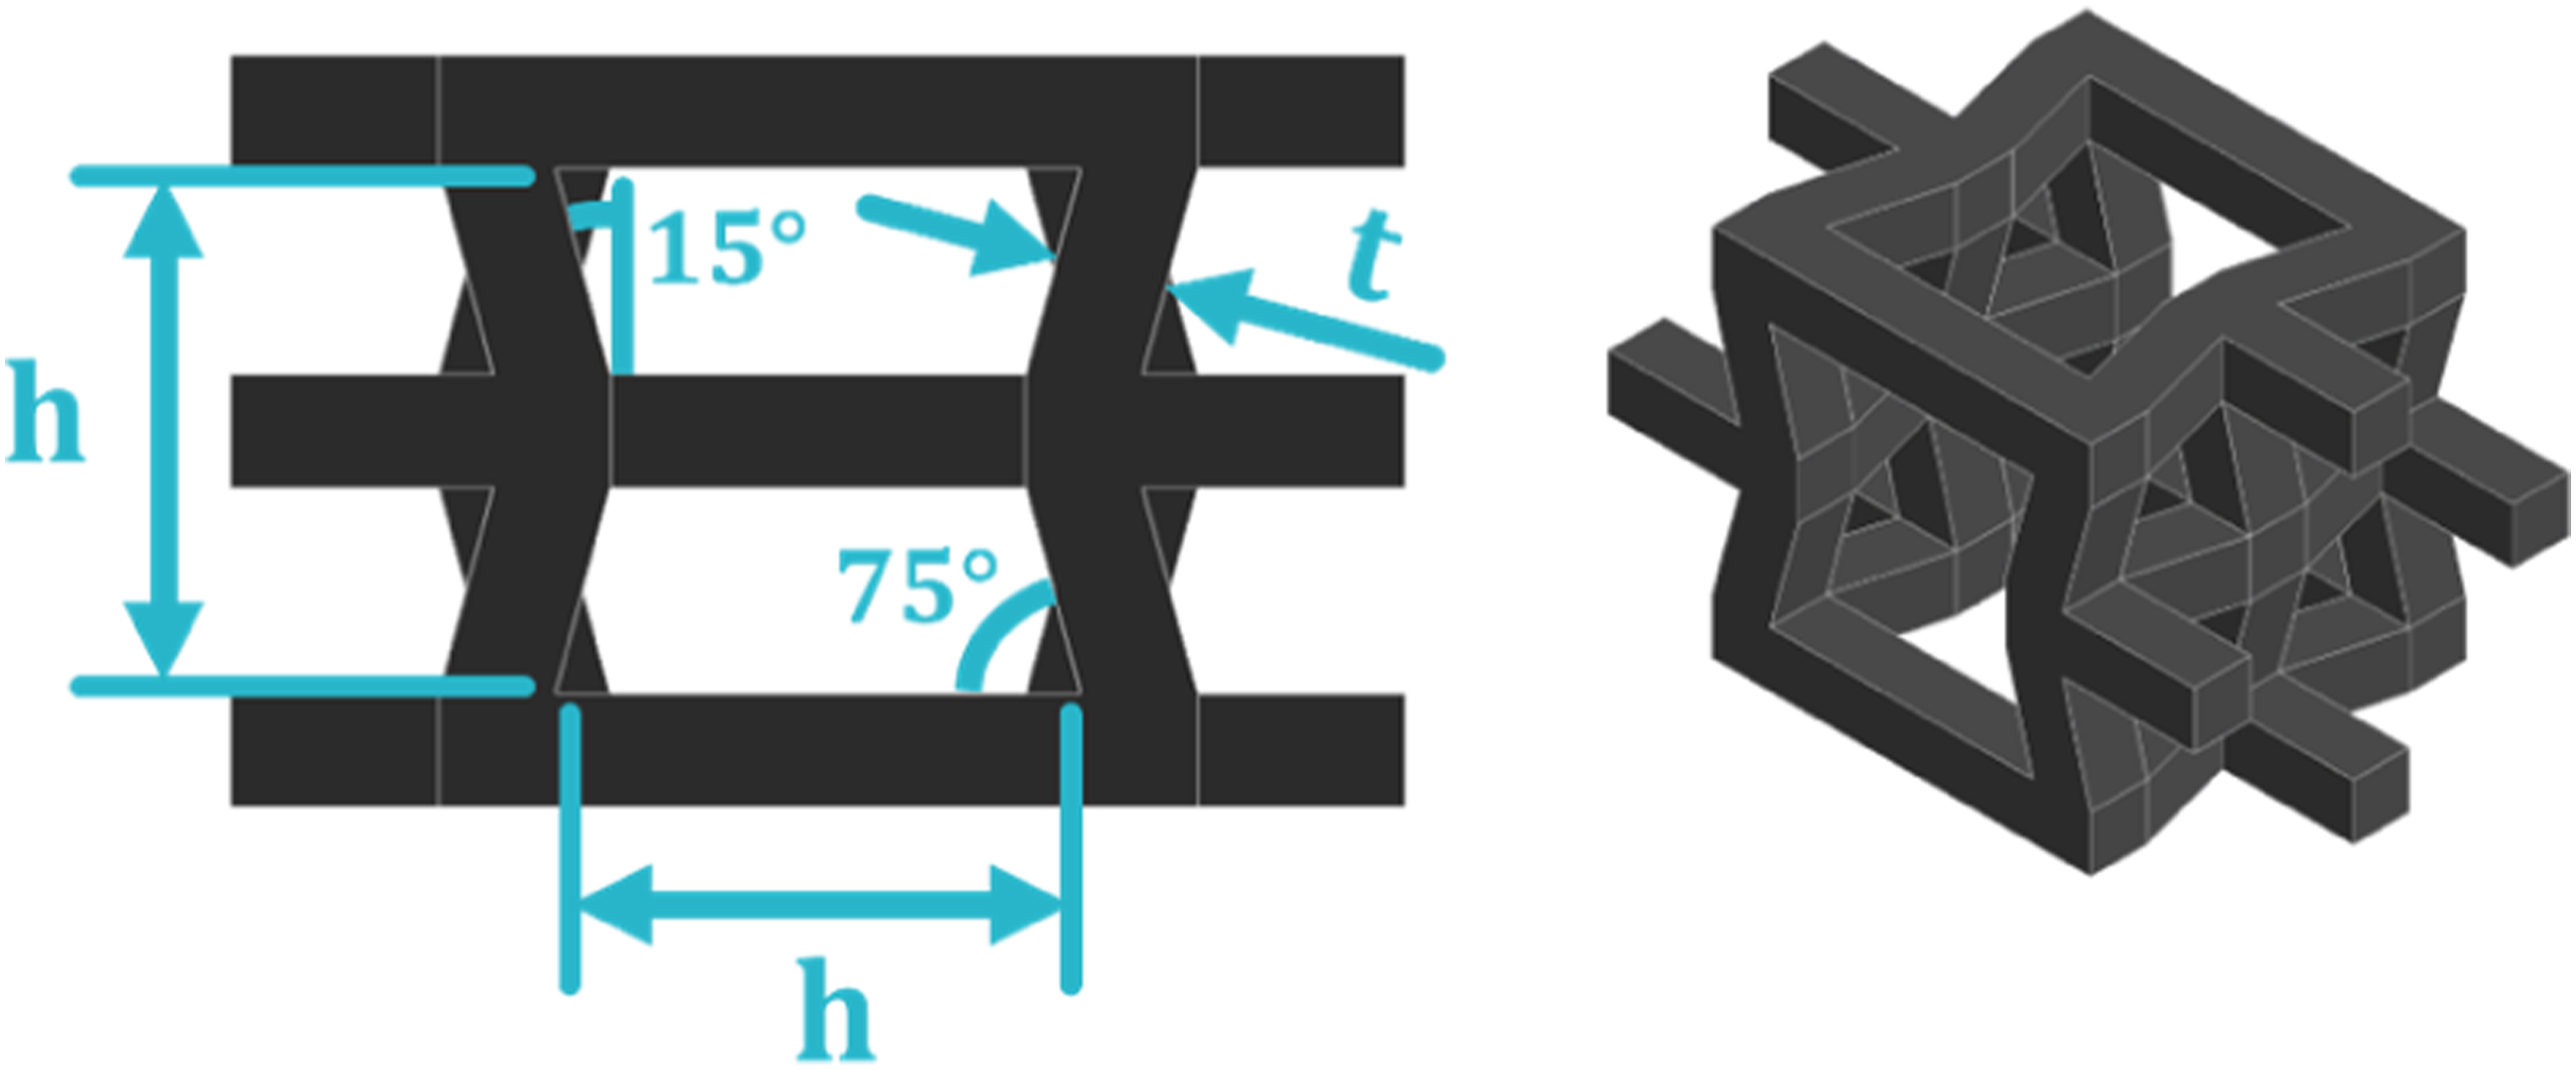
Experimental method
For the non-auxetic and 2D-auxetic specimens, testing was conducted in the X and Y directions, excluding the Z direction (see Table 1 for a definition of the X, Y and Z directions). For the 3D-auxetic specimen, testing was conducted in the X, Y and Z directions (Alomarah et al., 2018; Wang et al., 2018). All tests were conducted at room temperature.
Quasi-static compression
Quasi-static compression testing, based on standard ASTM C365, was performed using an Instron 5585H screw-driven testing machine, with a 250 kN load cell. As illustrated in Figure 4, the specimens were placed atop a rigid flat surface and a large diameter, rigid flat platen was used to uniformly compress the specimens. The tests were displacement-controlled, compressing the specimens at a rate of 2.5 mm/min, equivalent to a nominal strain rate, Quasi-static compression test apparatus: (1) Crosshead, (2) Travel limiter, (3) Load cell, (4) Flat platen, (5) Specimen, (6) Flat platen.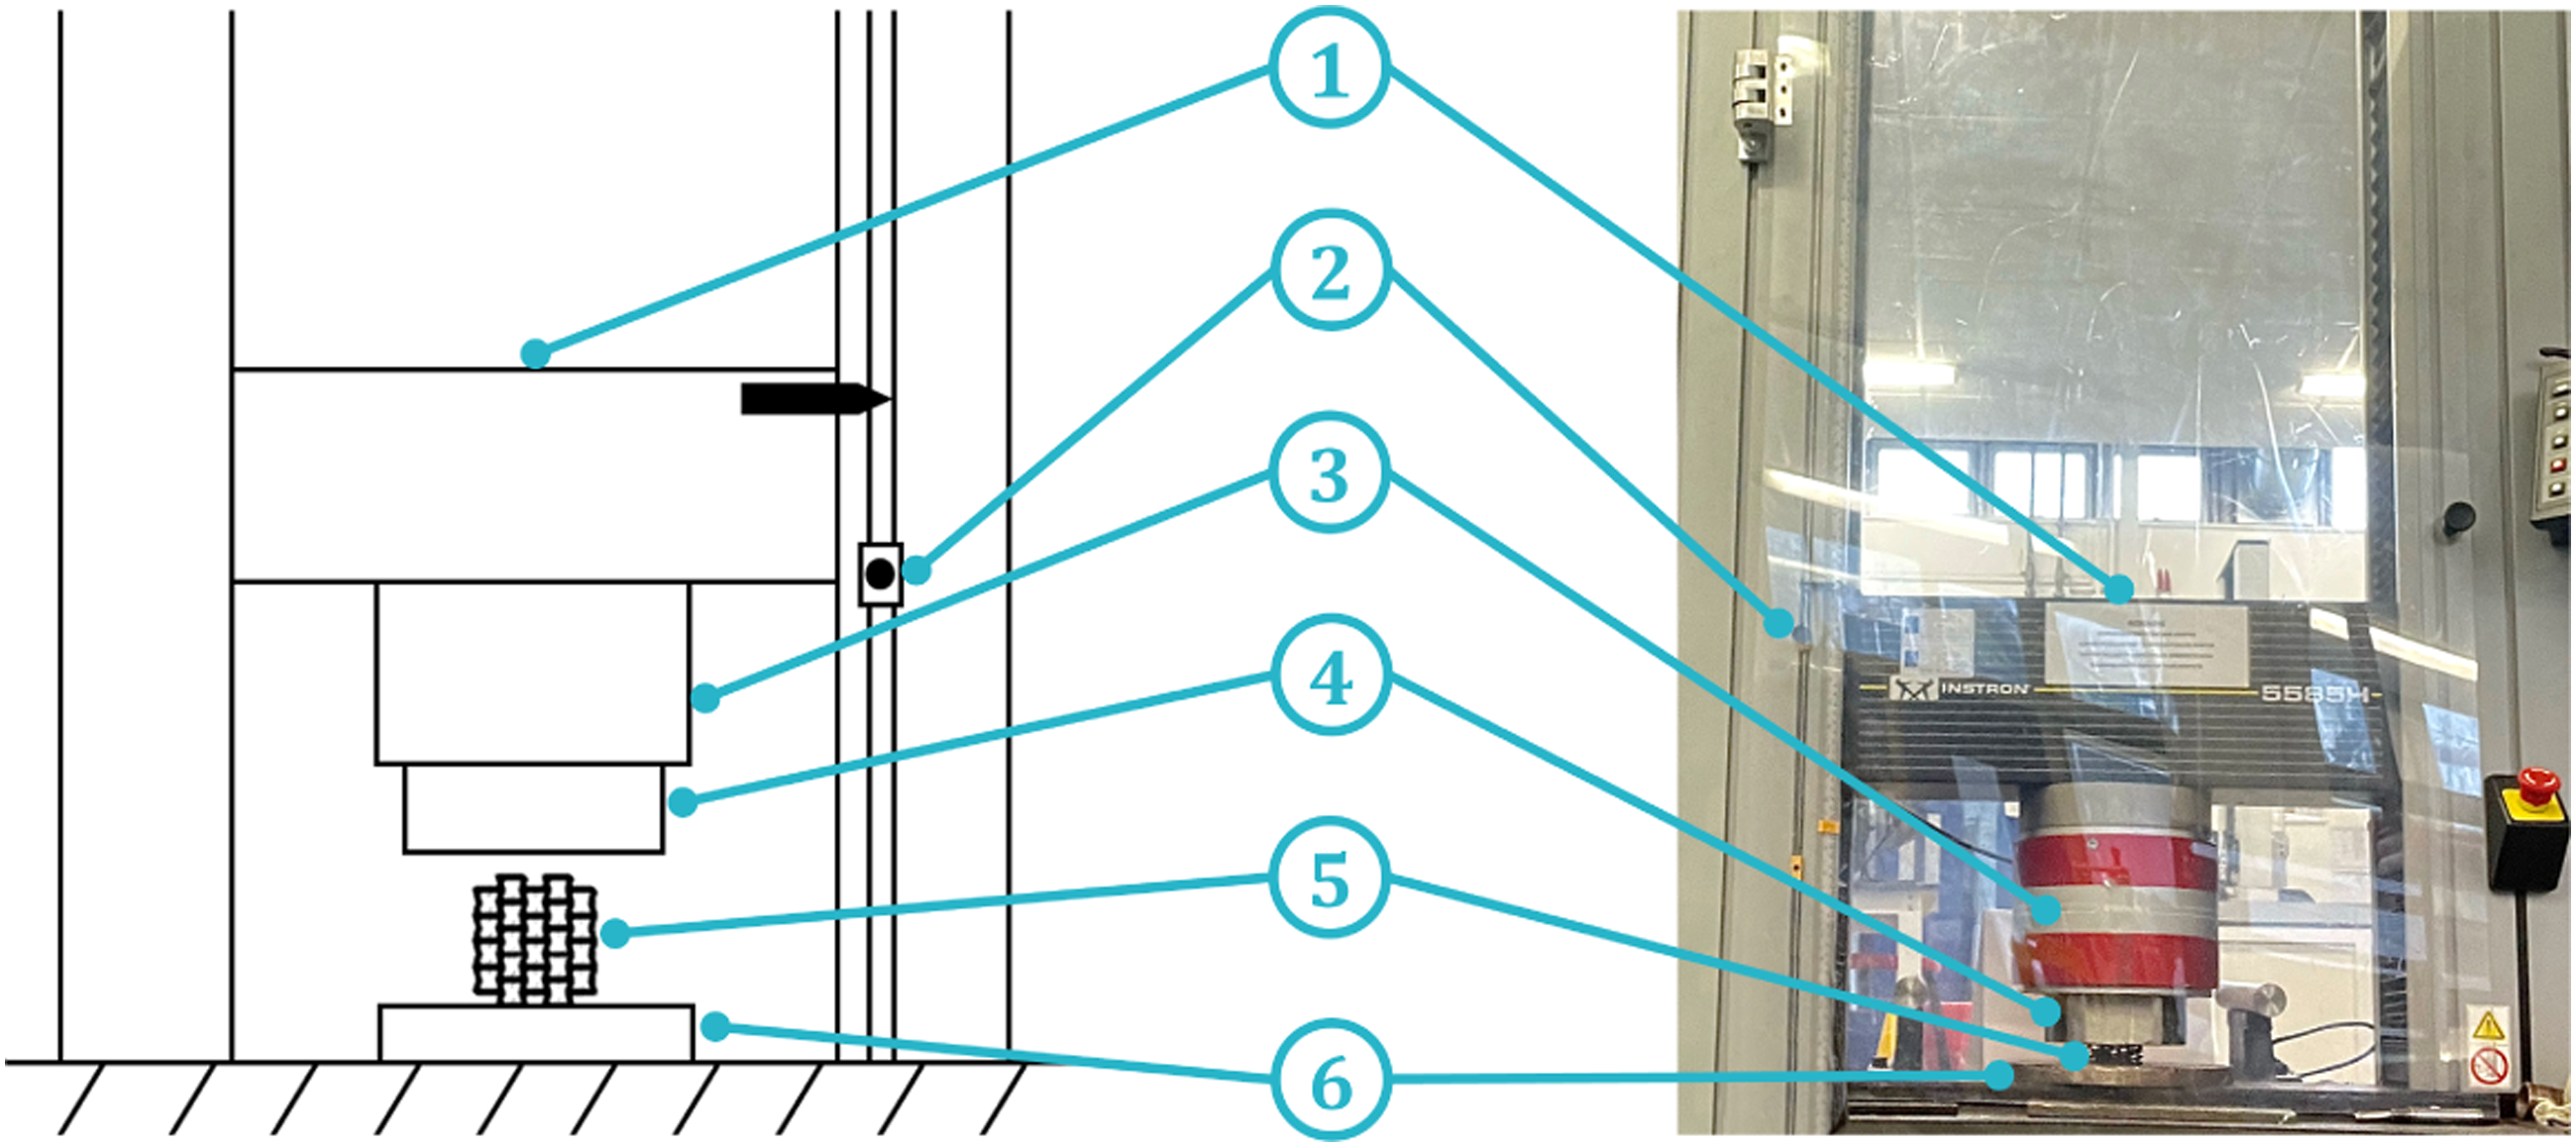
The samples were subsequently subjected to cyclic, quasi-static compression testing, this time at a strain rate of 3 × 10⁻²/s, using the same set-up as before. Loading to maximum nominal strains of 0.125, 0.25 and 0.5 was performed, unloading to zero between each strain level. Force-displacement data was recorded from the Instron machine and converted to nominal stress-nominal strain in the same manner as described previously.
Low-velocity impact
Low-velocity impact tests, based on standard ASTM 7136, were performed using a drop-tower rig, illustrated in Figure 5. Each specimen was placed atop a rigid, flat surface and held in place using single-use fasteners through the last row of cells. This ensured each specimen was securely held in place throughout the impact event. The specimens were free to expand laterally and thus the boundary conditions mimicked that of the quasi-static compression test. The specimens were uniformly impacted with a 76 mm diameter, rigid steel impactor attached to the shuttle. The mass of the shuttle, m
s
was 2.9 kg (including the mass of the impactor). The shuttle was released by an electromagnet and constrained by two low-friction rails. A Kistler low impedance load cell (9712B5000) was mounted to the shuttle. The impact velocity, v and thus the impact energy, I were varied by adjusting the height of the shuttle drop, h
s
according to the equation, Drop-tower apparatus: (1) Electromagnet, (2) Shuttle, (3) Load cell, (4) Flat impactor, (5) Specimen, (6) Specimen platform.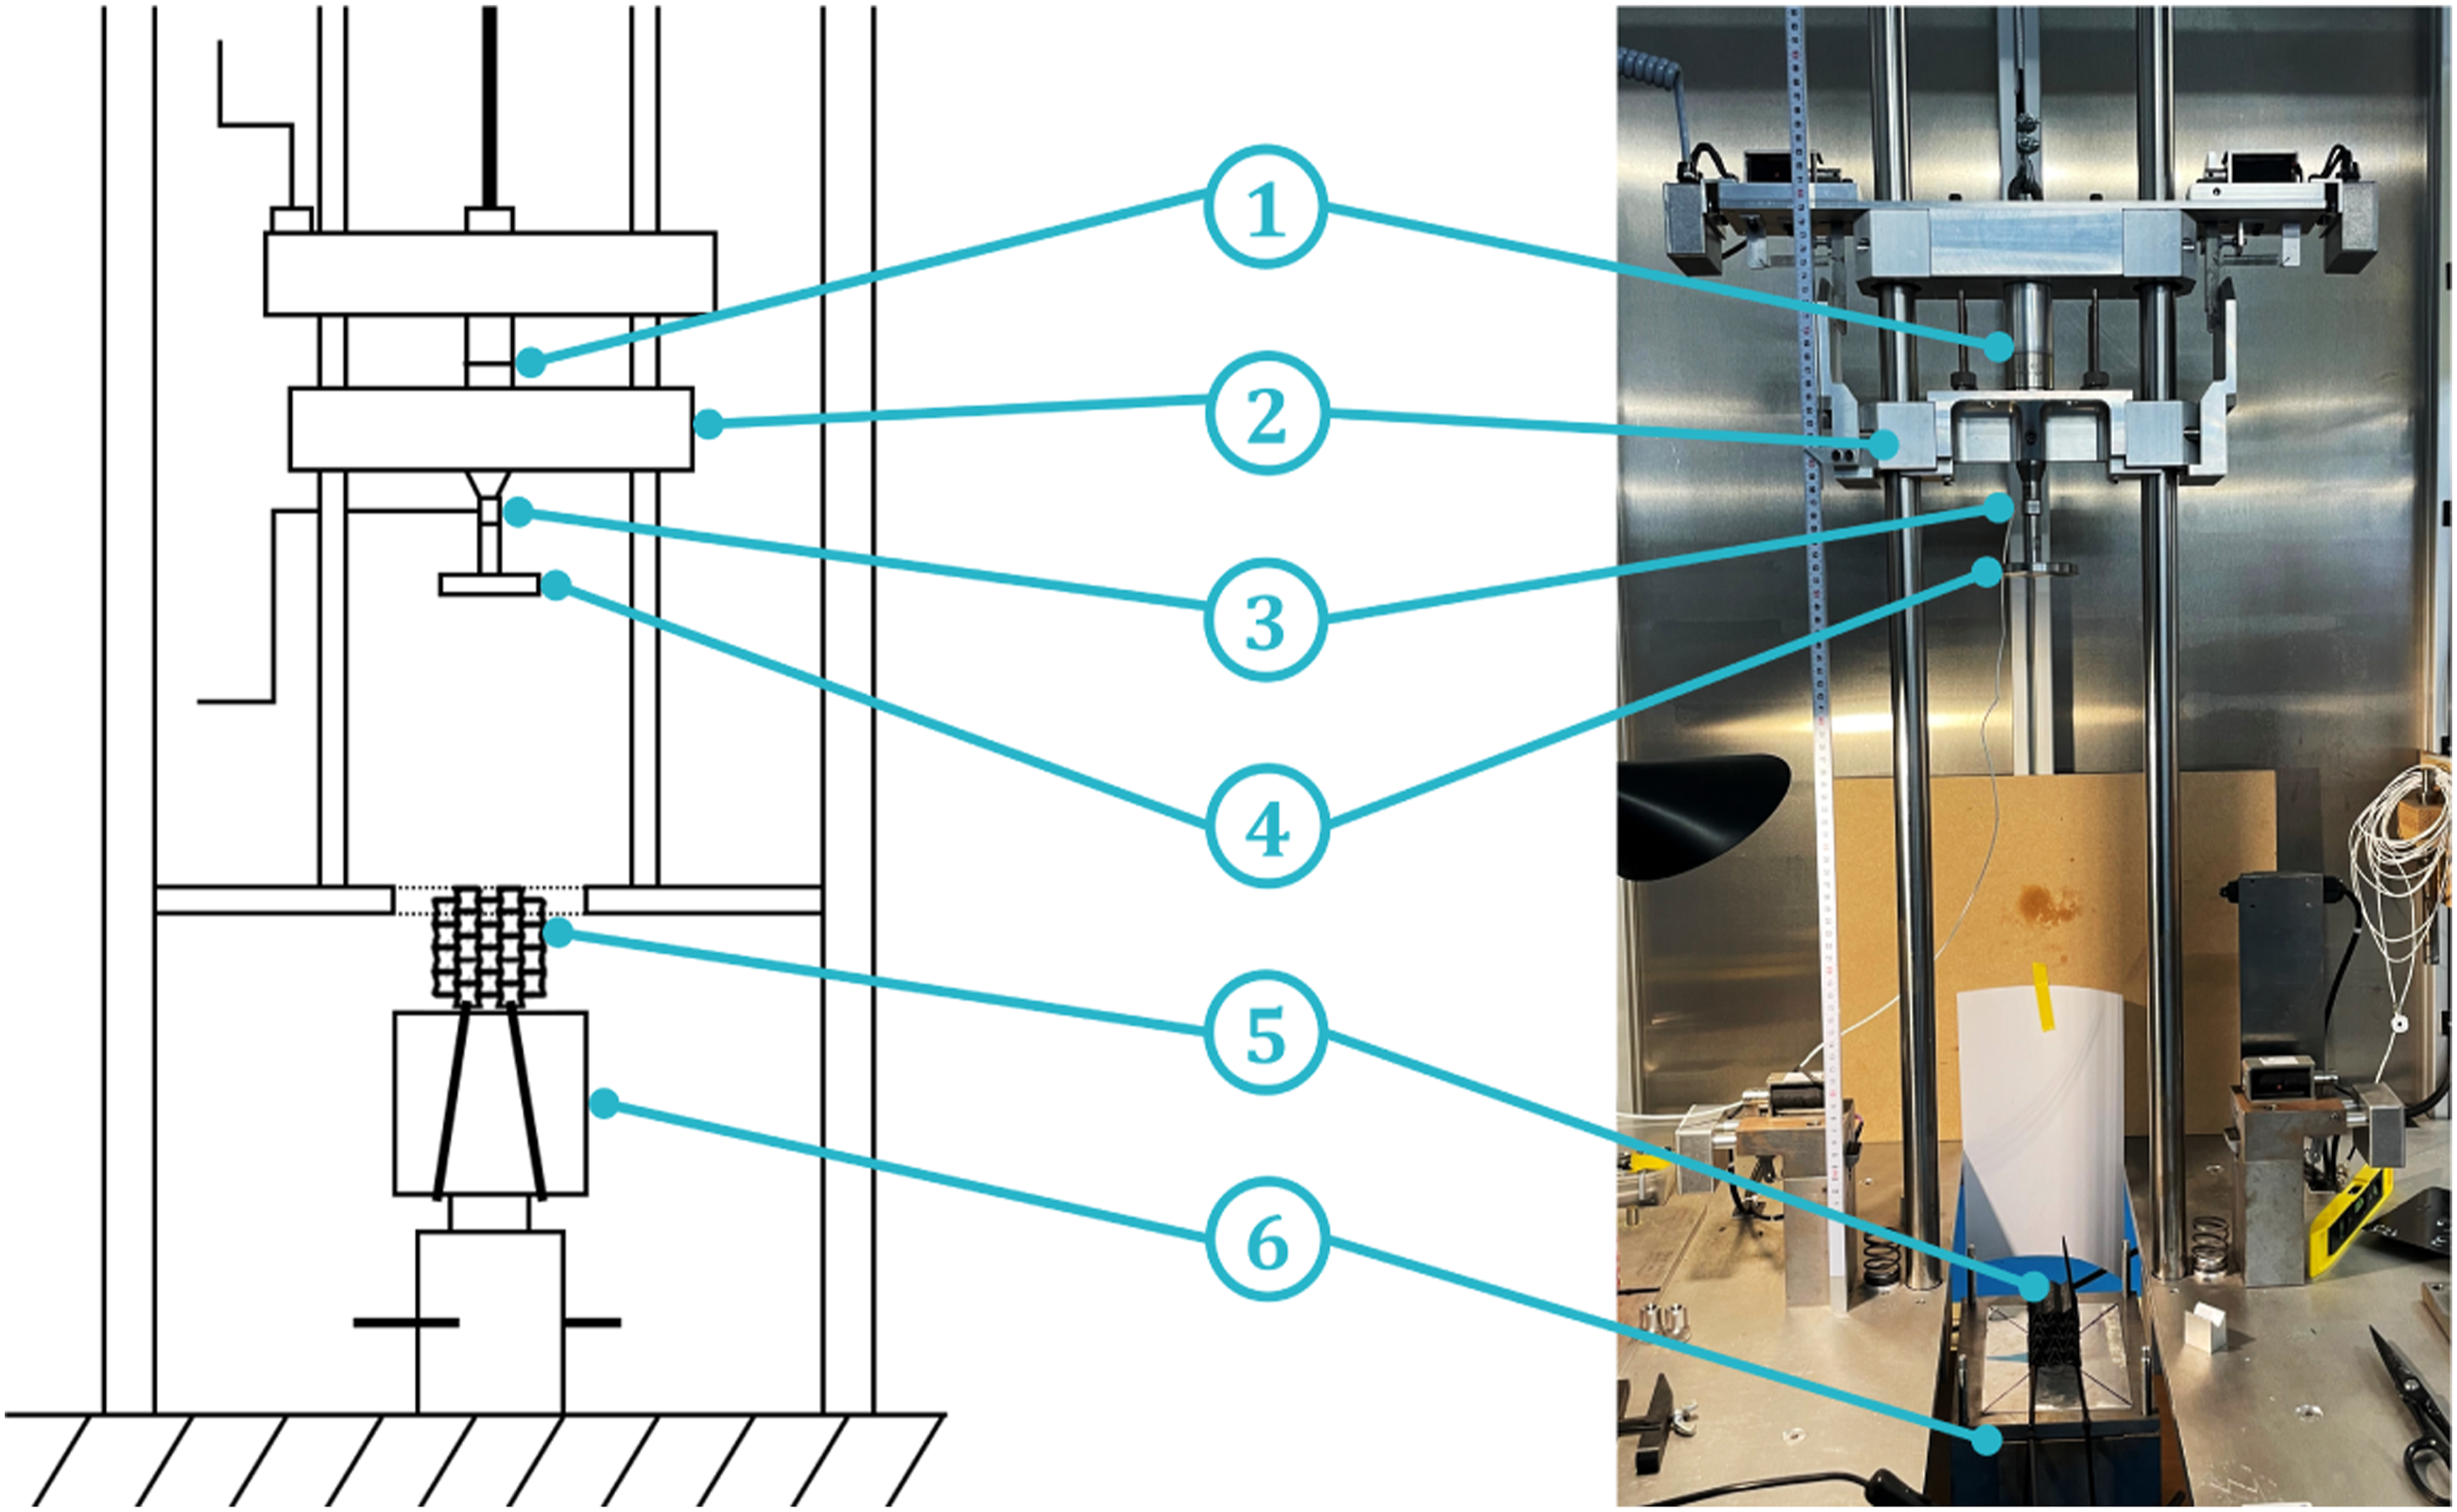
Results and discussion
Quasi-static compression
Figures 6 and 7 present a comparison between the quasi-static compression response of the specimens when loaded in the X and Y directions, respectively. Nominal stress-nominal strain curves are presented alongside photographs illustrating how the deformation progresses. Examination of the curves indicates that the response of all specimens broadly conforms to the expected stress-strain relationship exhibited by cellular structures in which three regions can be identified: (i) the linear elastic region, (ii) the plateau region and (iii) the densification region (Remennikov et al., 2019). Considering the X-direction response in Figure 6, the 3DRH specimen exhibits a pronounced linear elastic regime and together with the RH specimen, the stiffest linear elastic response. Subsequently, the unit cells of the structures start to collapse, with the 3DRH structure maintaining the highest plateau stress compared to all other specimens at a value of 0.034 MPa. The cell collapsing process continues until the cell walls come into contact with each other and densification occurs. Densification is indicated by a rapid increase in the stiffness of the structure, tending to the stiffness of the parent material (Bates et al., 2016). Determined graphically, this investigation will define the onset of densification as the intersection of the tangents to the stress plateau regime and the densification regime (Li et al., 2006). Examining Figure 6, it is clear that the 3DRH specimen densifies the earliest, at a densification strain, ϵ
d
, of 0.46. From Figure 6, it is clear that the non-auxetic HC exhibits less pronounced linear elastic and plateau regions compared to the other specimens. It maintains the lowest stress level until a strain of 0.26 and densifies last of all at a strain, ϵ
d
= 0.74. Nominal stress-nominal strain plots for all specimens subjected to quasi-static compression in the X-direction. Photographs illustrate deformation progression. Nominal stress-nominal strain plots for all specimens subjected to quasi-static compression in the Y-direction. Photographs illustrate deformation progression.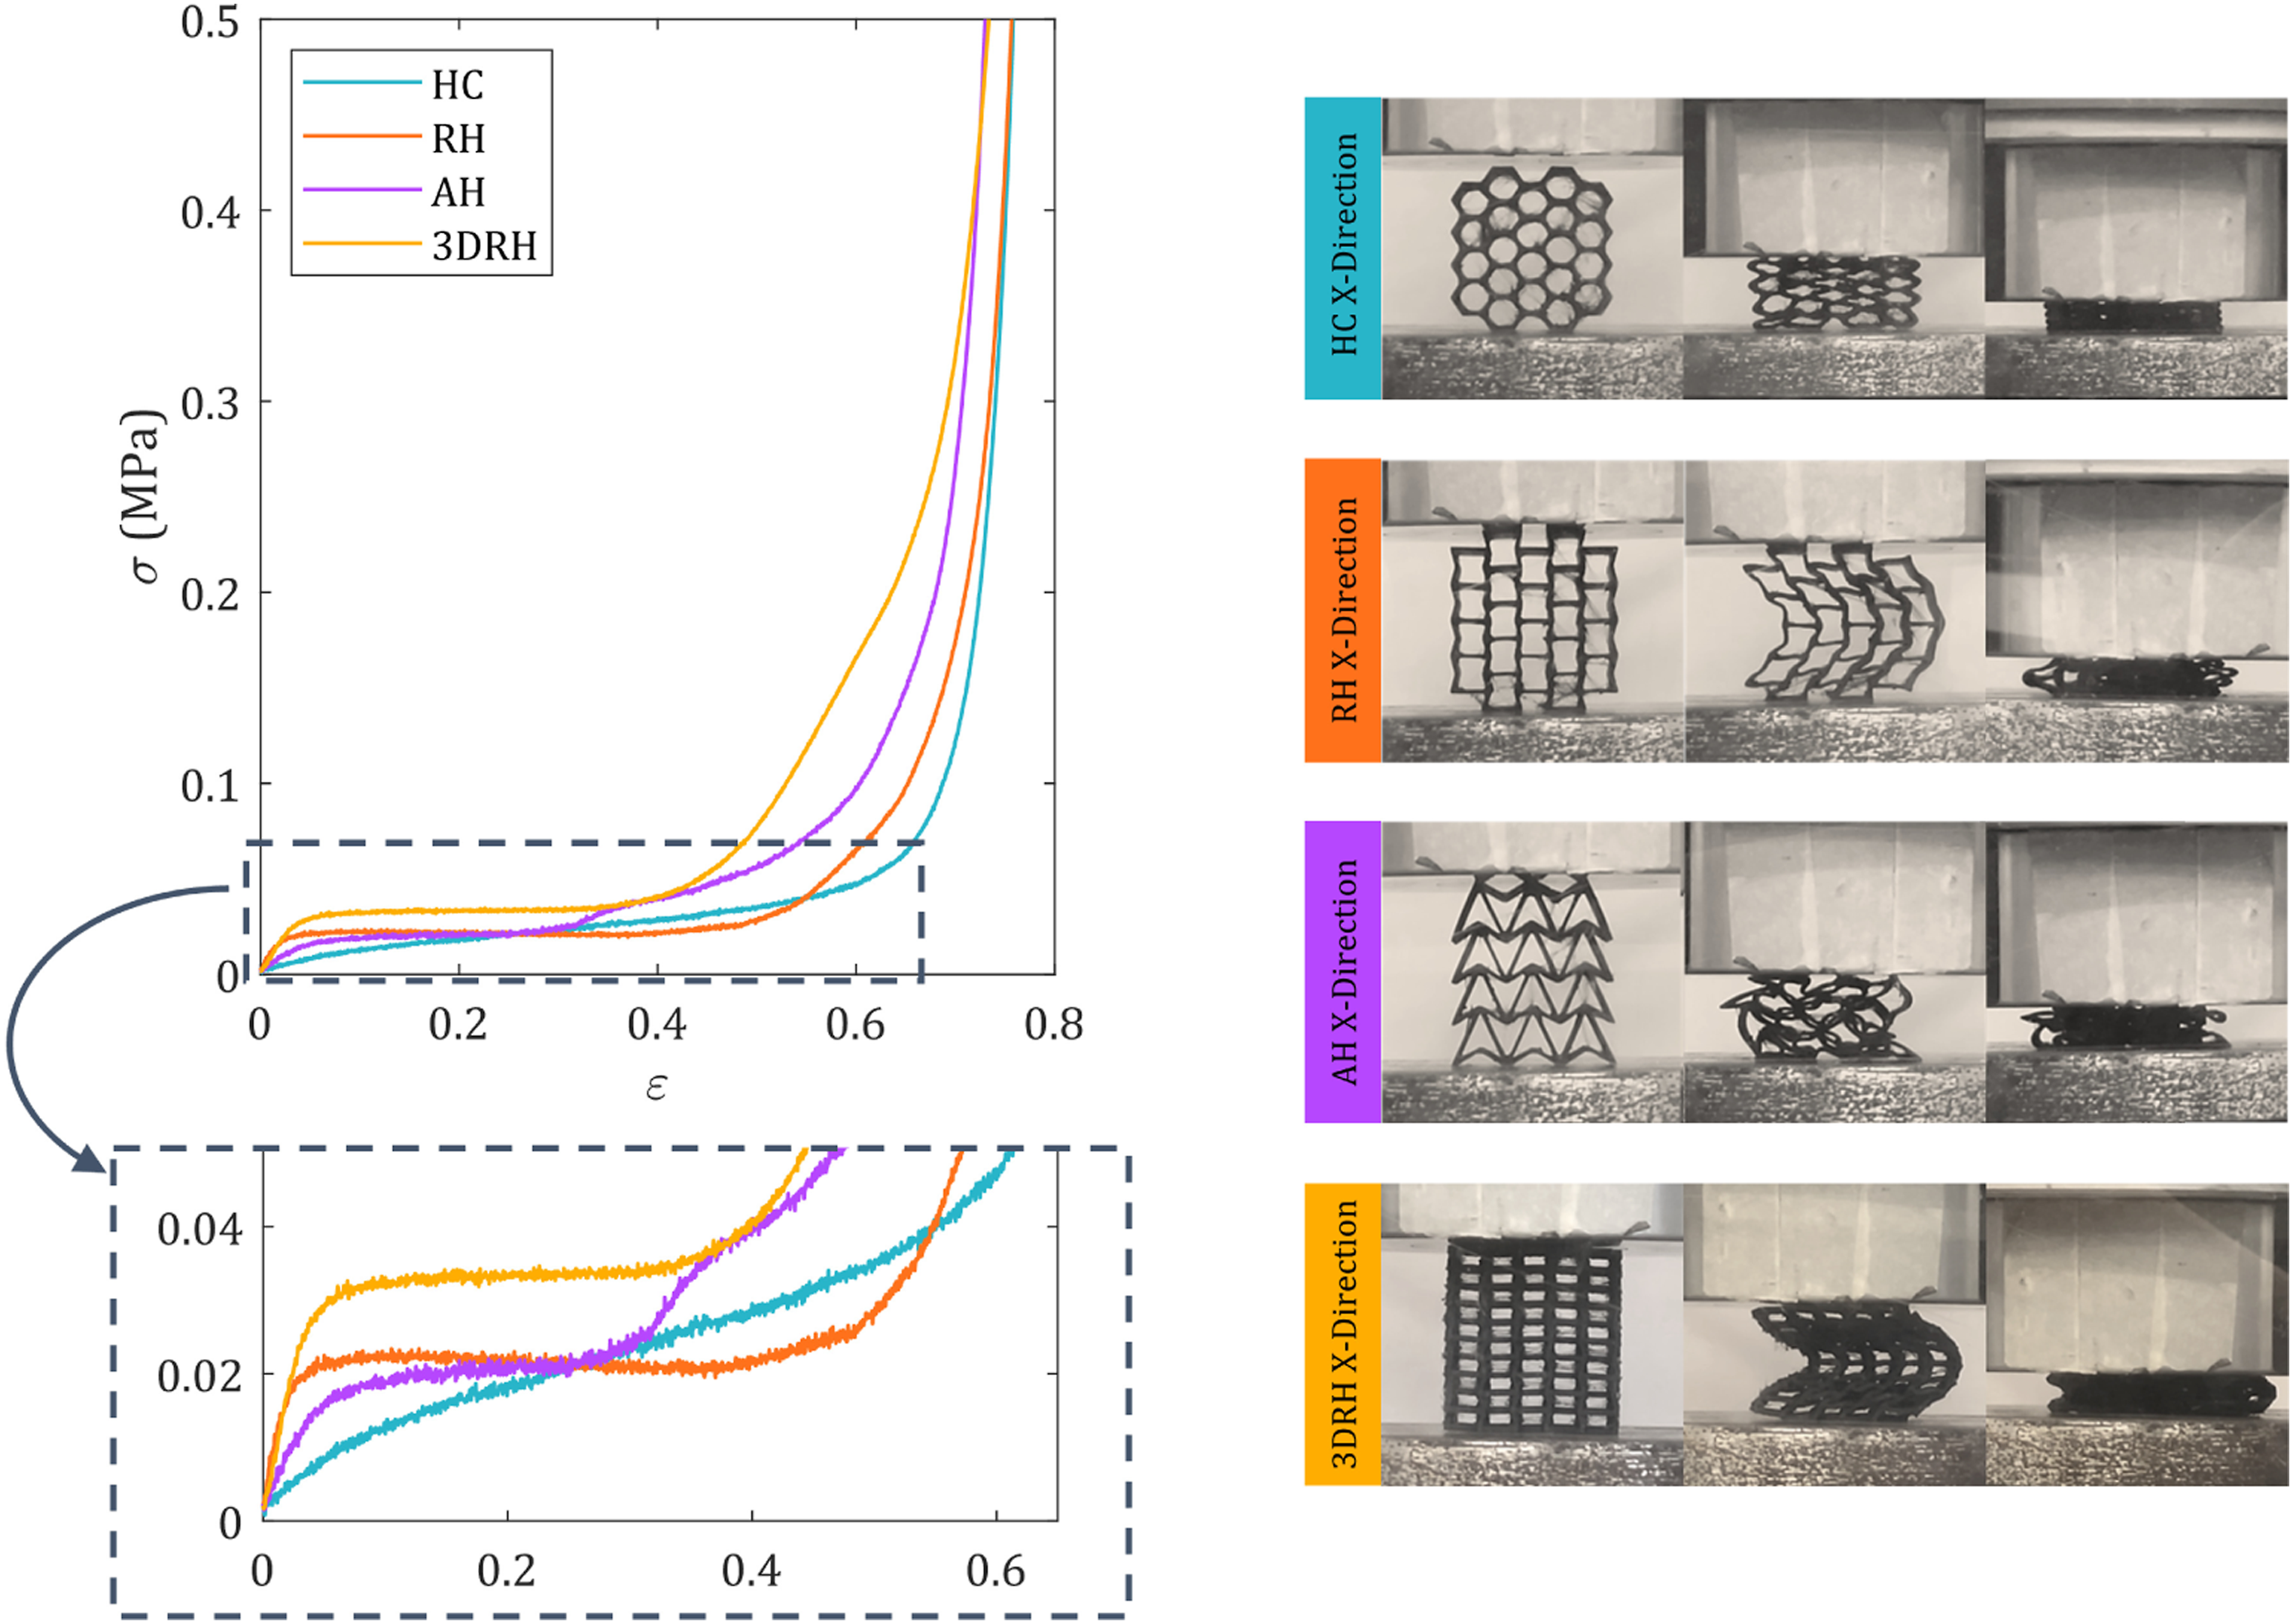
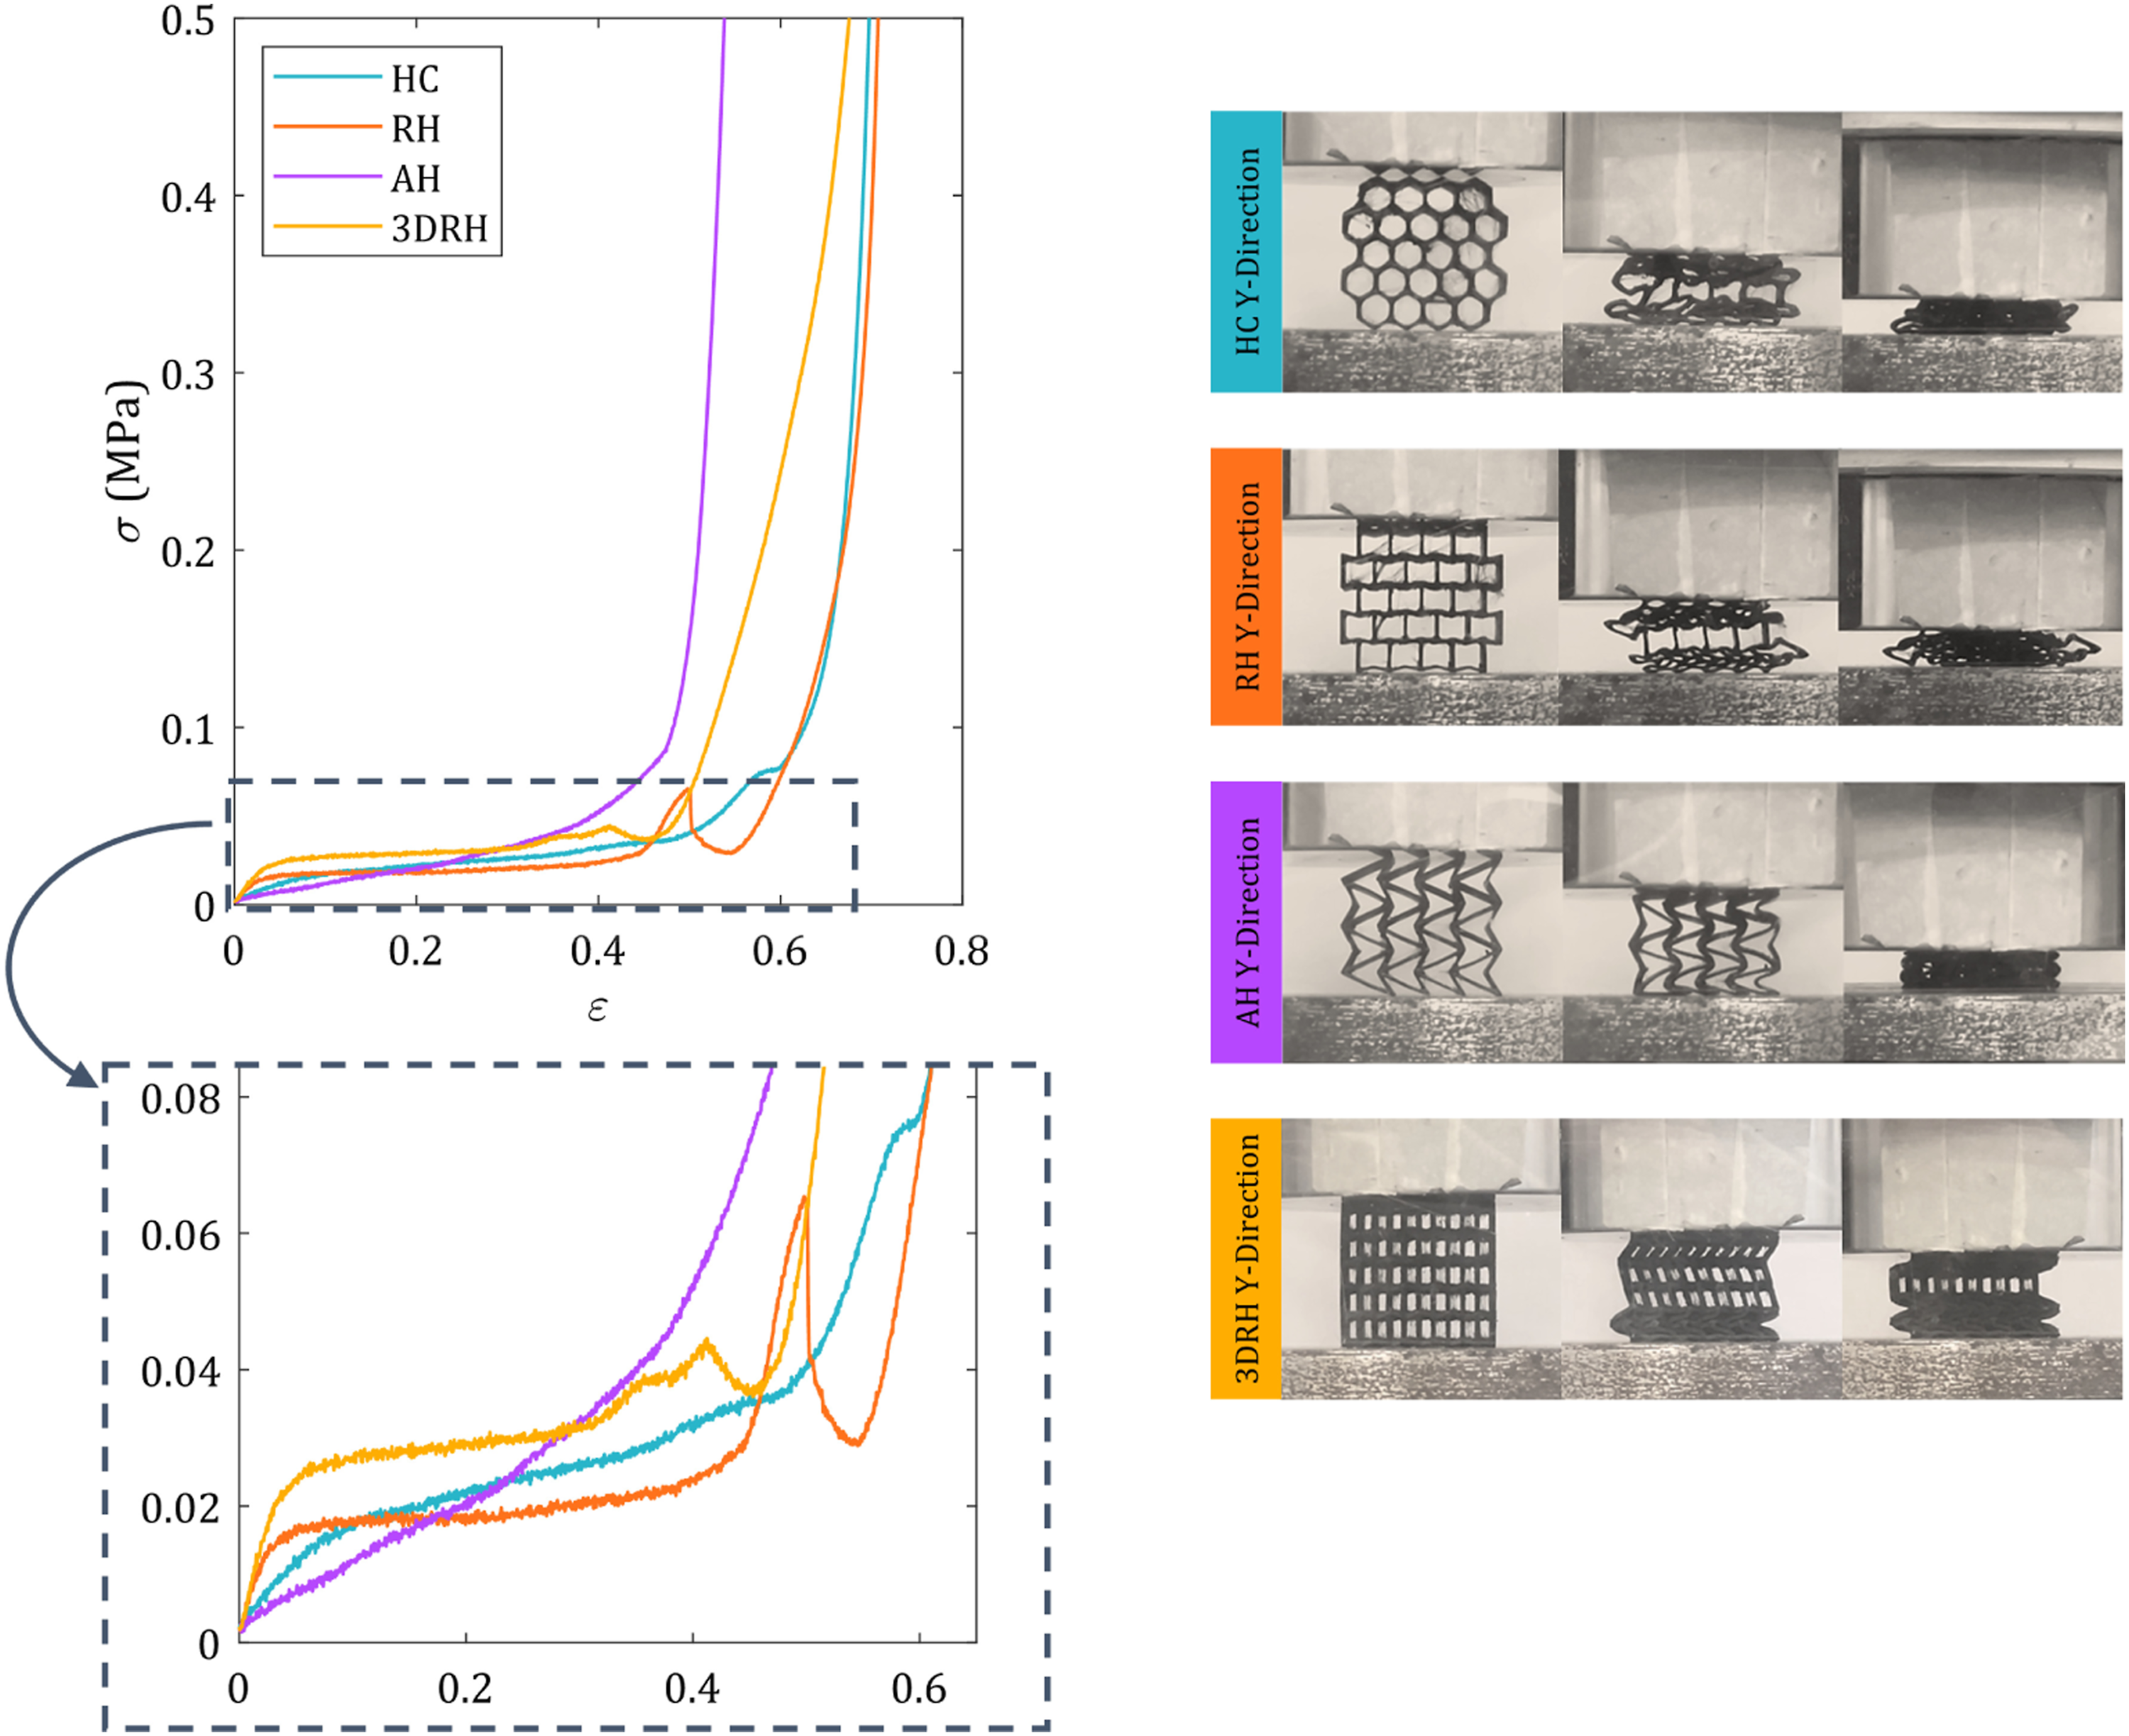
As expected, the Y-direction response, presented in Figure 7, exhibits similar trends to that observed in the X-direction response. The 3DRH specimen exhibits the stiffest response in the linear elastic regime and maintains the highest plateau stress, between 0.028 and 0.032 MPa. Once more, the HC specimen displays less pronounced linear elastic and plateau regions. In contrast to the X-direction response, the AH specimen also exhibits less pronounced linear elastic and plateau regions and densifies before the other specimens. The HC and RH specimens are the last to densify at similar strain levels of ϵ d = 0.60 and 0.58 respectively.
Figure 8 presents the quasi-static compression response of the 3D-auxetic re-entrant honeycomb specimen when loaded in the Z-direction. The highest recorded stress in the linear elastic regime is 0.04 MPa, higher than that observed for loading in any other direction. Densification occurs at a slightly higher strain level compared to the other loading directions, at a value of approximately ϵ
d
= 0.64. Nominal stress-nominal strain plot for the 3D-auxetic re-entrant honeycomb specimen subjected to quasi-static compression in the Z-direction. Photographs illustrate deformation progression.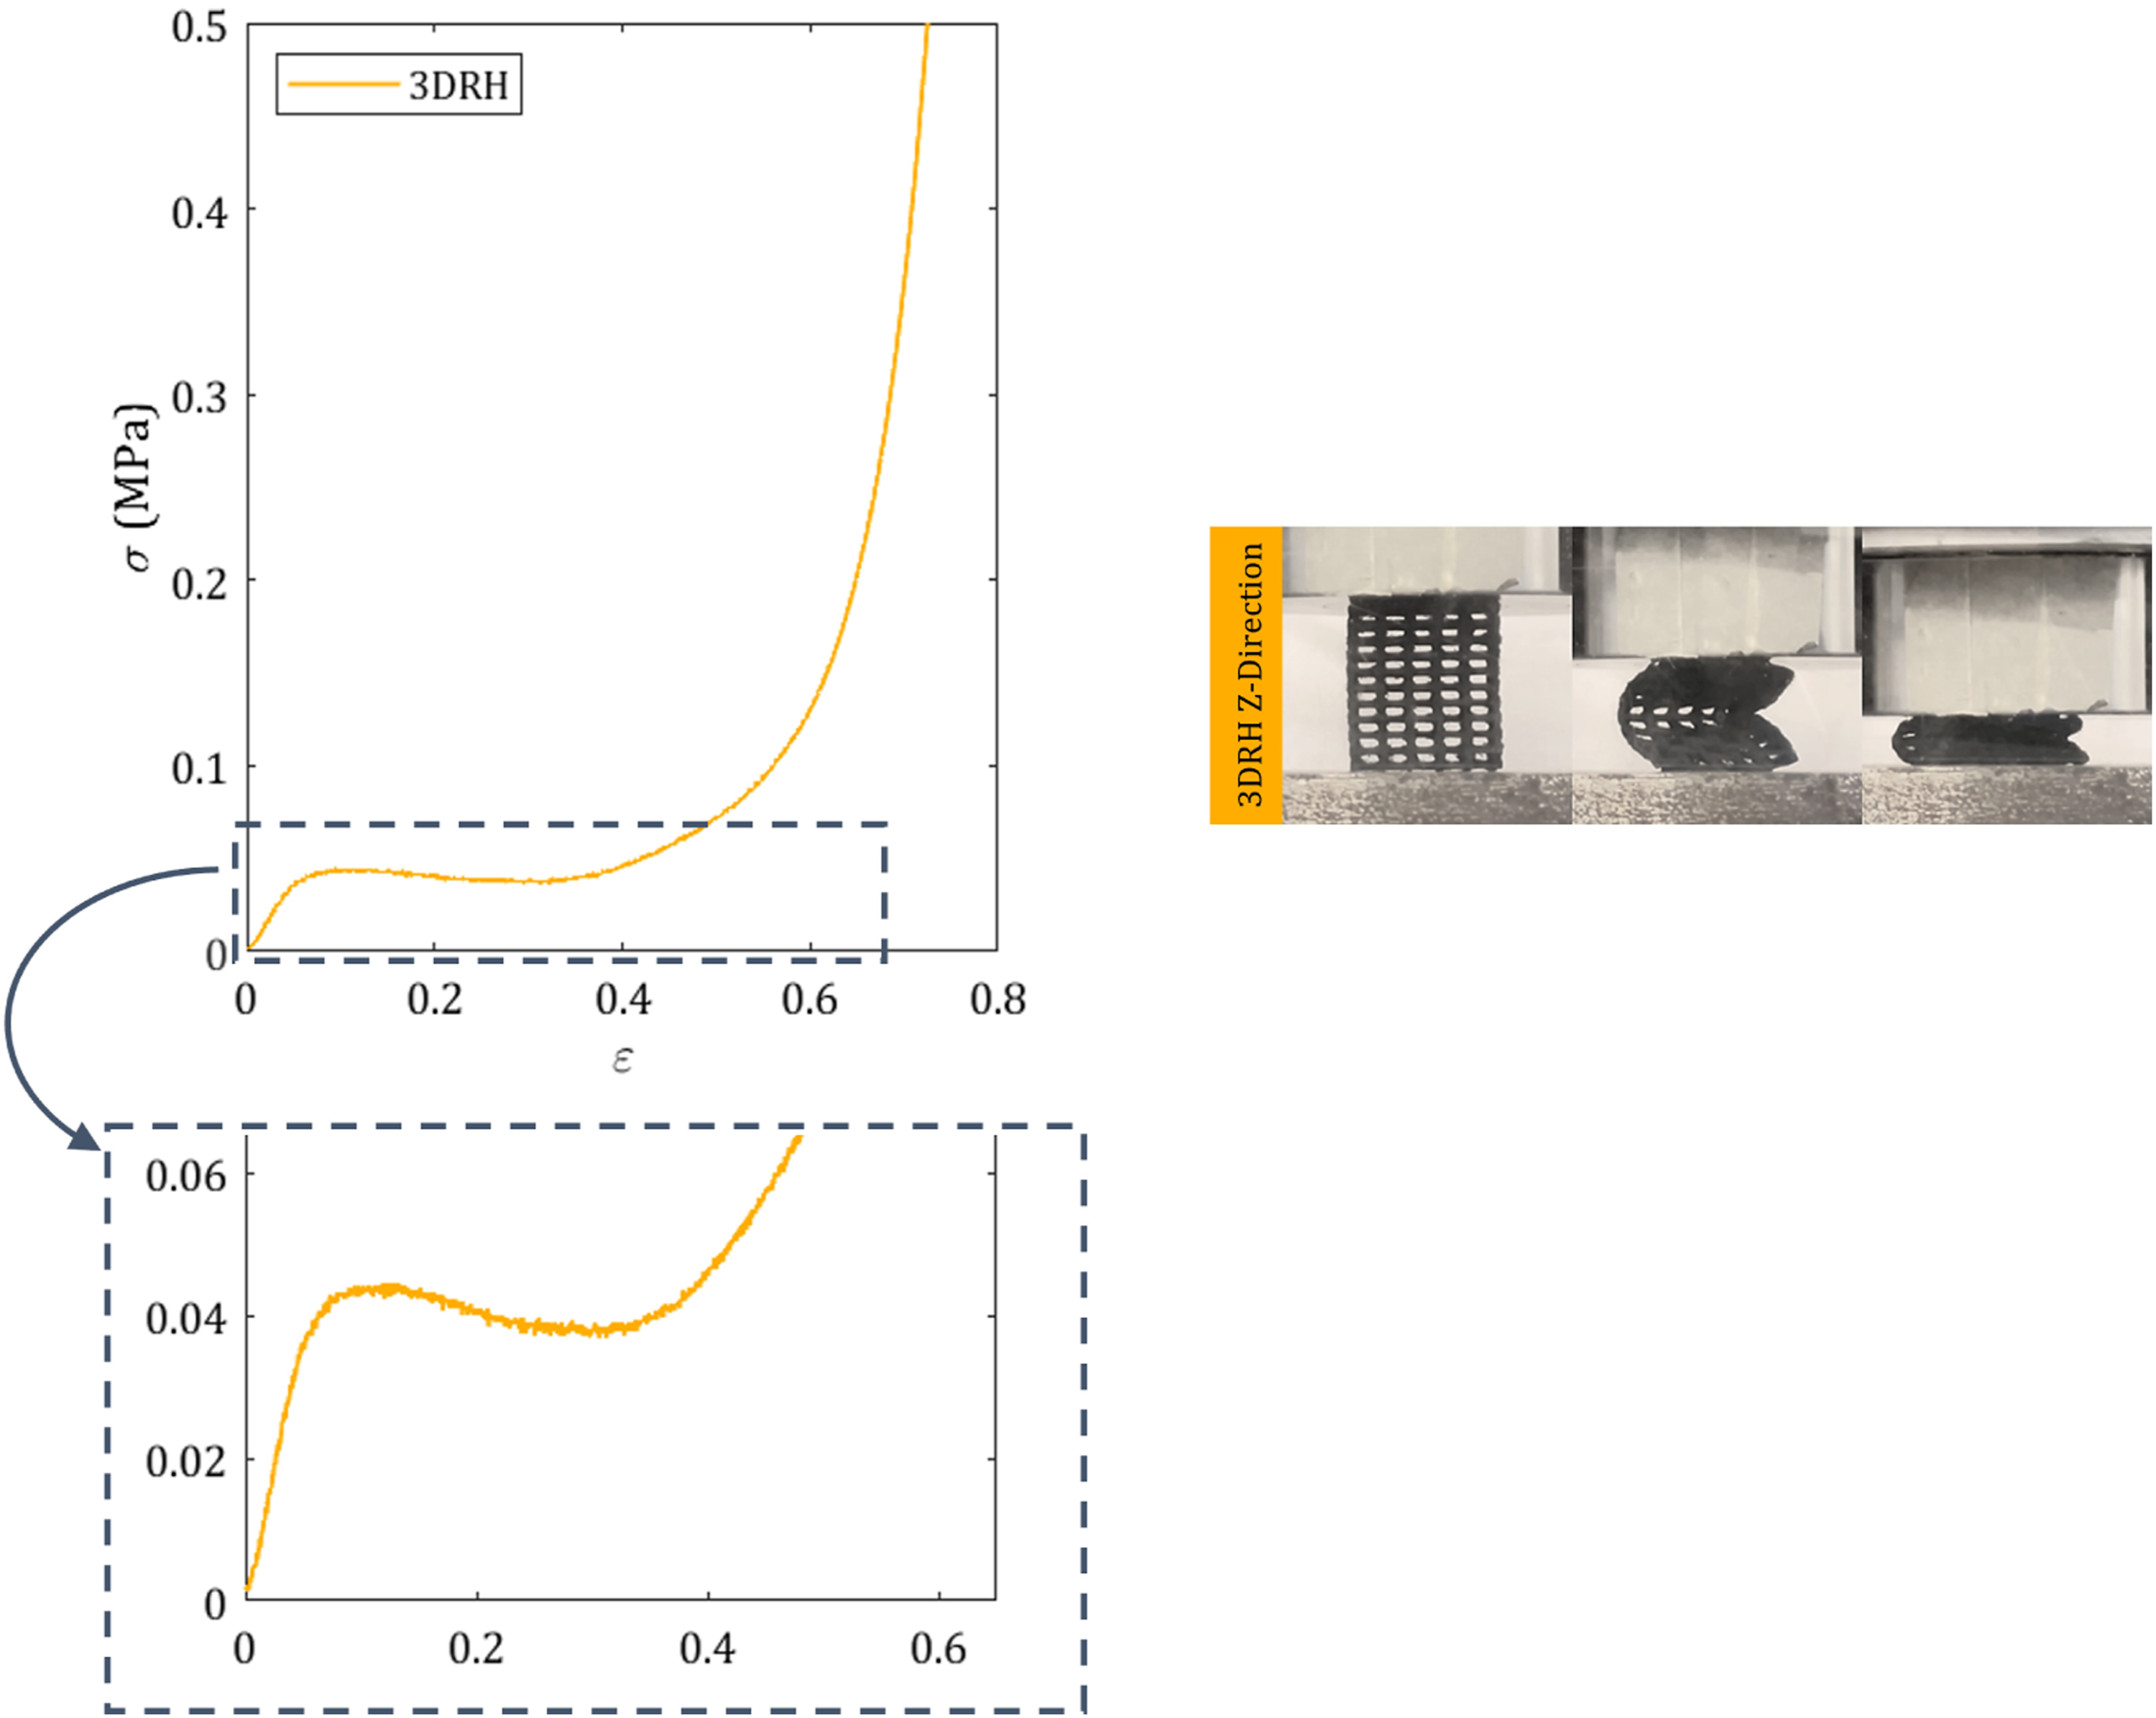
The energy absorbed by a cellular structure during a compression test can be evaluated by calculating the area under the stress-strain curve. In the design of an efficient energy absorbing structure, a long flat plateau region is highly desirable since compressive energy can be absorbed under near constant load. However, the energy absorbed is not the only key parameter. It is important to consider the stress level corresponding to this energy absorption where for protective armour applications, a high stress level should be avoided (Alomarah et al., 2019; Bates et al., 2019). To visualise the interplay between energy absorption, stress and density, energy absorption diagrams, described by Gibson and Ashby (Gibson and Ashby, 1999), are plotted in Figures 9–11. Specific energy absorbed, E
s
is calculated by integrating the compression stress-strain curve, (a) and (b) are plots of specific energy against stress for quasi-static compression in the X-direction where (a) displays the full plot and (b) displays a zoomed view. (c) summarises the most efficient energy absorbing structure i.e. that which transfers the lowest stress for a specific energy level. (a) and (b) are plots of specific energy against stress for quasi-static compression in the Y-direction where (a) displays the full plot and (b) displays a zoomed view. (c) summarises the most efficient energy absorbing structure i.e. that which transfers the lowest stress for a specific energy level. (a) and (b) are plots of specific energy against stress for quasi-static compression in the Z-direction where (a) displays the full plot and (b) displays a zoomed view.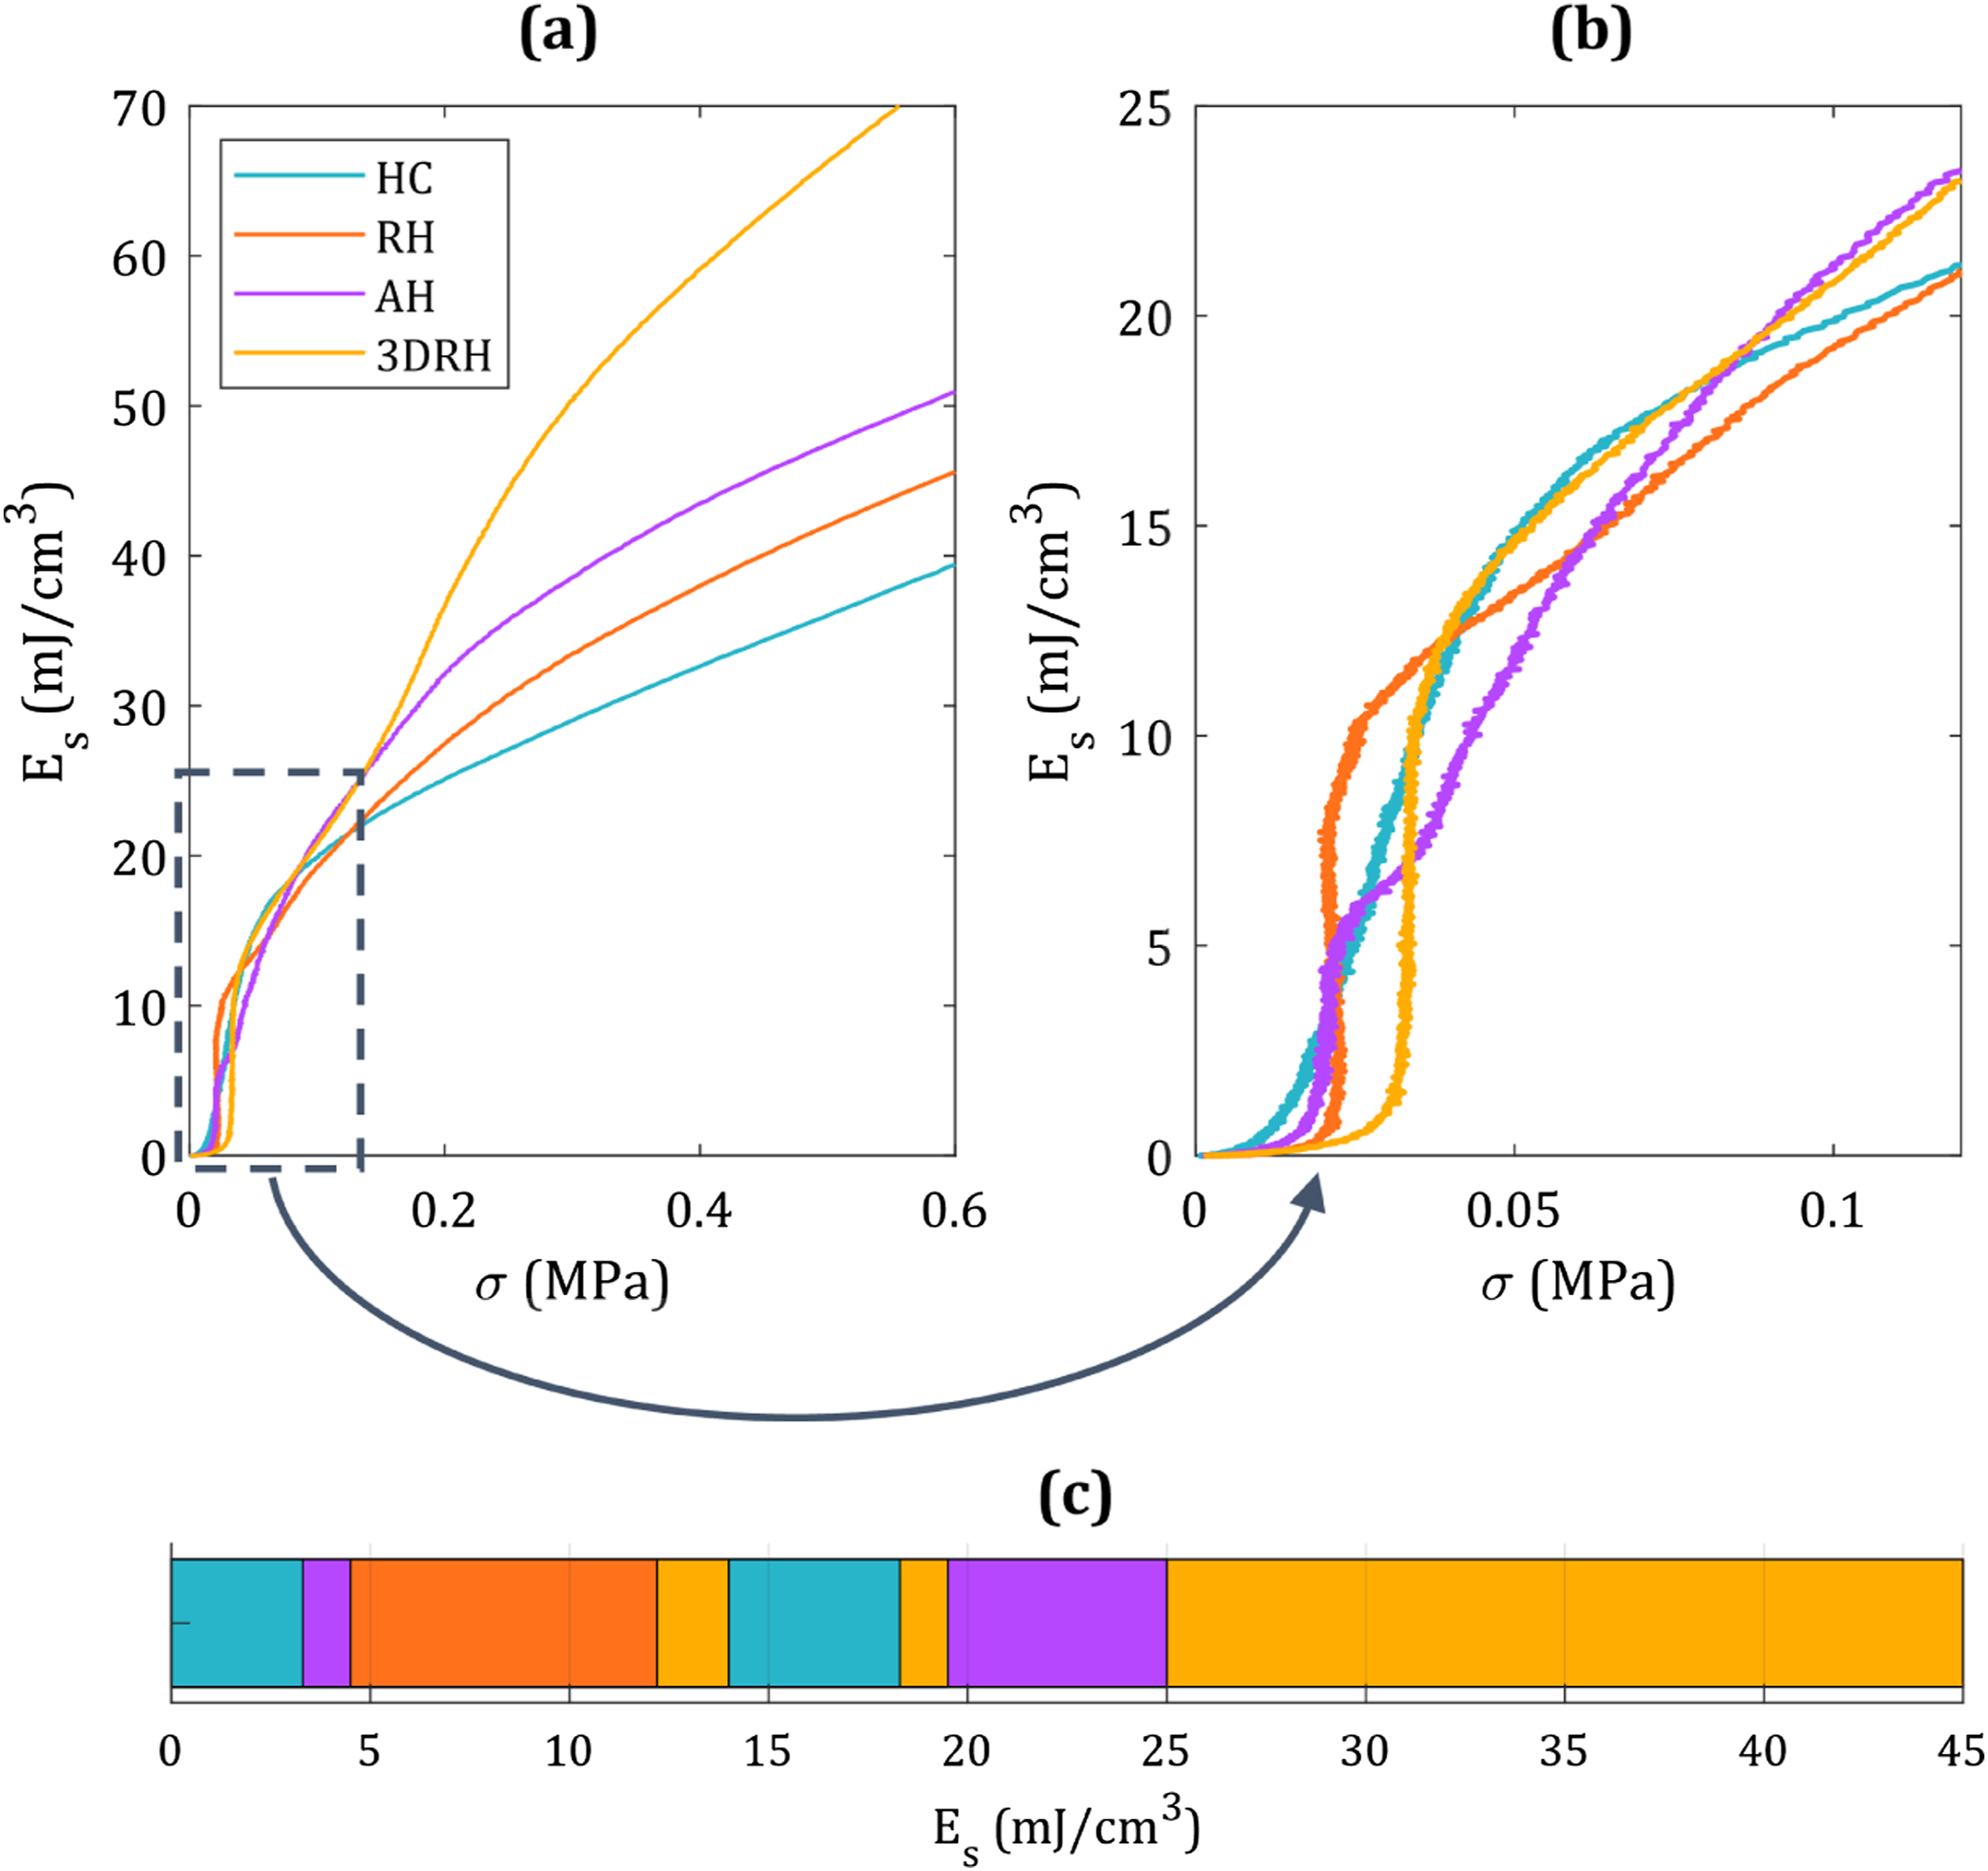
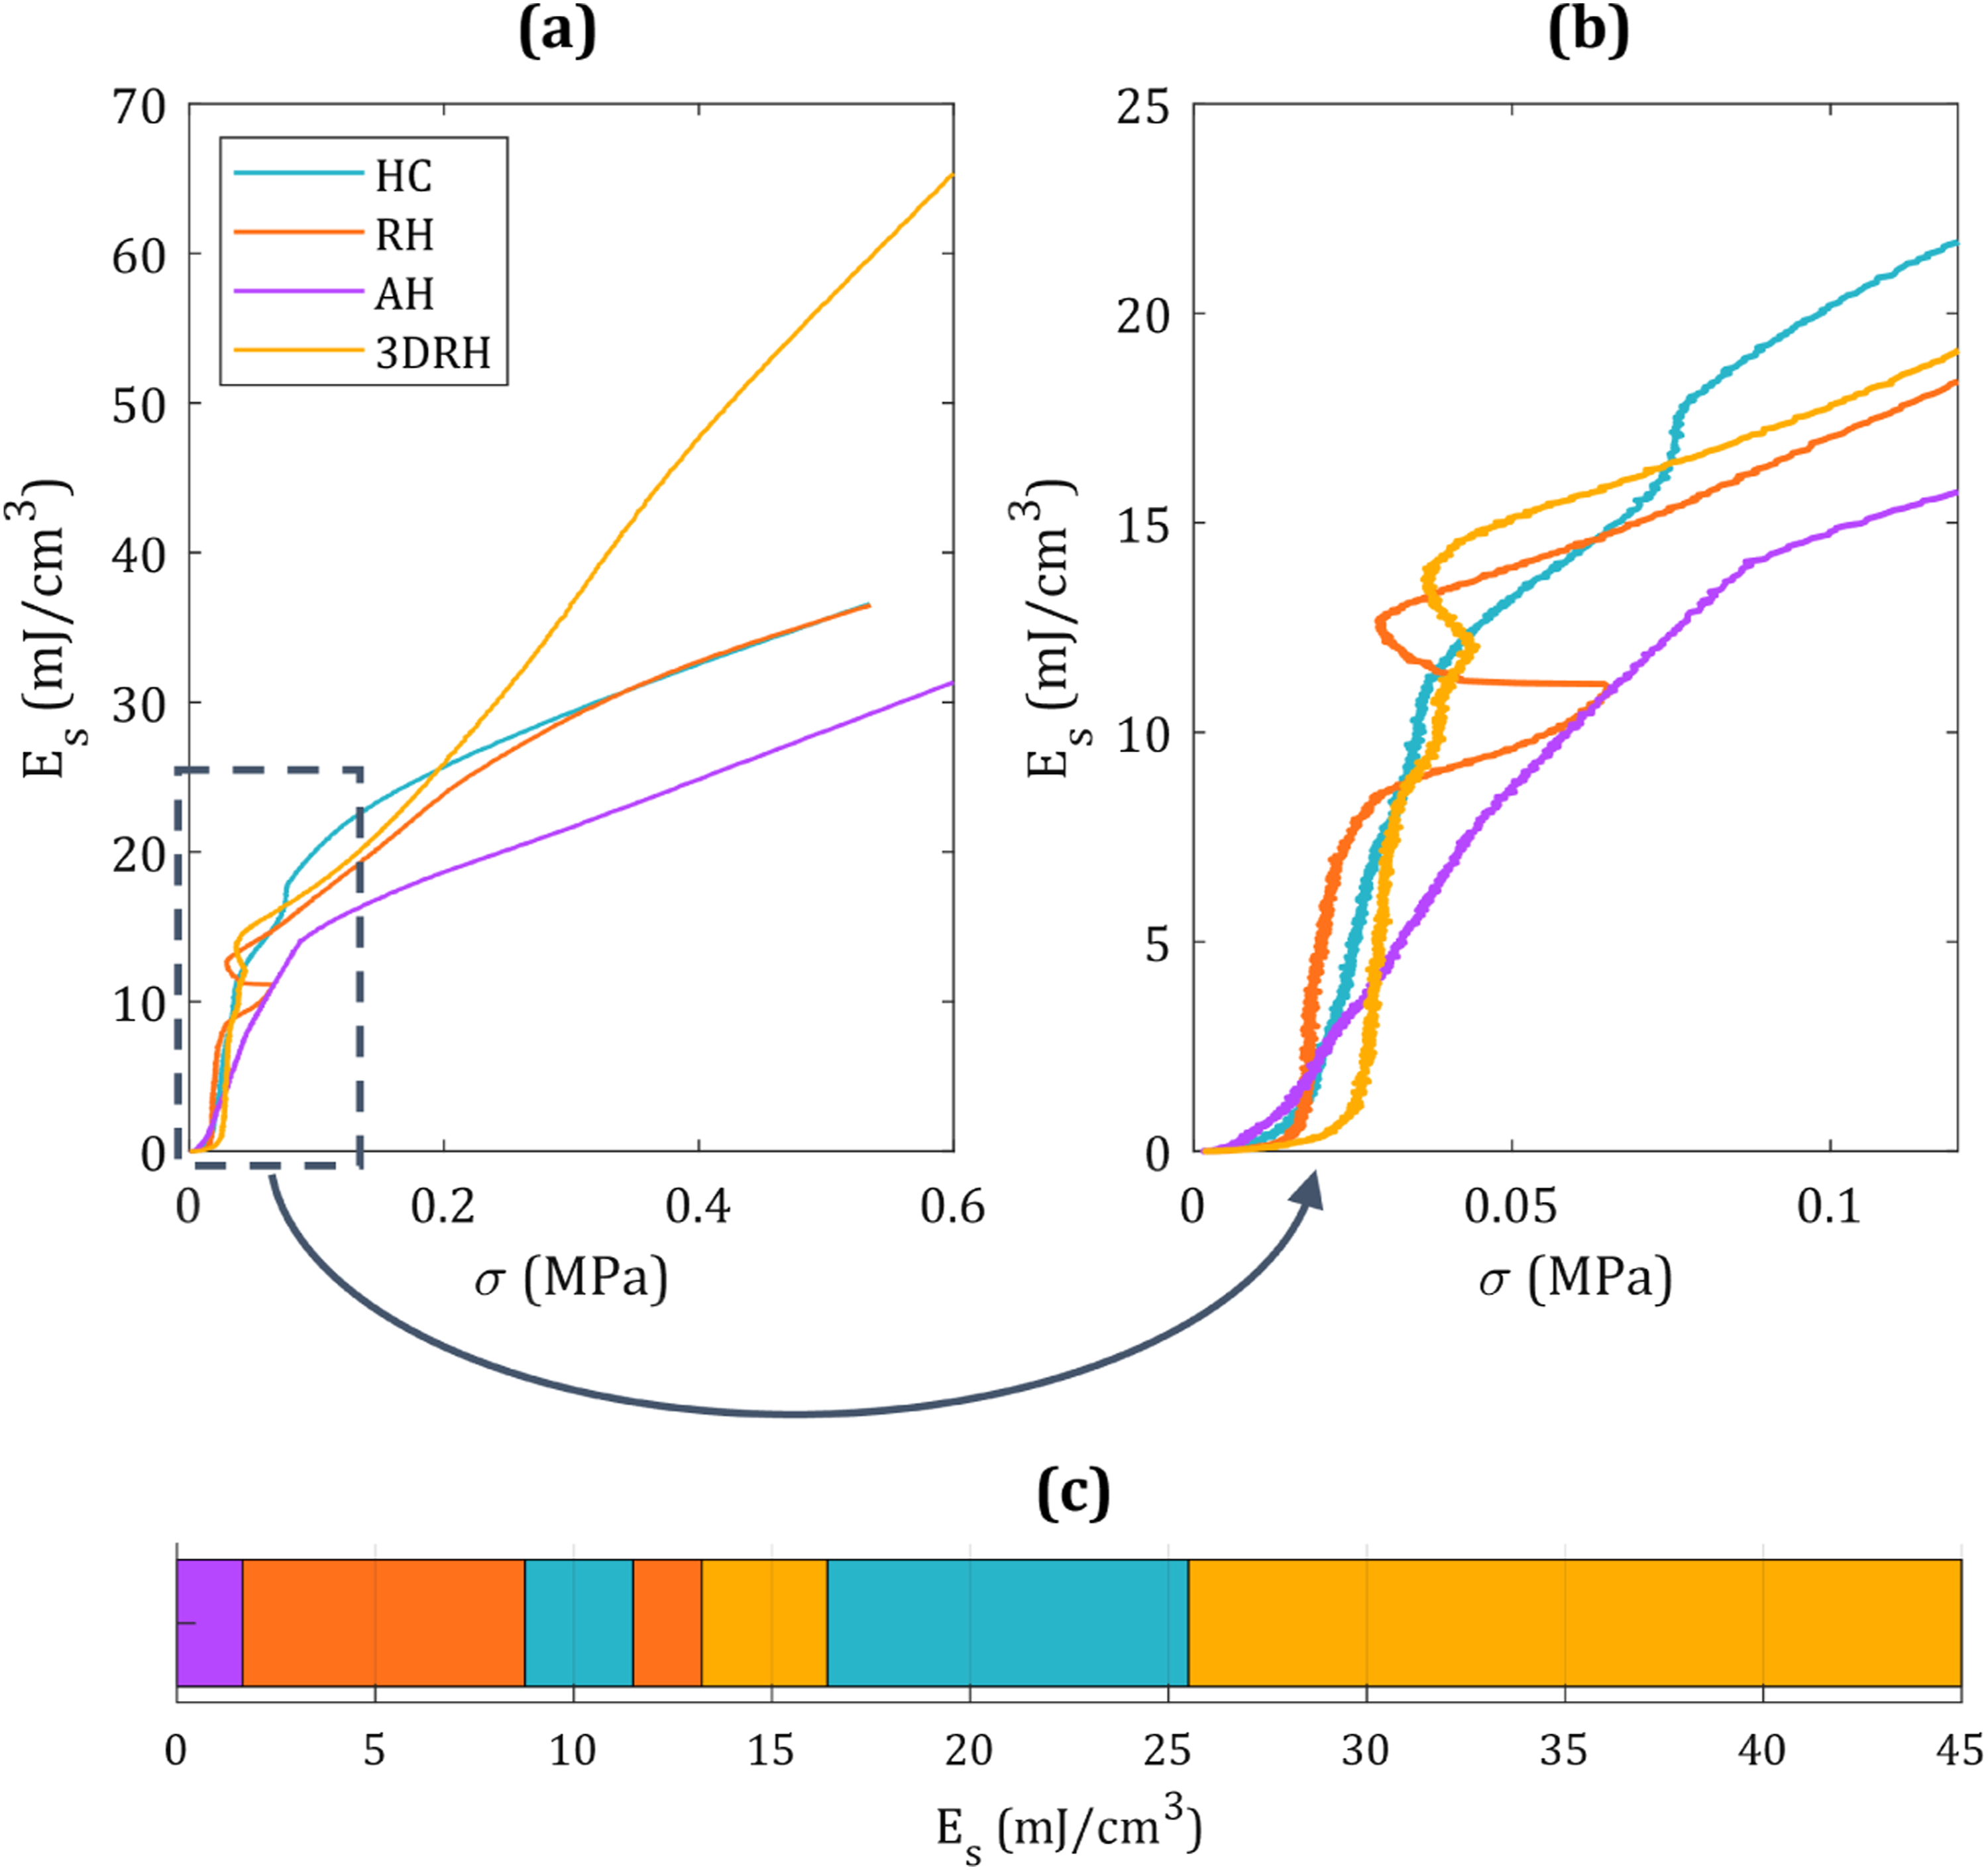
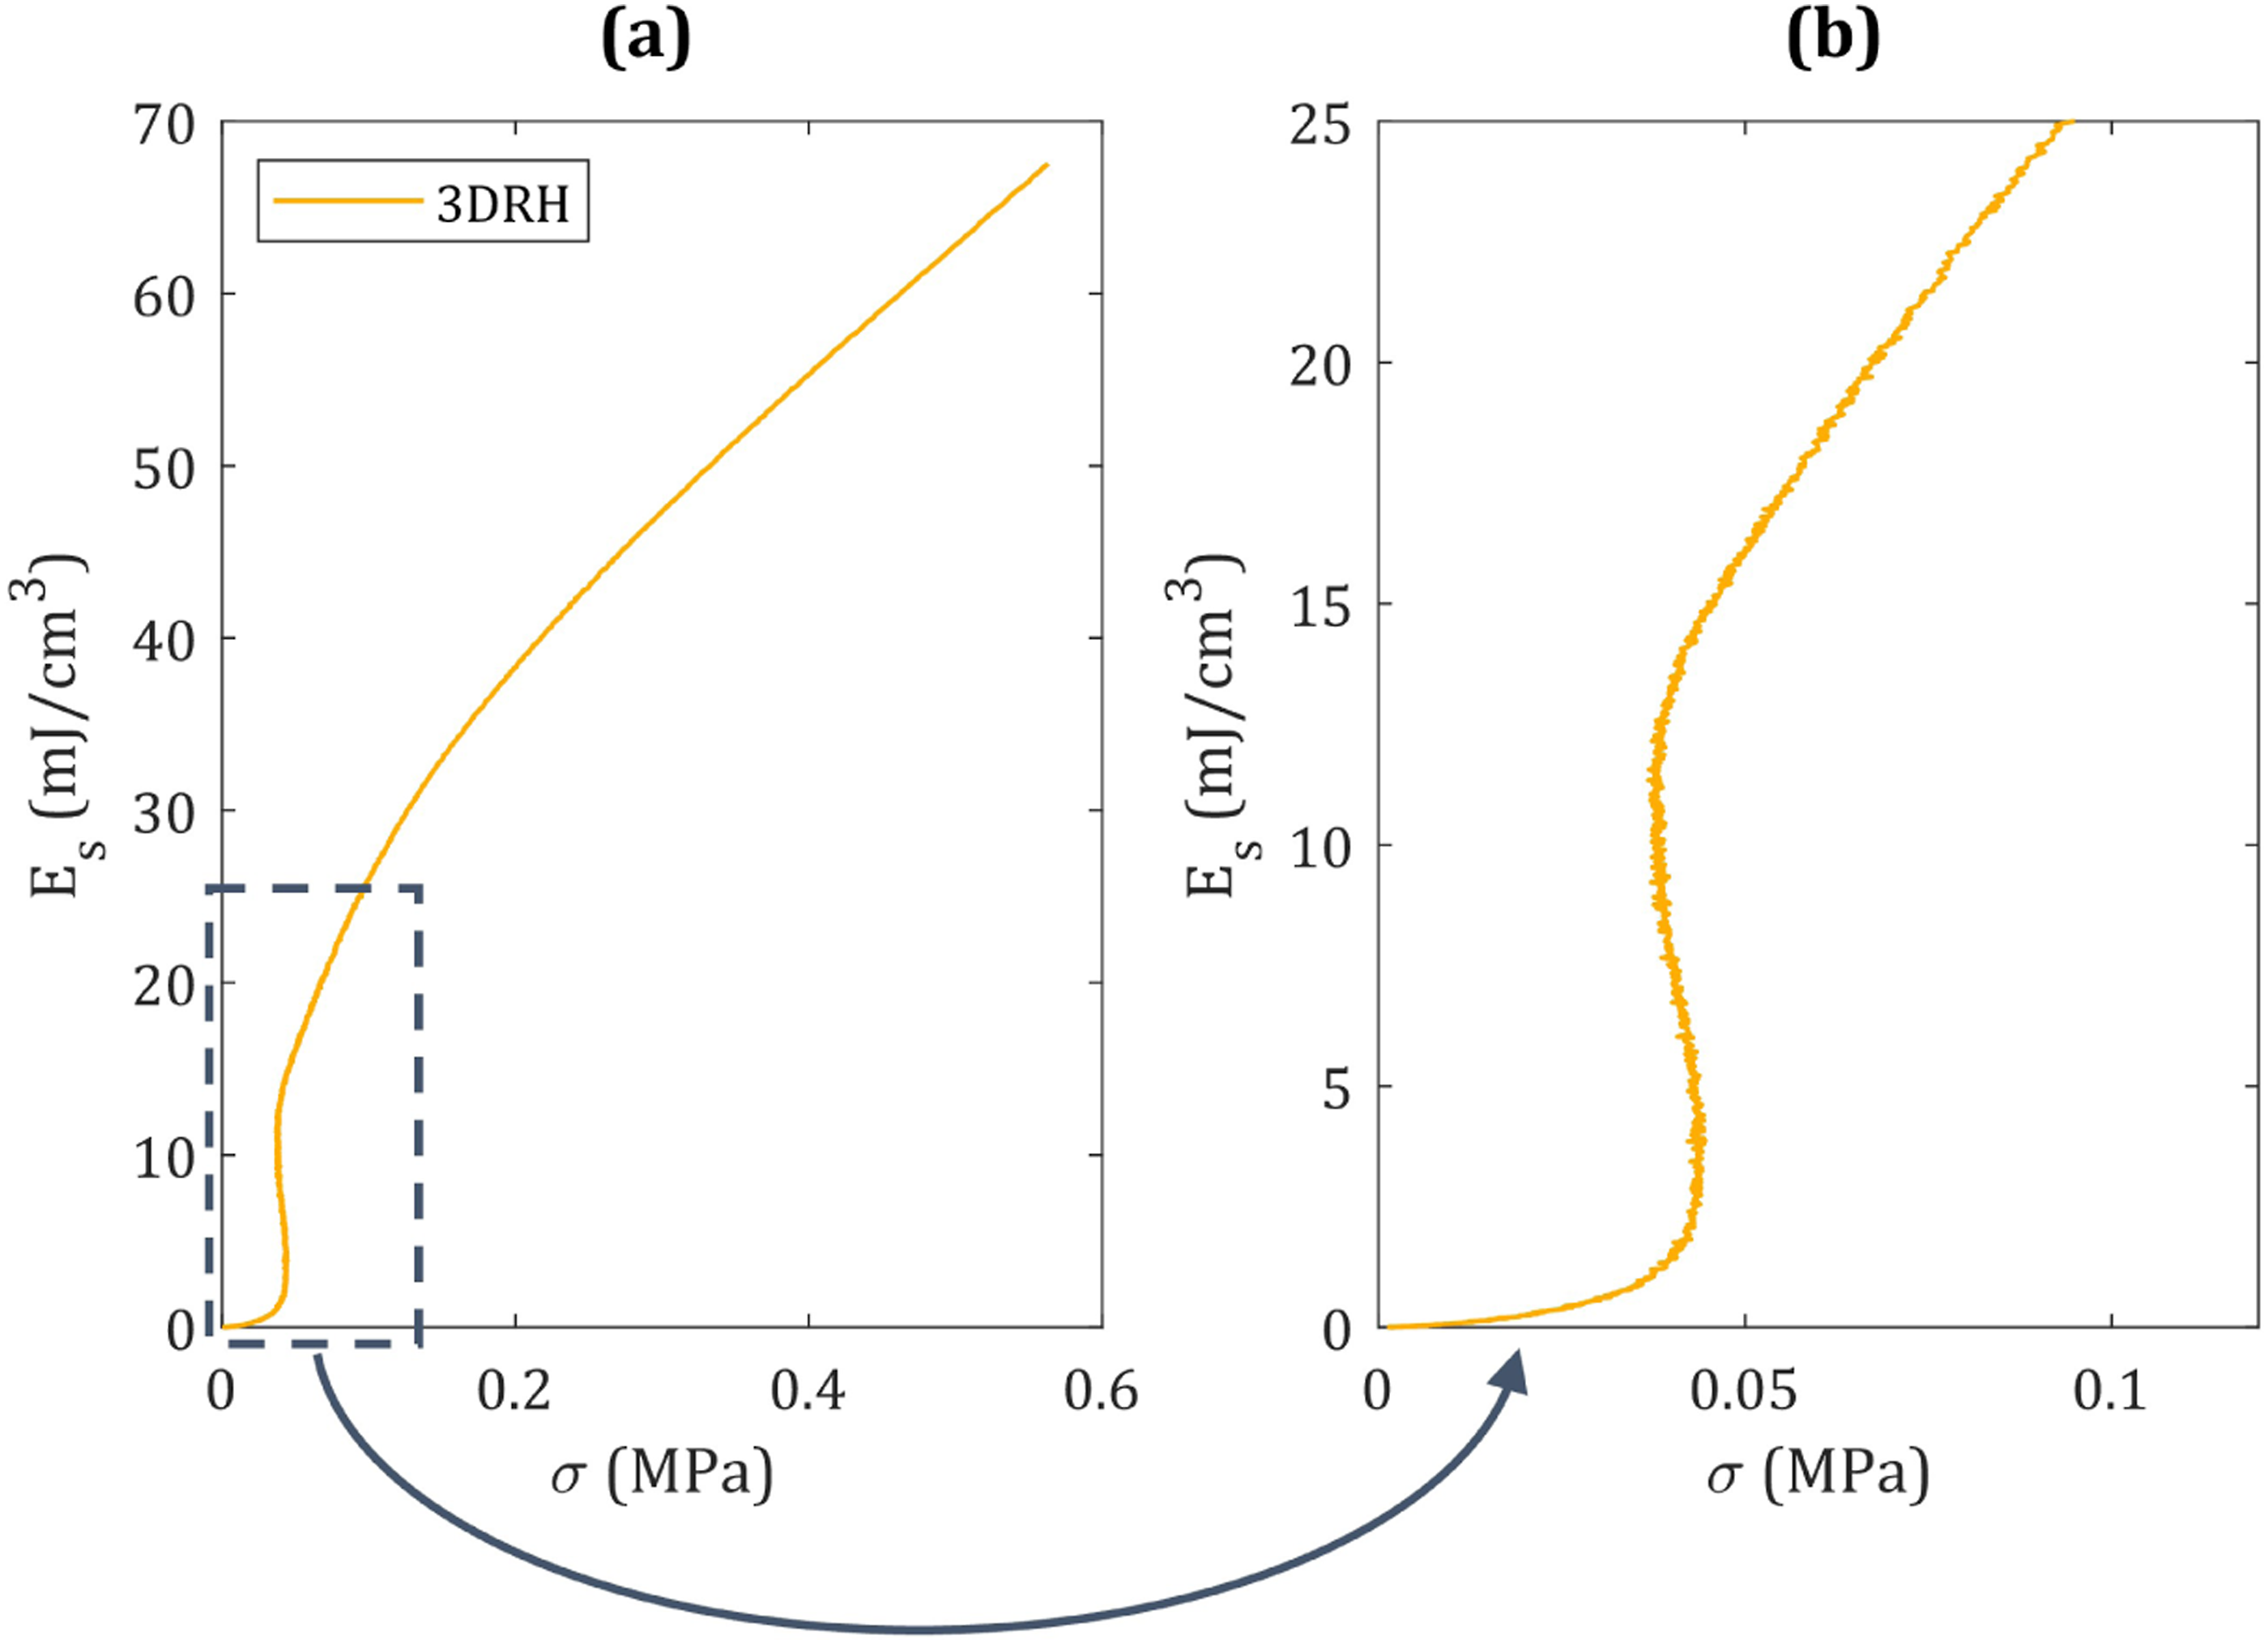
Figure 9(a) and (b) compare the energy absorption diagrams for all four cellular structures when subjected to loading in the X-direction. These plots illustrate that the optimum choice of protective structure varies depending on the specific energy level of the threat. For example, to absorb specific energies of E s < 3.3 mJ/cm3 in X-direction loading, the non-auxetic HC is the most efficient choice. It again becomes the most efficient choice for energy levels 14 < E s < 18.3 mJ/cm3. However, for E s > 25 mJ/cm3, the 3DRH specimen performs best i.e. transfers the lowest stress for a given energy absorption. Figure 9(c) summarises the most efficient energy absorbing structure i.e. that which transfers the lowest stress for a specific energy level, for X-direction loading.
Figure 10(a) and (b) compare the energy absorption diagrams for loading in the Y-direction. This time, the AH specimen is most efficient at the lowest specific energy levels for E s < 1.7 mJ/cm3. Similar to the trends observed for X-direction loading, the HC specimen is efficient for absorbing intermediate energy levels, 16.4 < E s < 25.5 mJ/cm3 and the 3DRH specimen performs best for high energy levels, E s > 25.5 mJ/cm3. Figure 10(c) summarises the most efficient energy absorbing structure i.e. that which transfers the lowest stress for a specific energy level, for Y-direction loading.
Figure 11(a) and (b) present the energy absorption diagram for the 3DRH structure subjected to quasi-static compression loading in the Z-direction. This structure is particularly efficient over intermediate energies, corresponding to its plateau loading regime. Figure 12 presents an overall summary of the most efficient energy absorbing structure, across all loading directions. The RH specimen is the most efficient at lower specific energies, in the range 2.4 < E
s
< 13.3 mJ/cm3. The 3DRH then becomes the most efficient for E
s
> 13.3 mJ/cm3. This finding is noteworthy as it emphasises not only the advantages of auxetics in general but also the superiority of a 3D-auxetic design for protective performance. This finding appears consistent with other work in the literature (Wei et al., 2023). Summary of the most efficient energy absorbing structure i.e. that which transfers the lowest stress for a specific energy level, across all loading directions.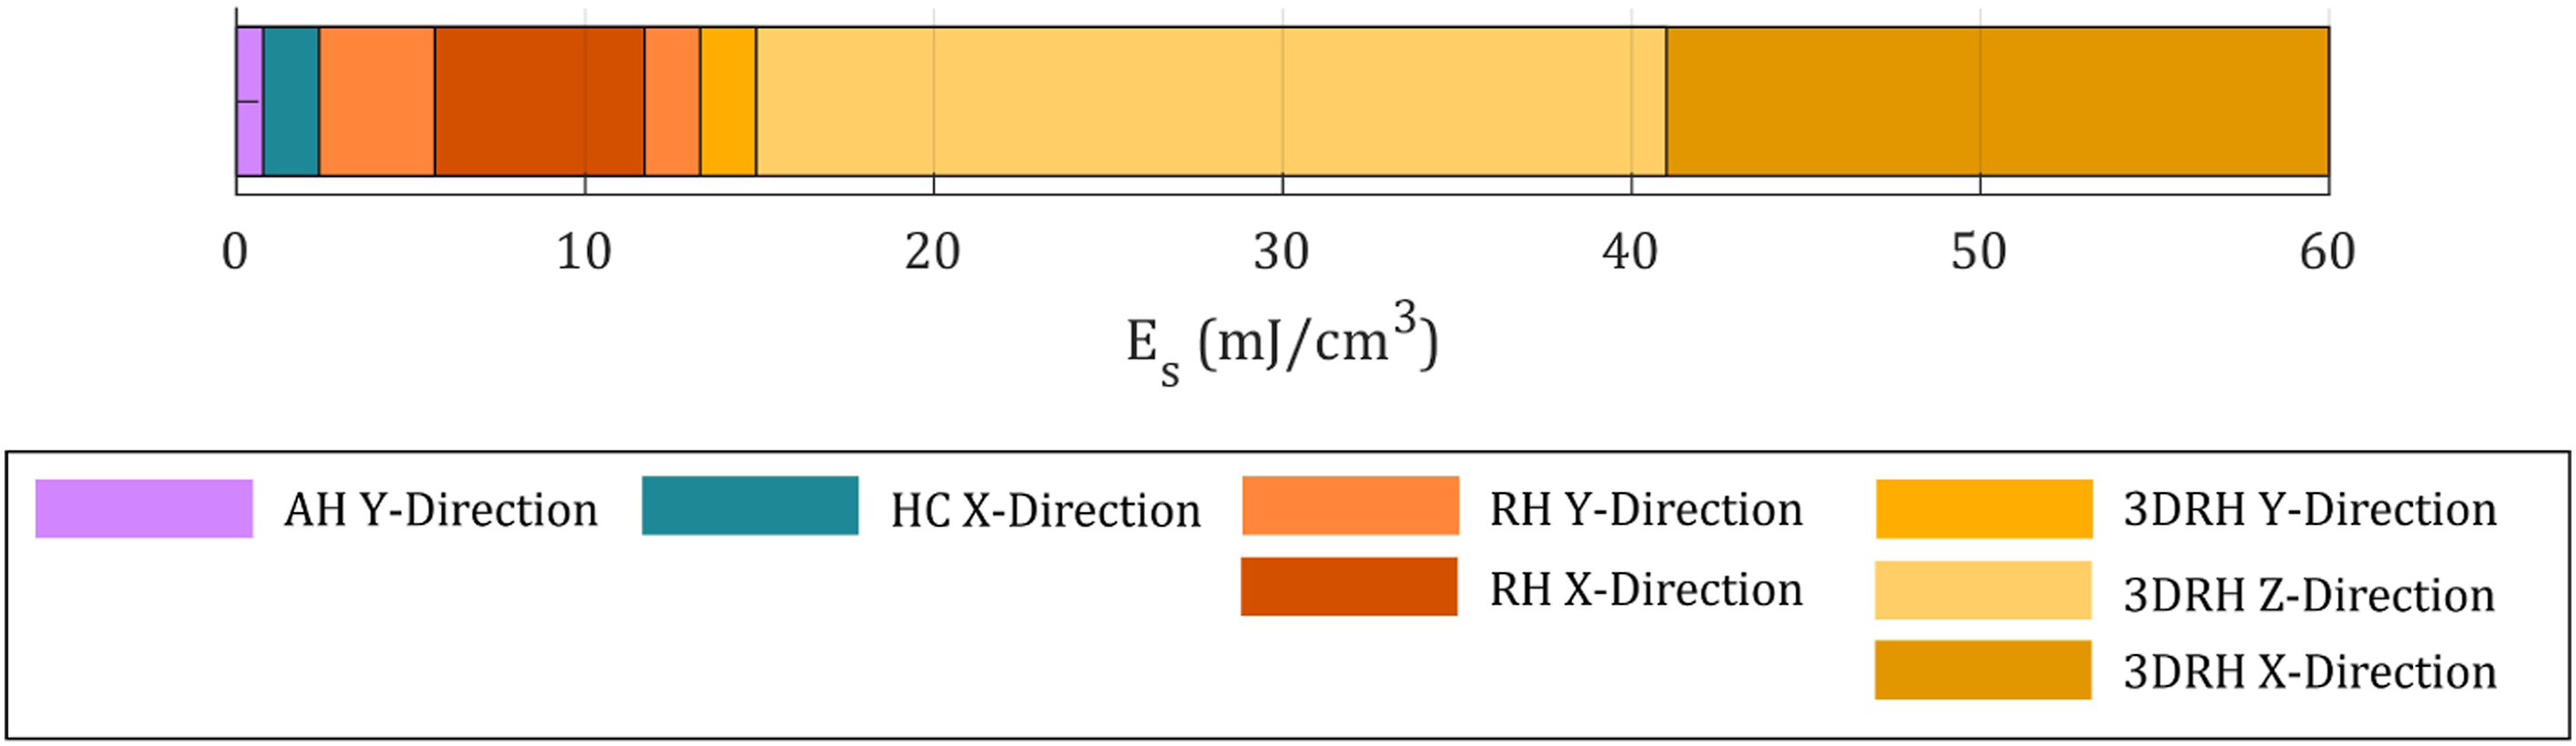
Cyclic compression
Figure 13 presents the nominal stress-nominal strain response for the HC and 3DRH specimens when subjected to cyclic compression in the X-direction. The specimens are cycled to maximum compressive strains, ϵmax of 0.125, 0.25 and 0.5, unloading to zero between each compression. In general, the loading portion of the curves conform to that observed in the quasi-static compression tests presented previously. However, the unloading response does not follow the same path as the loading response curve. Instead, it tracks lower stress values for a given strain in comparison to the loading curve, thus forming a hysteresis loop. This is a result of the viscoelastic nature of the TPU parent material. The loading-unloading curve for each test follows the clockwise direction of each loop. In general the specimens display excellent deformation recovery and thus reusability, consistent with other studies on TPU cellular structures (Bates et al., 2019; Yuan et al., 2017). This may be particularly important for certain applications, for example, in the design of personal protective armour where repeated impacts are likely. Nominal stress-nominal strain response for specimens subjected to cyclic compression in the X-direction for (a) Honeycomb (HC) and (b) 3D Re-entrant Honeycomb (3DRH) geometries. The loading-unloading curve for each test follows the clockwise direction of each loop.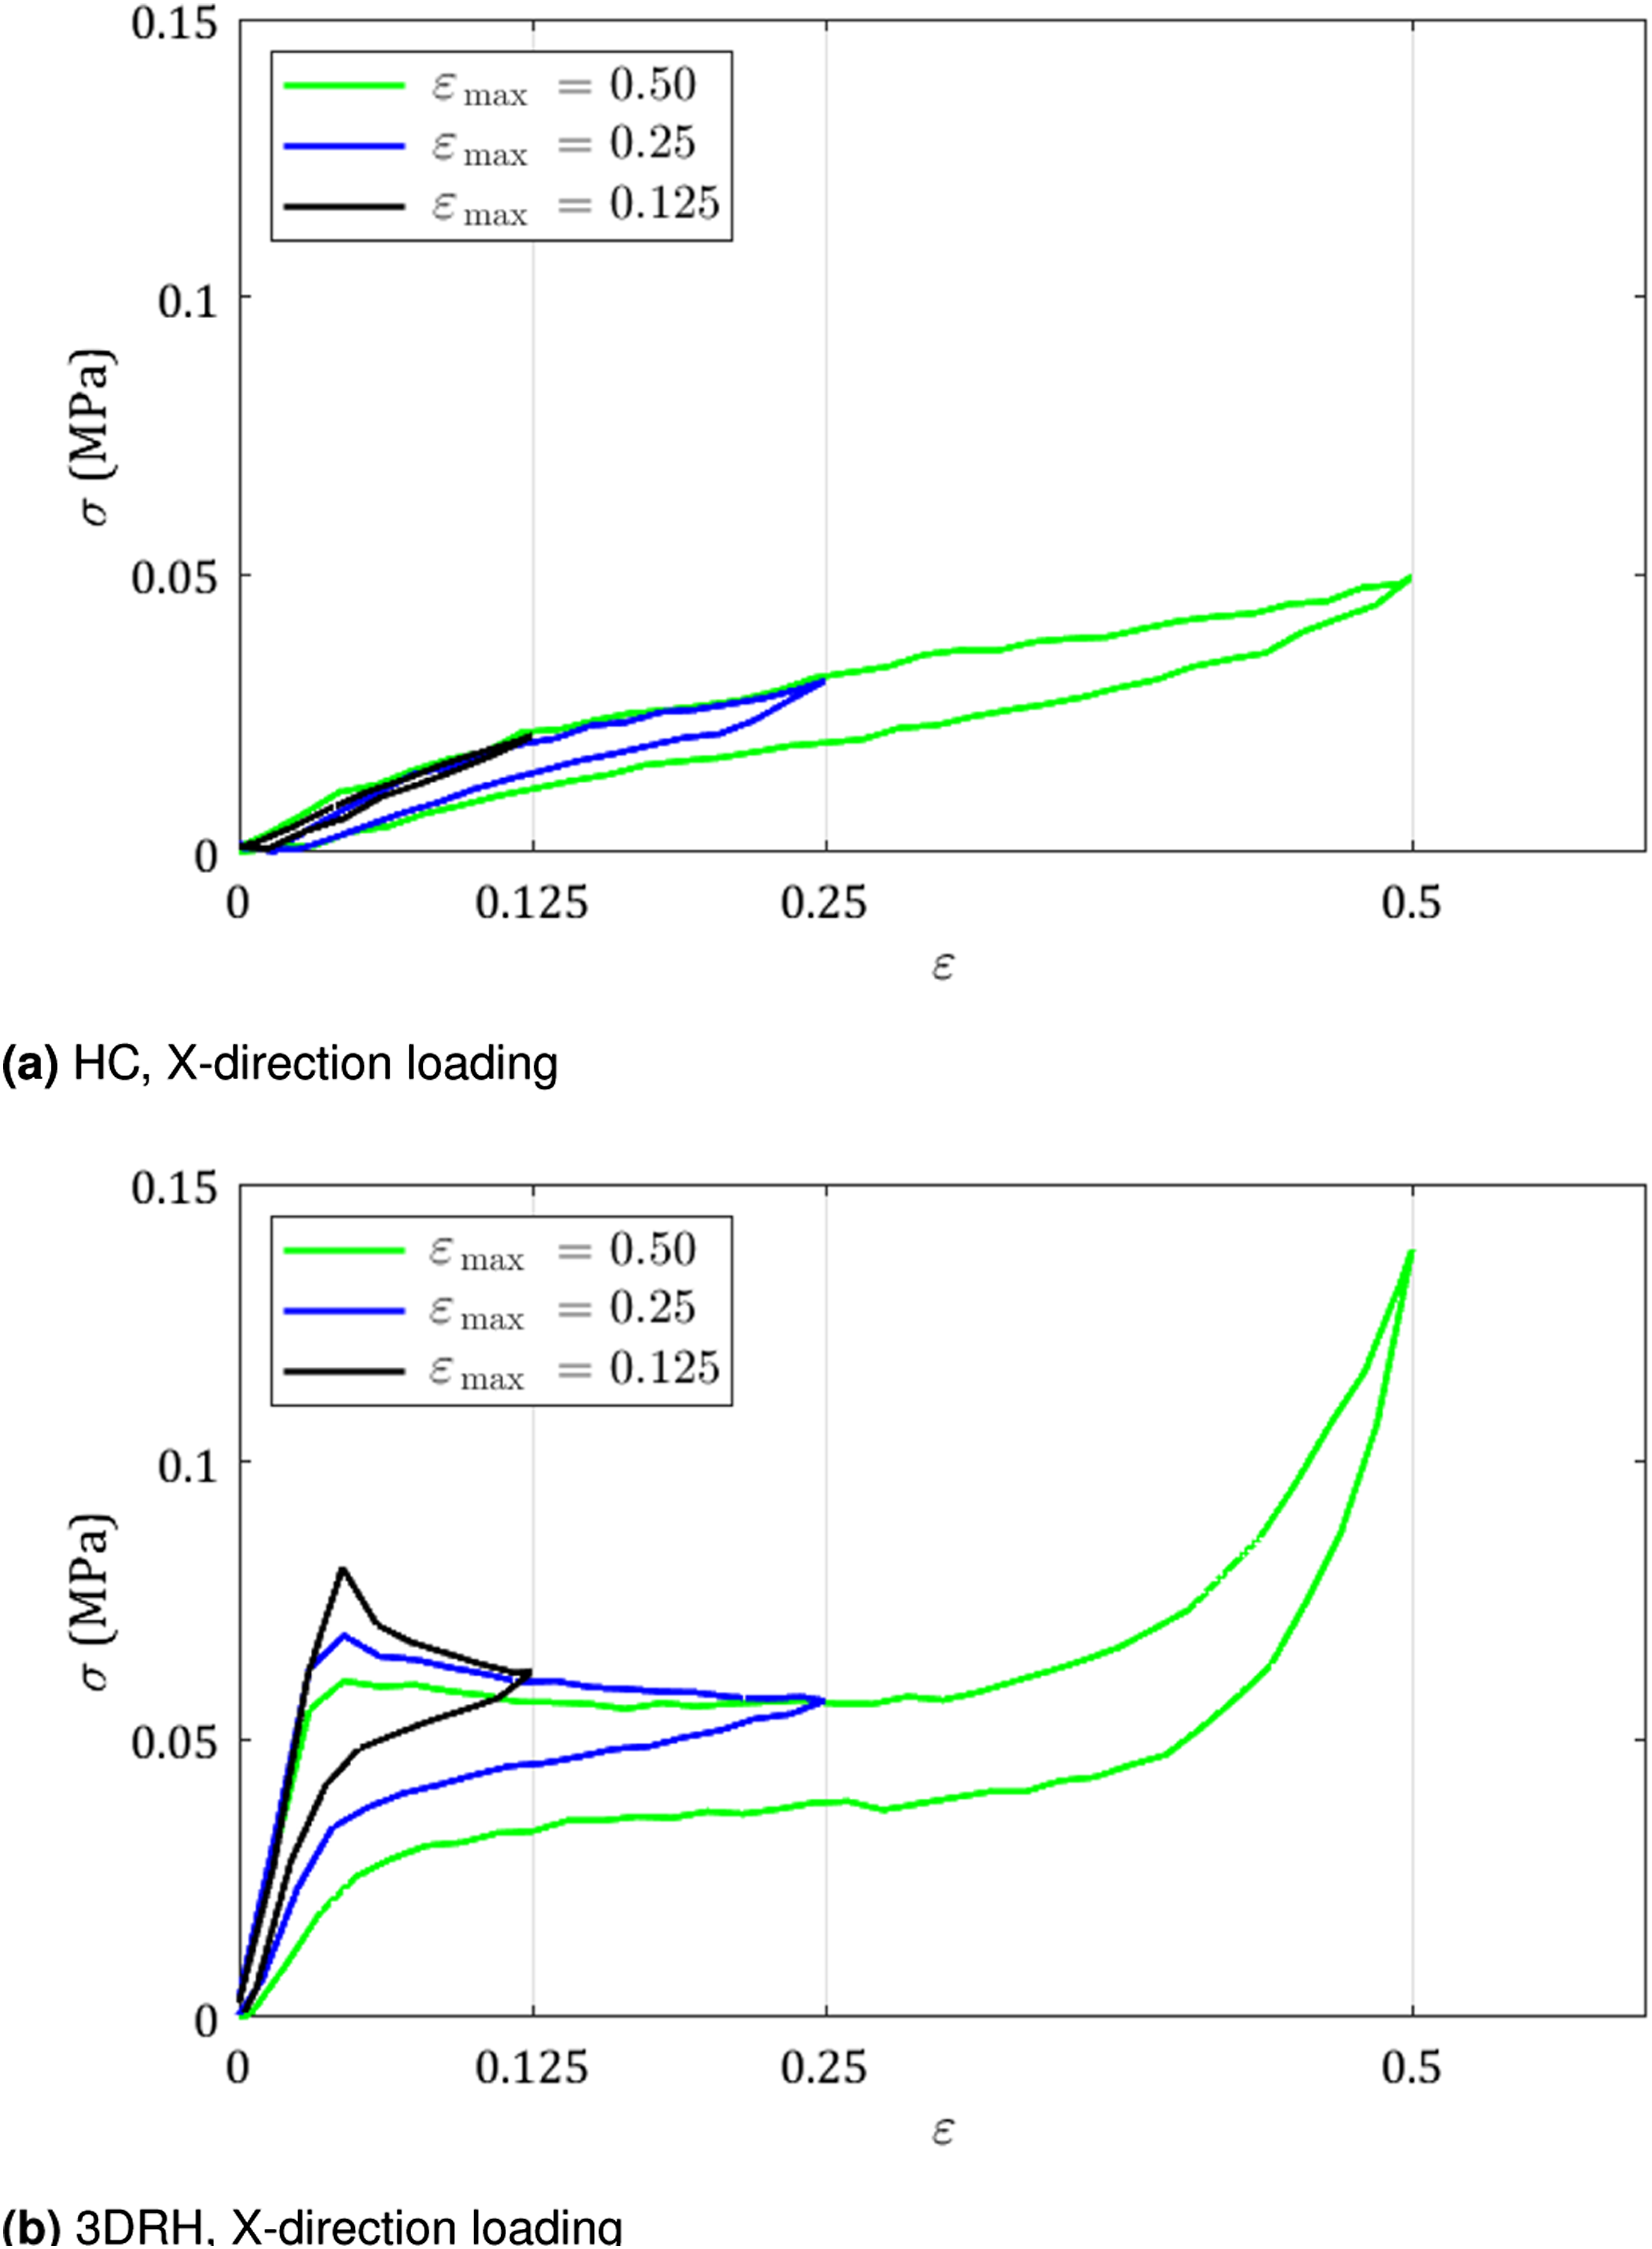
Specific energy dissipated, W
s
by each structure is equal to the area enclosed by the hysteresis loop of the cyclic compression tests. This was determined using a Matlab script where the area, Plots of specific energy dissipated, W
s
against maximum strain, ϵmax for the cyclic compression tests in (a) the X-direction, (b) the Y-direction and (c) the Z-direction.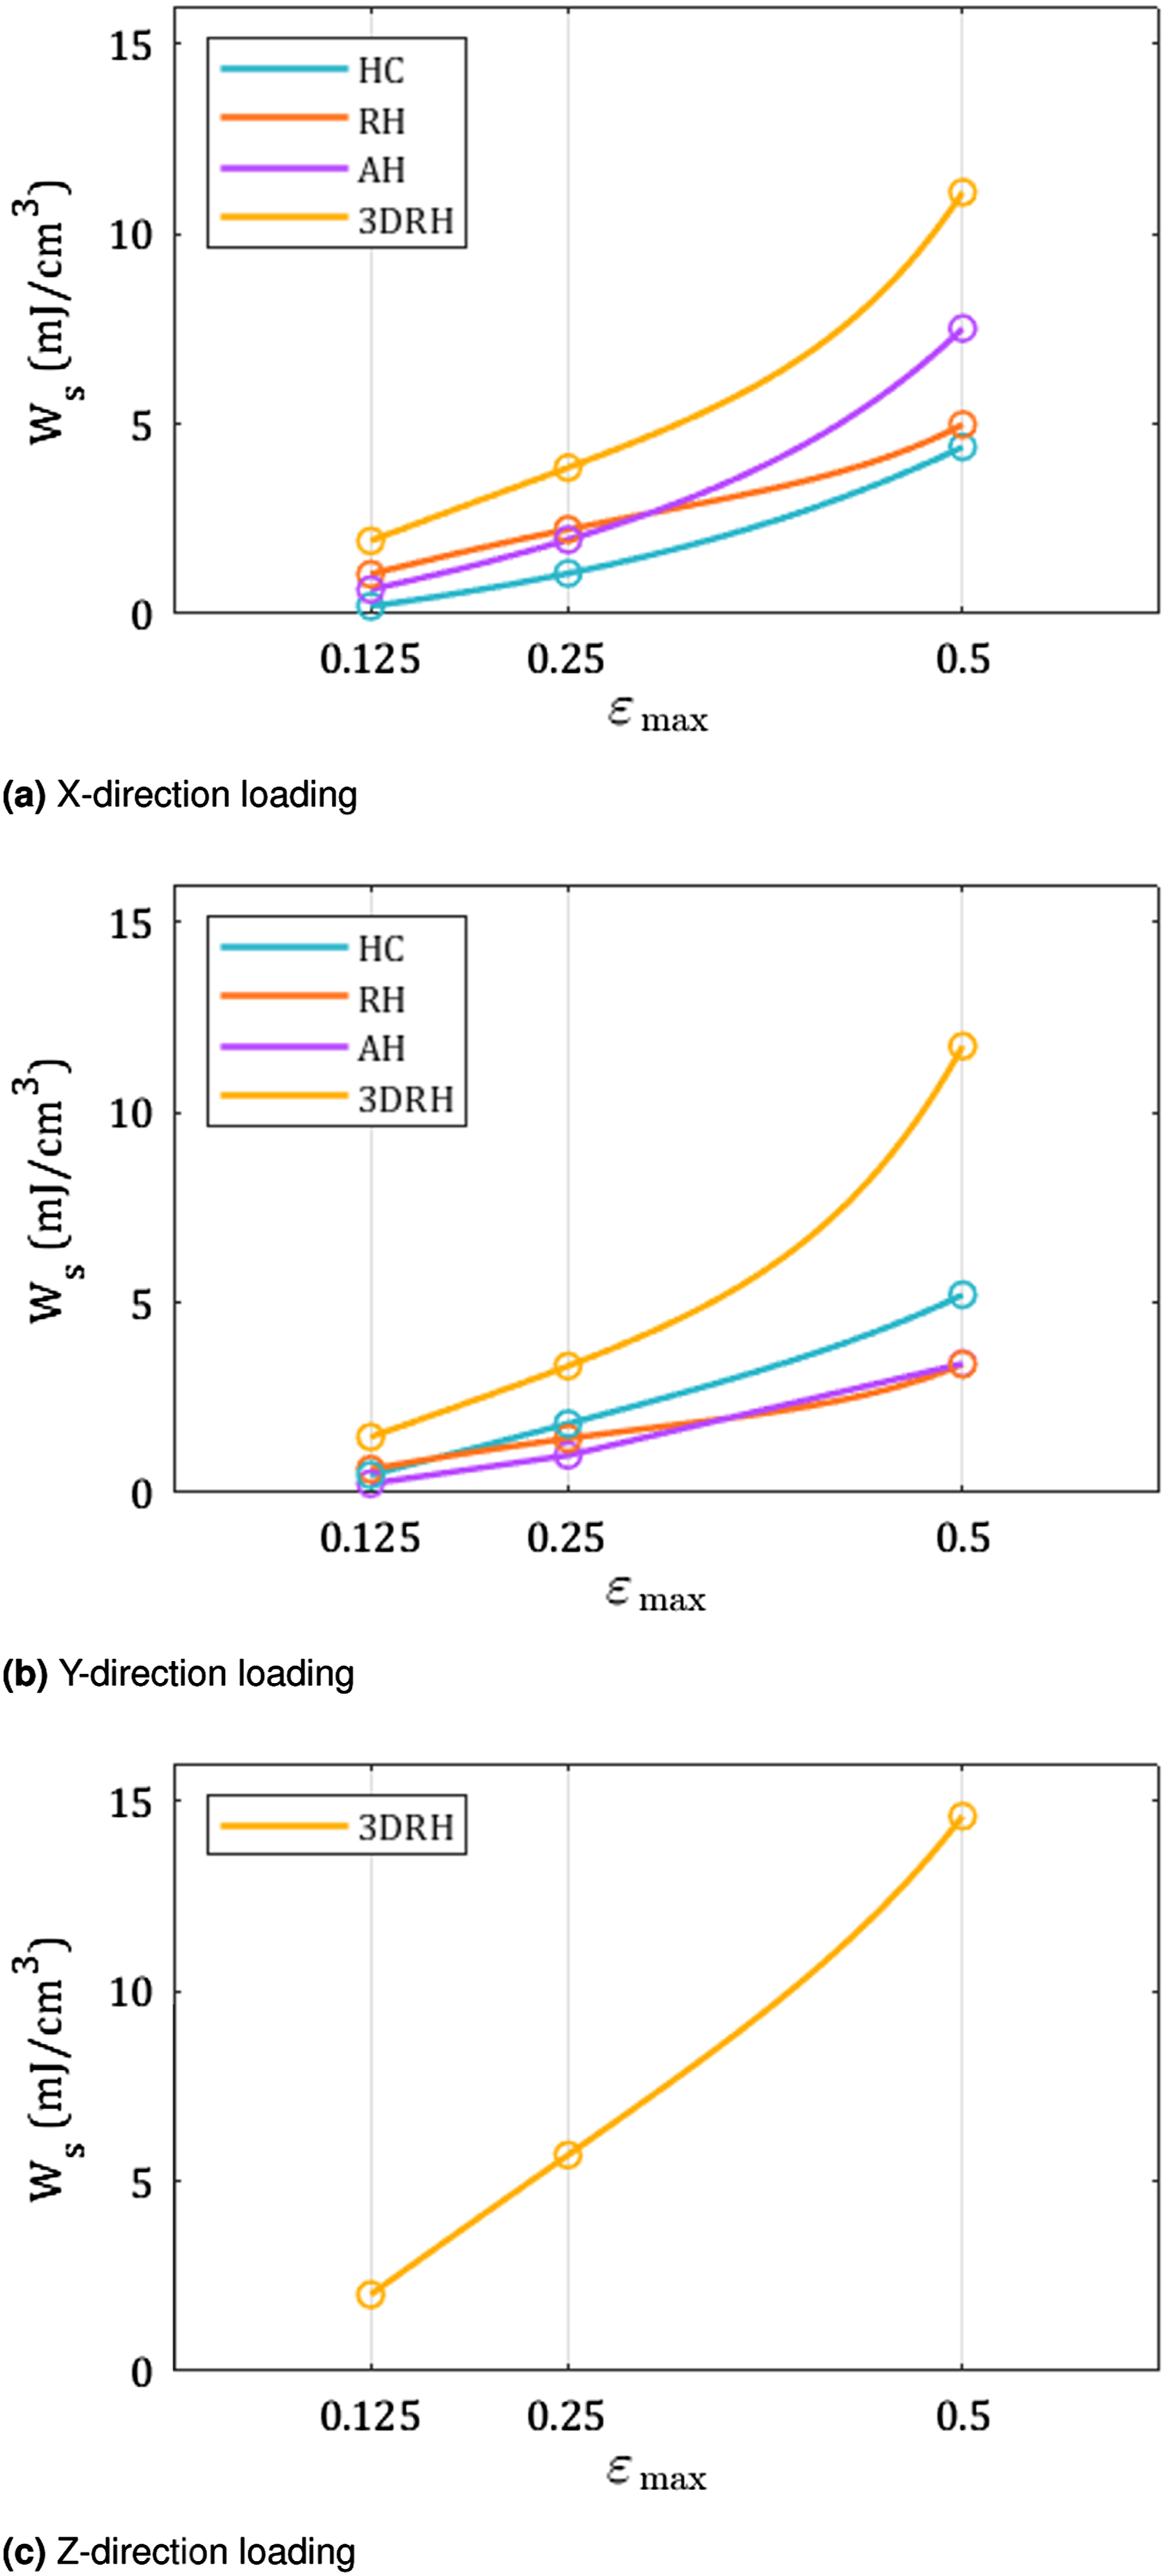
Low-velocity impact
The specimens were subjected to low-velocity impact tests using a drop-tower apparatus. The response to two different impact energy levels was investigated. Figure 15 displays the force-time response recorded for impact tests at an energy of 5.7 J, achieved by dropping a mass 2.9 kg from a height of 0.2 m. The corresponding acceleration-time and nominal stress-nominal strain plots are presented in the Appendix for completeness. Force-time response of the specimens when subjected to an impact energy of 5.7 J in (a) the X-direction, (b) the Y-direction and (c) the Z-direction.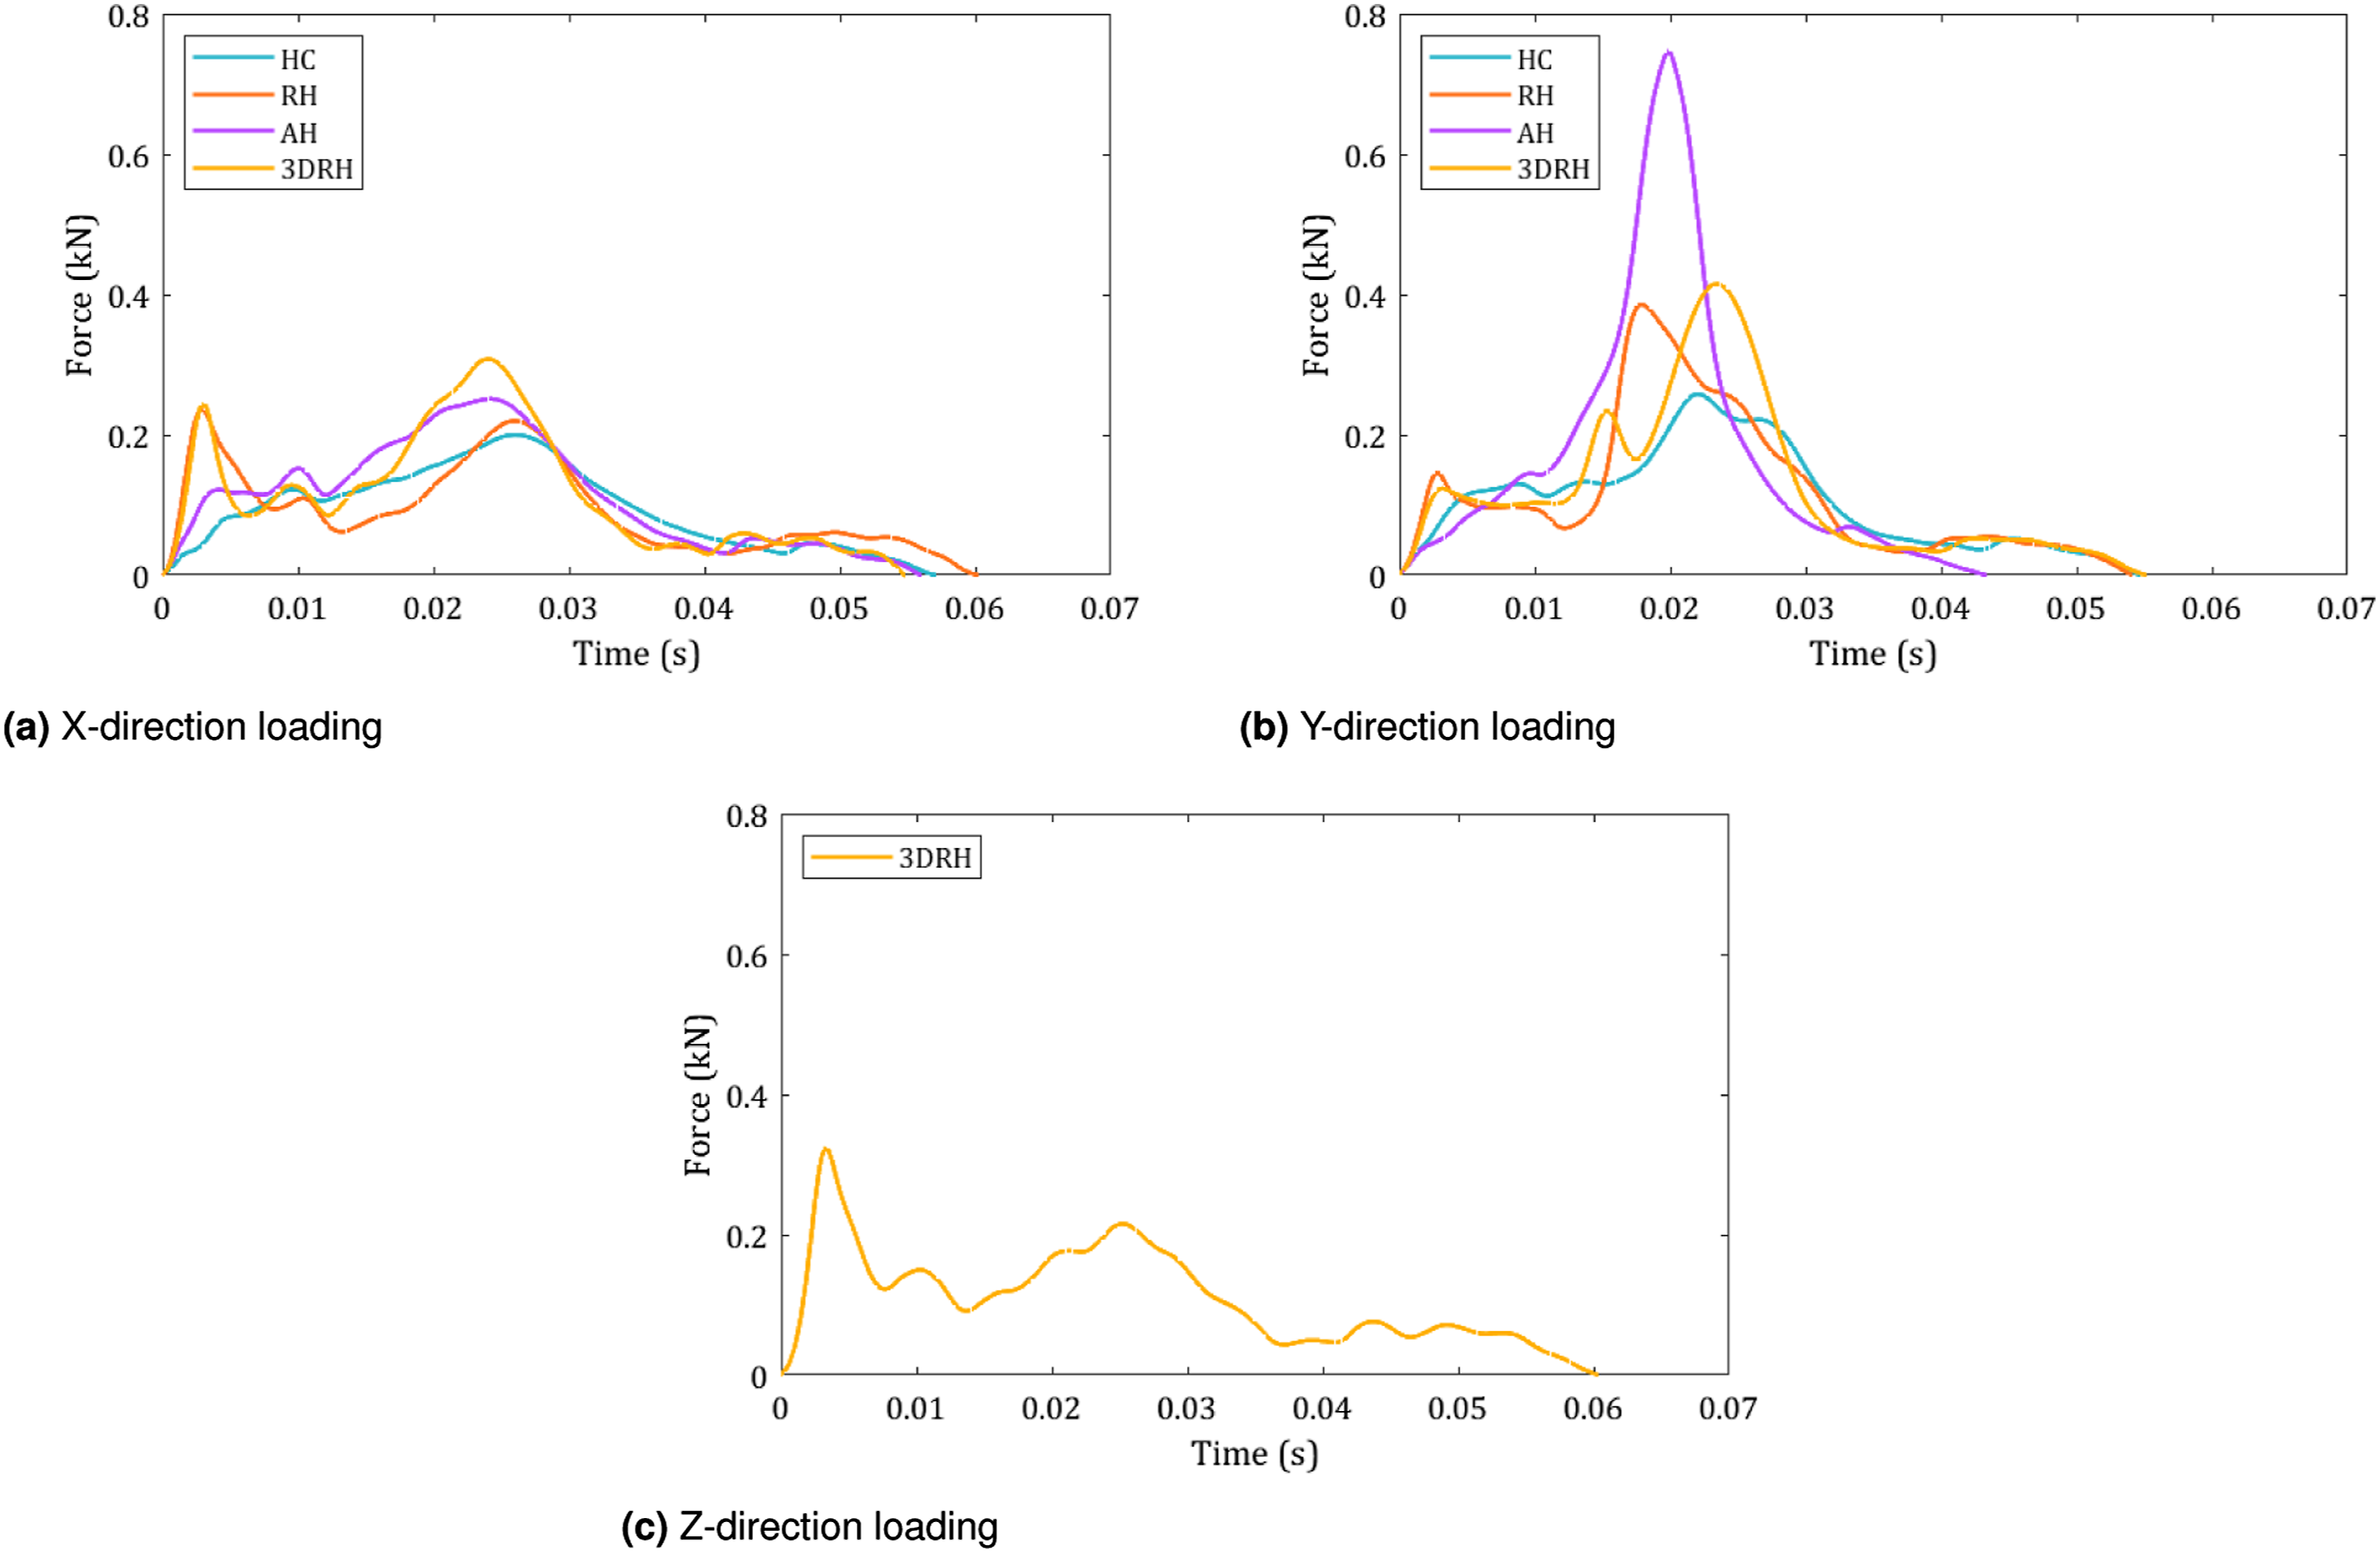
Examining the response to X-direction loading in Figure 15(a), it is evident that the shape of the response curves are broadly similar across all specimens, recording similar peak forces and similar loading durations. Both the RH and 3DRH specimens exhibit an initial peak early in the response, followed by a secondary peak in line with the other specimen geometries. The non-auxetic HC exhibits the lowest peak force, at a value of 0.20 kN and the 3DRH experiences the highest peak, at a value of 0.31 kN. Figure 15(b) shows that the response to impact loading in the Y-direction displays similar trends, with the exception of the AH specimen which reaches a much higher peak than the other specimens at a value of 0.75 kN. It is noted that the Y-direction specimens are smaller in height, so some onset of densification may have occurred producing these higher forces. For impact in the Z-direction, presented in Figure 15(c), the behaviour of the 3DRH specimen is similar to that observed in the X-direction, though the initial peak is higher than the secondary one, at a value of 0.32 kN.
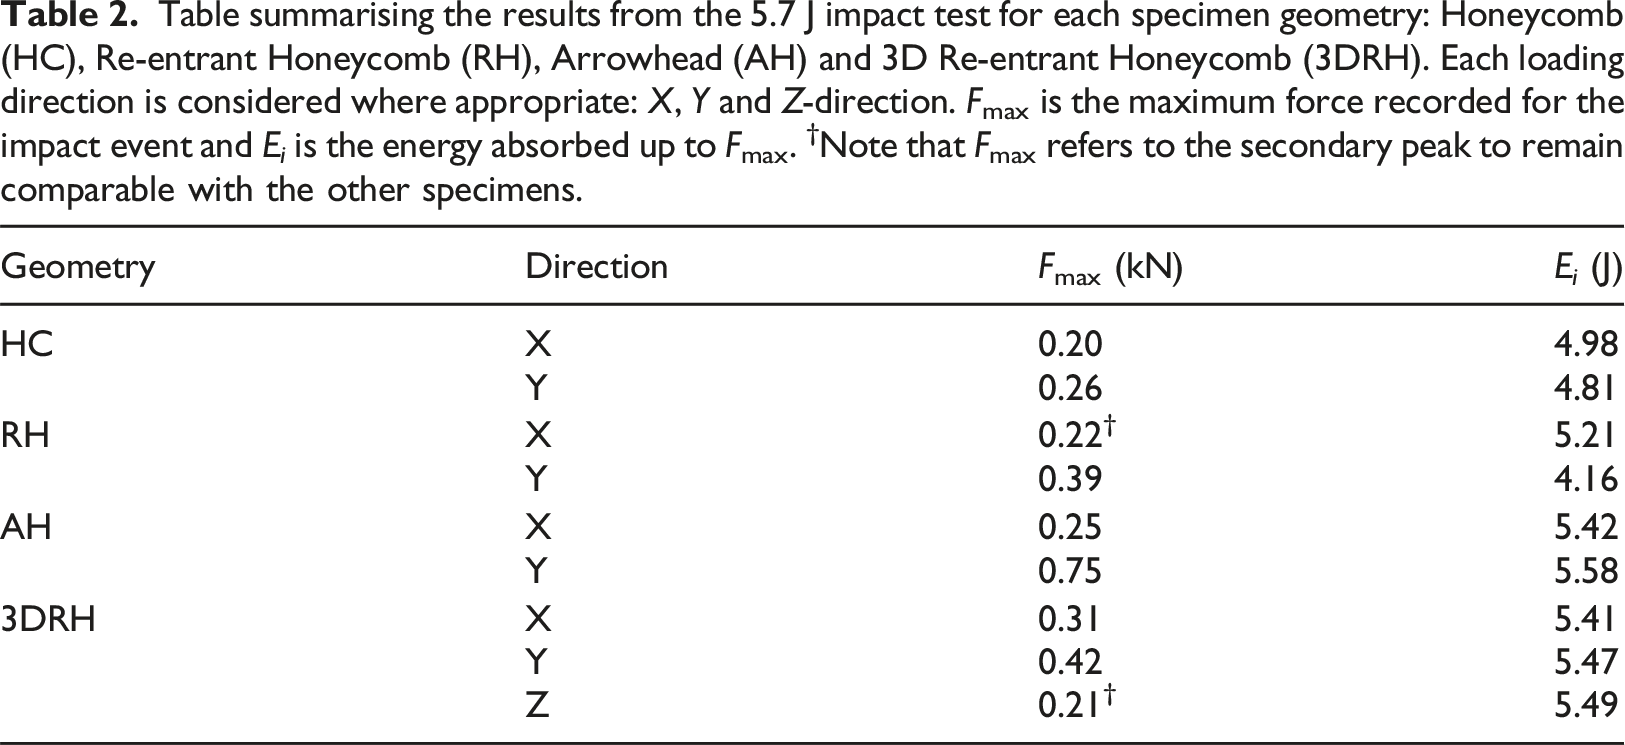
To assess the protective performance, the force-displacement response is integrated up the point of maximum force, Fmax. The energy up to the maximum force corresponds to the energy required to initiate damage within the structure, E i (Agarwal and Broutman, 1990; Amith Kumar & Ajith Kumar, 2020). During this phase, the material actively responds to the impact by storing elastic strain energy without generating internal damage, hence remaining within its designed deformation limits. From this definition, it is clear that E i represents a crucial parameter for the design of a protective structure, as it ensures the structure can absorb energy efficiently during the most critical phase of impact while maintaining its structural integrity (Agarwal and Broutman, 1990; Amith Kumar & Ajith Kumar, 2020).
Table summarising the results from the 5.7 J impact test for each specimen geometry: Honeycomb (HC), Re-entrant Honeycomb (RH), Arrowhead (AH) and 3D Re-entrant Honeycomb (3DRH). Each loading direction is considered where appropriate: X, Y and Z-direction. Fmax is the maximum force recorded for the impact event and E i is the energy absorbed up to Fmax. †Note that Fmax refers to the secondary peak to remain comparable with the other specimens.
Subsequently, the specimens were subjected to a higher impact energy level of 17.5 J in an effort to push the specimens’ response well into their densification regimes. This was achieved by increasing the drop height to 0.6 m and confirmed by visual inspection during the tests. The recorded force-time response for all specimens, in all loading directions, is presented in Figure 16. The corresponding acceleration-time and nominal stress-nominal strain plots are presented in the Appendix for completeness. For this higher impact energy level, there are more marked differences between the peak forces and response durations recorded. Force-time response of the specimens when subjected to an impact energy of 17.5 J in (a) the X-direction, (b) the Y-direction and (c) the Z-direction.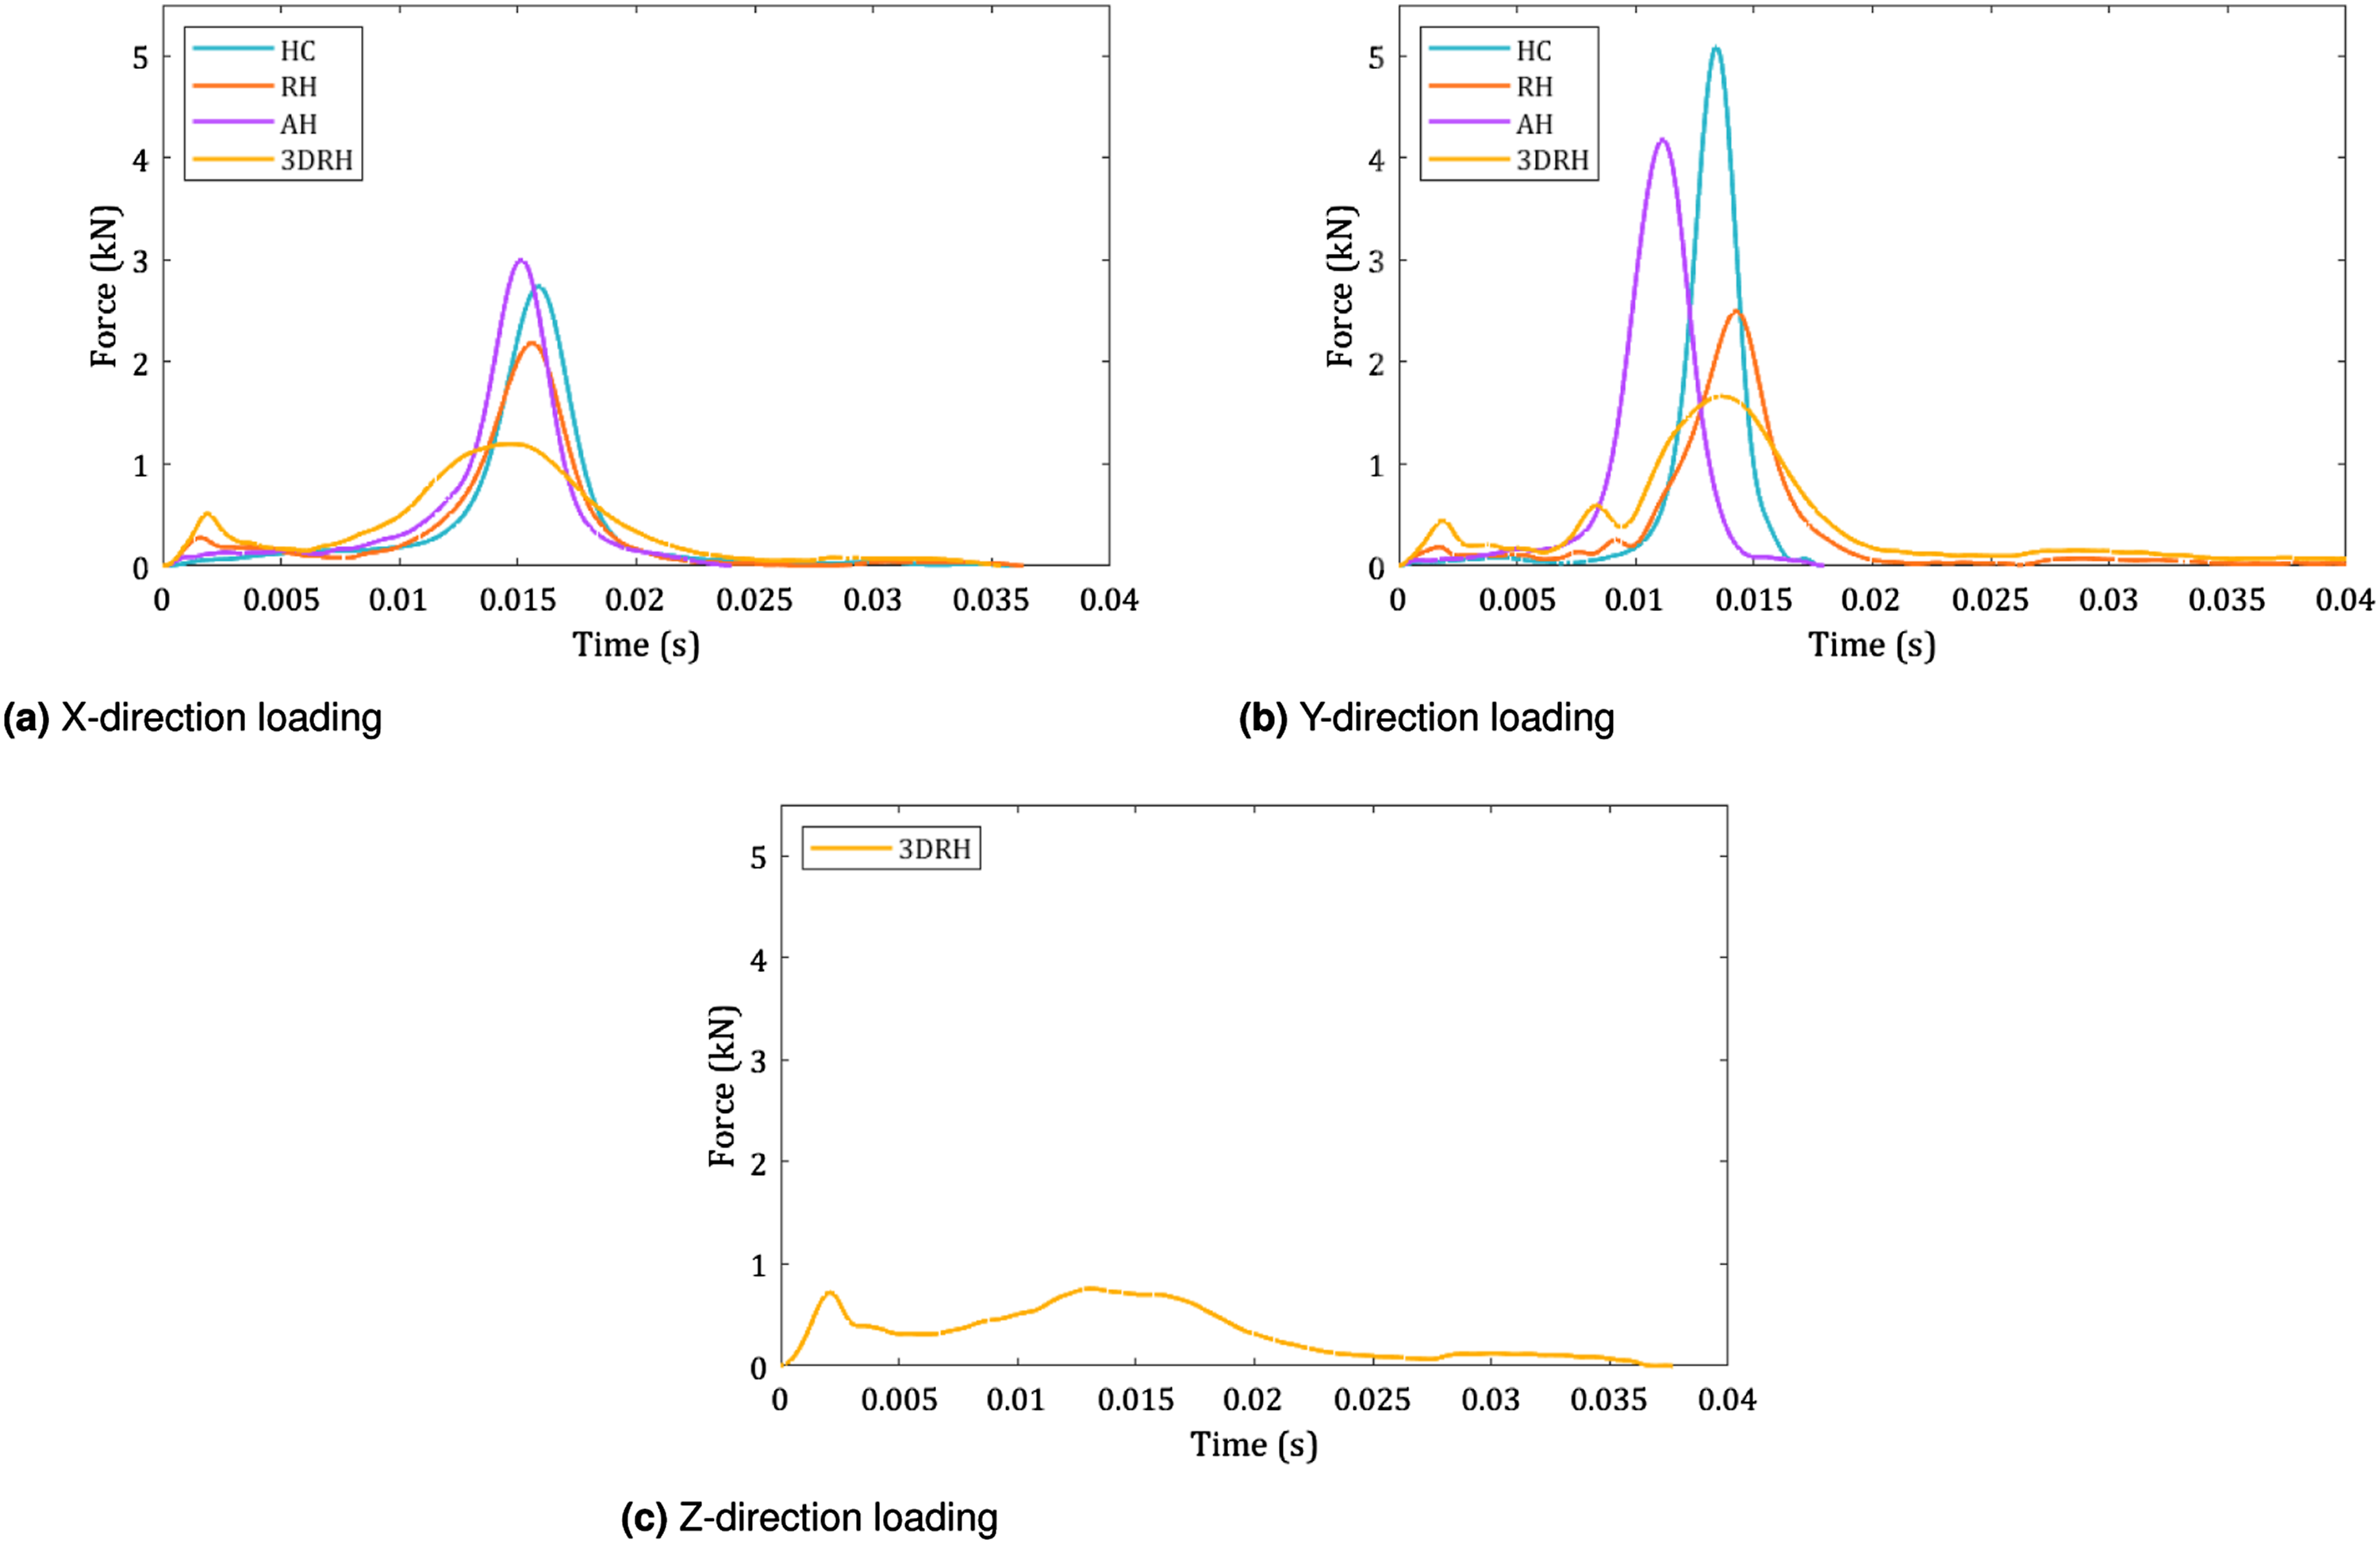
Examining first the X-direction loading in Figure 16(a), both the AH and HC specimens achieve the highest recorded peak forces of 3.00 kN and 2.74 kN, respectively. It is interesting to note the presence of an early initial peak in the force-time response of the RH and 3DRH specimens which was also present for the lower velocity impact test. Compared to the other specimens, the shape of the response curve for the 3DRH geometry is flatter, exhibiting a longer response duration and the lowest peak force of 1.20 kN. These same trends are observed for the Y-direction loading responses presented in Figure 16(b). The Z-direction response of the 3DRH specimen, displayed in Figure 16(c), exhibits the flattest response curve of all, recording a peak force of 0.76 kN.
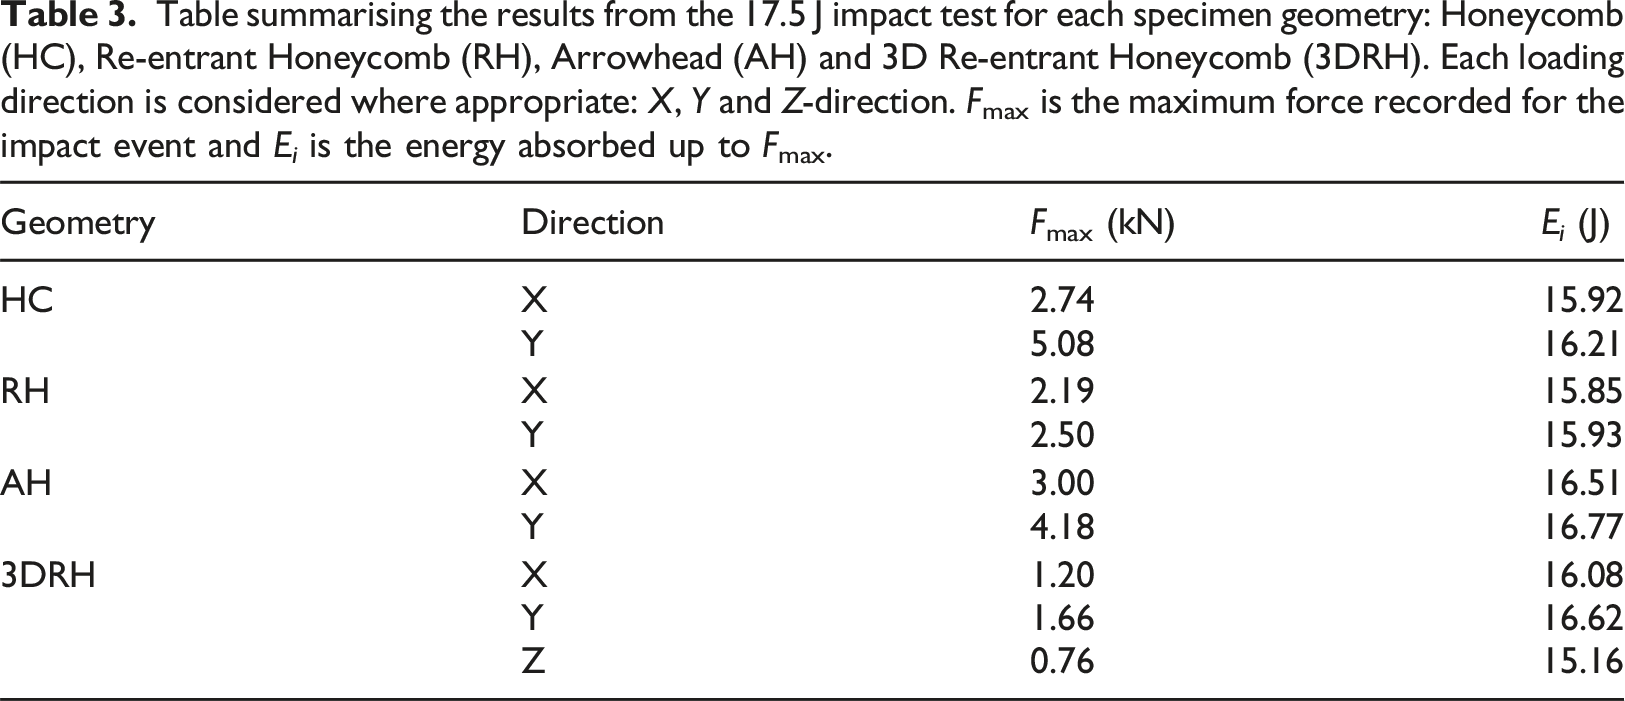
Table summarising the results from the 17.5 J impact test for each specimen geometry: Honeycomb (HC), Re-entrant Honeycomb (RH), Arrowhead (AH) and 3D Re-entrant Honeycomb (3DRH). Each loading direction is considered where appropriate: X, Y and Z-direction. Fmax is the maximum force recorded for the impact event and E i is the energy absorbed up to Fmax.
Conclusion
An experimental study was performed to assess the protective performance of four elastomeric cellular structures, 3D-printed in thermoplastic polyurethane: one non-auxetic, two 2D-auxetic and one 3D-auxetic. The structures are subjected to quasi-static compression, cyclic compression and low-velocity impact tests. The following conclusions are established: • Energy absorption diagrams, based on quasi-static compression data, demonstrate that the choice of most efficient energy absorbing structure depends on both the specific energy of the threat and the direction of loading. • Based on quasi-static compression data, the 3D-auxetic re-entrant honeycomb structure is the most efficient energy absorbing structure i.e it transfers the lowest stress, for specific energies greater than 13.3 mJ/cm3. • Cyclic compression tests reveal the impressive recoverability and thus reusability of elastomeric cellular structures. • Cyclic compression tests reveal all structures exhibit hysteresis behaviour. In general, the 3D-auxetic structure provides the greatest energy dissipation. • Low-velocity impact tests at an energy level of 5.7 J reveal no significant difference in response between the structures for X-direction loading. For Y-direction loading, the AH structure exhibits a significantly higher peak force compared to the others. For both X and Y direction loading, the non-auxetic HC exhibits the lowest peak force. • Increasing the impact energy to 17.5 J pushes the structures to operate in their densification regime. In this regime, the AH and HC exhibit the highest peak force for X and Y direction loading. The 3D-auxetic structure exhibits the lowest peak force and longest response duration for both X and Y direction loading. • For an impact energy of 17.5 J, the 3D-auxetic structure loaded in the Z-direction exhibits the lowest peak force, and longest response duration compared to any other structure, loaded in any direction. • The behaviour observed in the low-velocity impact tests appear consistent with the trends identified in the quasi-static tests i.e. the 3D-auxetic structure is the best choice for absorbing high impact energies since it results in a lower stress being transferred when subject to an impact energy which causes densification.
This work has demonstrated the capability of 3D-auxetic elastomeric cellular structures to provide superior protective performance. It has been shown that by modifying the auxetic behaviour of TPU cellular structures, both the energy absorbing and damping characteristics can be altered. This paves the way for future research into examining material and geometrical tuning for flexible, lightweight protective armour and motivates further study into higher rate dynamic regimes.
Footnotes
Declaration of conflicting interests
The author(s) declared no potential conflicts of interest with respect to the research, authorship, and/or publication of this article.
Funding
The author(s) received no financial support for the research, authorship, and/or publication of this article.