
Abstract
Accurate quantification of the blast load arising from detonation of a high explosive has applications in transport security, infrastructure assessment and defence. In order to design efficient and safe protective systems in such aggressive environments, it is of critical importance to understand the magnitude and distribution of loading on a structural component located close to an explosive charge. In particular, peak specific impulse is the primary parameter that governs structural deformation under short-duration loading. Within this so-called extreme near-field region, existing semi-empirical methods are known to be inaccurate, and high-fidelity numerical schemes are generally hampered by a lack of available experimental validation data. As such, the blast protection community is not currently equipped with a satisfactory fast-running tool for load prediction in the near-field. In this article, a validated computational model is used to develop a suite of numerical near-field blast load distributions, which are shown to follow a similar normalised shape. This forms the basis of the data-driven predictive model developed herein: a Gaussian function is fit to the normalised loading distributions, and a power law is used to calculate the magnitude of the curve according to established scaling laws. The predictive method is rigorously assessed against the existing numerical dataset, and is validated against new test models and available experimental data. High levels of agreement are demonstrated throughout, with typical variations of <5% between experiment/model and prediction. The new approach presented in this article allows the analyst to rapidly compute the distribution of specific impulse across the loaded face of a wide range of target sizes and near-field scaled distances and provides a benchmark for data-driven modelling approaches to capture blast loading phenomena in more complex scenarios.
Keywords
Introduction and context
Accurate appraisal of the viability of structures and protective systems following the close-in detonation of a high explosive is only possible if the analyst has an accurate model detailing both the distribution and magnitude of the imparted load. In these so-called extreme near-field scenarios, the loading is highly localised, whilst deformation and damage occur on timescales which are orders of magnitude longer than the duration of loading. It is clear, therefore, that the temporal form of the loading is of lesser importance, yet a description of the spatial distribution of the peak loading, that is, peak specific impulse, is critical.
Quantification of blast loading became a particular topic of interest to the engineering community in the years following the second world war. One such study by Kingery (1966), later revisited by Kingery and Bulmash (1984) – hereafter abbreviated as KB – compiled existing blast pressure measurements and used geometric scaling laws, formulated independently by Hopkinson (1915) and Cranz (1926), to develop a semi-empirical tool for predicting normally reflected and incident blast wave parameters for hemispherical surface bursts and spherical free air bursts. Relationships are provided from effectively contact explosions, out to
The KB semi-empirical predictions have been shown to be accurate for medium to far-field scaled distances (Rigby et al., 2014), however in a review of uncertainty and conservatism in blast load predictive models, Bogosian et al. (2002) found that the KB curves ‘substantially underpredicted the recorded data for
Alternatively, experimental methods can be used to directly measure near-field reflected specific impulse and specific impulse distributions, for example, impulse plugs (Huffington and Ewing 1985; Nansteel et al., 2013), Hopkinson pressure bars (Cloete and Nurick, 2016; Edwards et al., 1992; Piehler et al., 2009, Rigby et al., 2015a; Tyas et al., 2016), and flush-mounted pressure gauges (Aune et al., 2016). Near-field blast load measurements are onerous for a number of reasons. Firstly, the high magnitude of loading necessitates the use of robust support structures and protective housing for sensitive equipment (which itself is required to record in the MHz frequency range). Secondly, the measurements themselves are highly variable owing to the presence of surface instabilities in the early stages of expansion of the detonation products (Rigby et al., 2020). It is therefore not practical to develop a predictive approach based solely on physical testing, however experimental data remains a fundamental requirement for validation of numerical modelling schemes. Finite element (FE) and computational fluid dynamics (CFD) approaches have been used recently to investigate near-field blast loading, with the results generally demonstrating good agreement with experimental data where it is available (Rigby et al., 2018; Shin et al., 2014a; Whittaker et al., 2019). Despite research into near-field blast loading currently being hampered by a lack of well-controlled experimental validation data (Tyas, 2019), FE/CFD analyses can provide data at considerably higher spatial and temporal resolution than experimental studies and are therefore suitable tools with which to develop a refined predictive approach. However, physics-based models have a relatively high computational demand, and are unsuitable for probabilistic, risk-based analyses.
An outstanding challenge for the blast protection community is the provision of techniques for predicting near-field specific impulse distributions in a way which is both accurate and computationally inexpensive. An appropriate technique, which is adopted in the current study, is to use validated CFD analyses to create a dataset from which a predictive method can be developed. This process, known as data-driven surrogate modelling, is widely used in the field of computational dynamics, for example, Loy et al. (2017), Both et al. (2019), but has not yet been successfully applied in the field of near-field blast load prediction.
In this article, a regression analysis is performed on normalised specific impulse curves and a new predictive equation is derived, given by the product of a power law and Gaussian function. The results and equations are presented as scaled parameters for a range of near-field scaled distances, allowing the method to be used for any sized explosive charge. The accuracy of this new approach is rigorously tested against the existing CFD dataset, unseen CFD analyses and available experimental data from the literature. It is demonstrated that localised peak specific impulse and area-integrated total impulse (for a range of target sizes) are typically predicted to within 10%.
Numerical modelling
APOLLO Blastsimulator
Numerical analyses were performed using APOLLO Blastsimulator (hereafter shortened to Apollo), an explicit CFD software specialising in the simulation of dynamic flow problems; focussing on detonations, blast waves and gas dynamic (Fraunhofer, 2018). Apollo solves the conservation equations for transient flows of compressible, inviscid and non-heat conducting, inert or chemically reacting fluid mixtures. The HLL-type Reimann solver is particularly suited for problems involving rapid changes in pressure and density, and high speed flows, and is second order accurate owing to the tri-linear reconstruction of cell-centred conservative variables.
Apollo is equipped with an inbuilt dynamic mesh adaptation (DMA) strategy, as well as a 1D solver, 1D-to-3D mapping and 3D-to-3D staged mapping (see Figure 1). The user specifies a ‘zone length’,
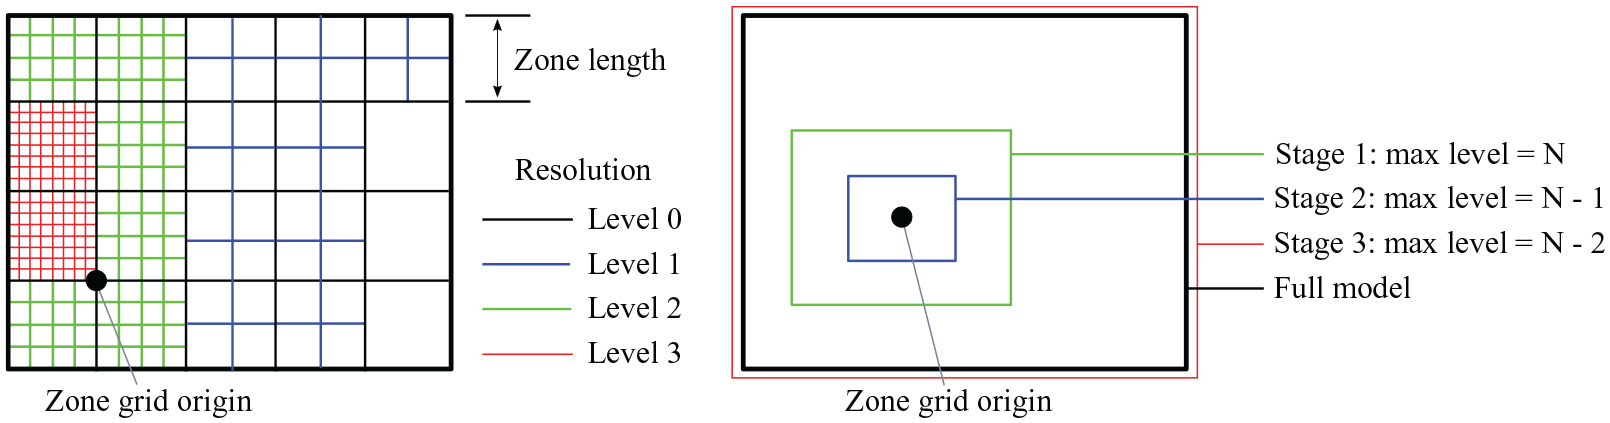
Schematic of the dynamic meshing strategy in Apollo, with zone length, resolution levels and model stages indicated.
DMA is used to locally refine specific areas of the domain which require a finer spatial resolution, for example, those elements which comprise, and are close to, the shock front, or elements at the interface between ambient air and embedded objects. Levels are adapted automatically based on the time-dependent, zone-specific gradients of pressure, temperature, density, Mach number and concentrations (Klomfass, 2018). This has the benefit of directing computational resource appropriately whilst reducing demand in areas of the mesh where it is not needed. Additionally, staged mapping can be used to define a series of computational sub-domains (or ‘stages’) with increased mesh resolution. The analysis will transition from one stage to the next once a pre-defined condition has been met, typically relating to the position of the shock front. Finally, Apollo has the option to progressively expand a computational domain according to a pre-defined velocity-time function (e.g. the rate of expansion of a freely expanding spherical blast wave), however this is not usually required for close-in detonations.
PE4 is a plastic explosive comprising 87% RDX and 13% mineral oil binder (Tyas, 2019). The explosives were modelled as 100 g PE4 spheres throughout the mesh sensitivity study, validation, and data harvesting aspect of this study, using Apollo’s in-built model for C4 explosive, as the two explosives are of nominally identical composition (Bogosian et al., 2016). The pressure-density-temperature relationship of the post-detonation explosive products is given by the Jones Wilkins Lee equation of state (Lee et al., 1968):

where
Mesh sensitivity and validation
Mesh sensitivity analysis
Prior to validating Apollo results against available experimental data, a mesh sensitivity study was conducted with the aims of determining the required element size to achieve convergence and identifying suitable combinations of zone length and resolution level.
A series of simulations were run for a 100 g PE4 sphere (24.3 mm radius) located at a stand-off distance,
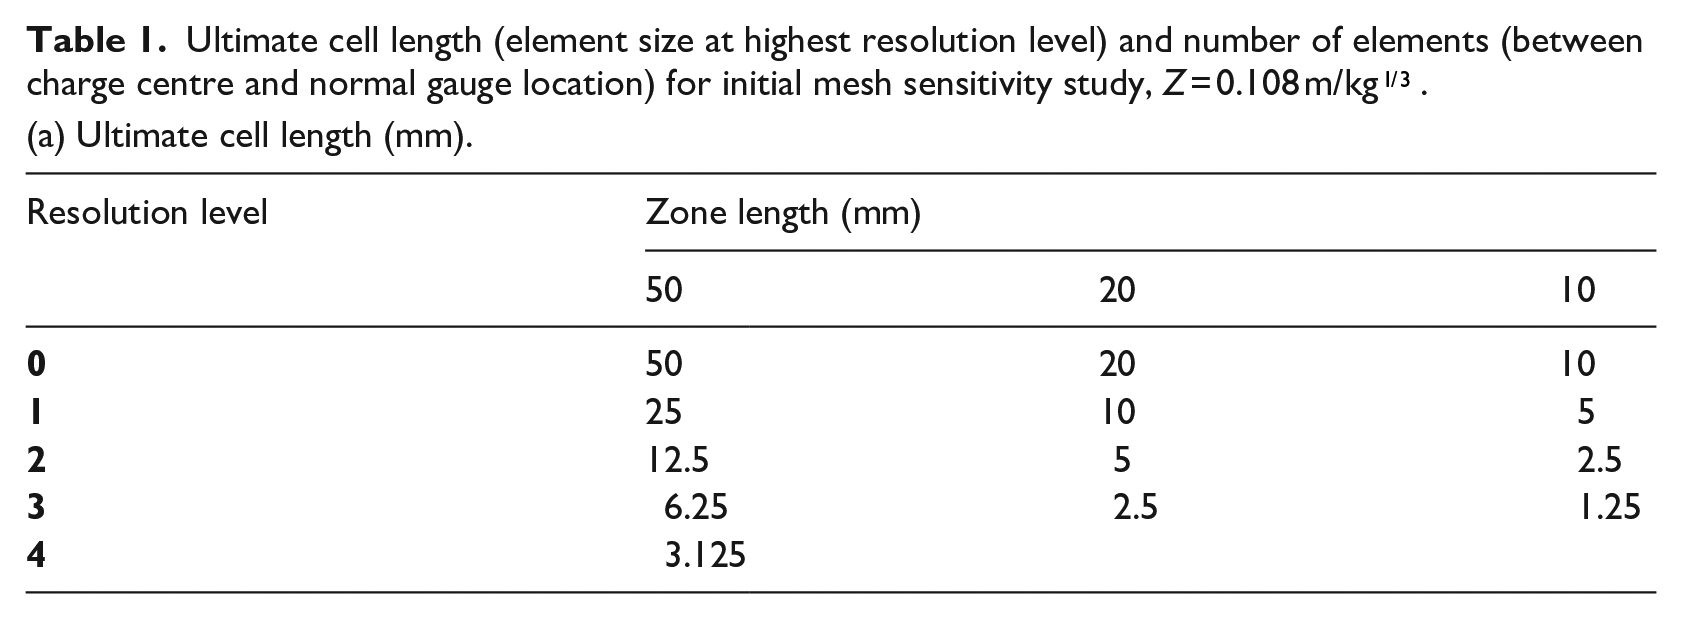
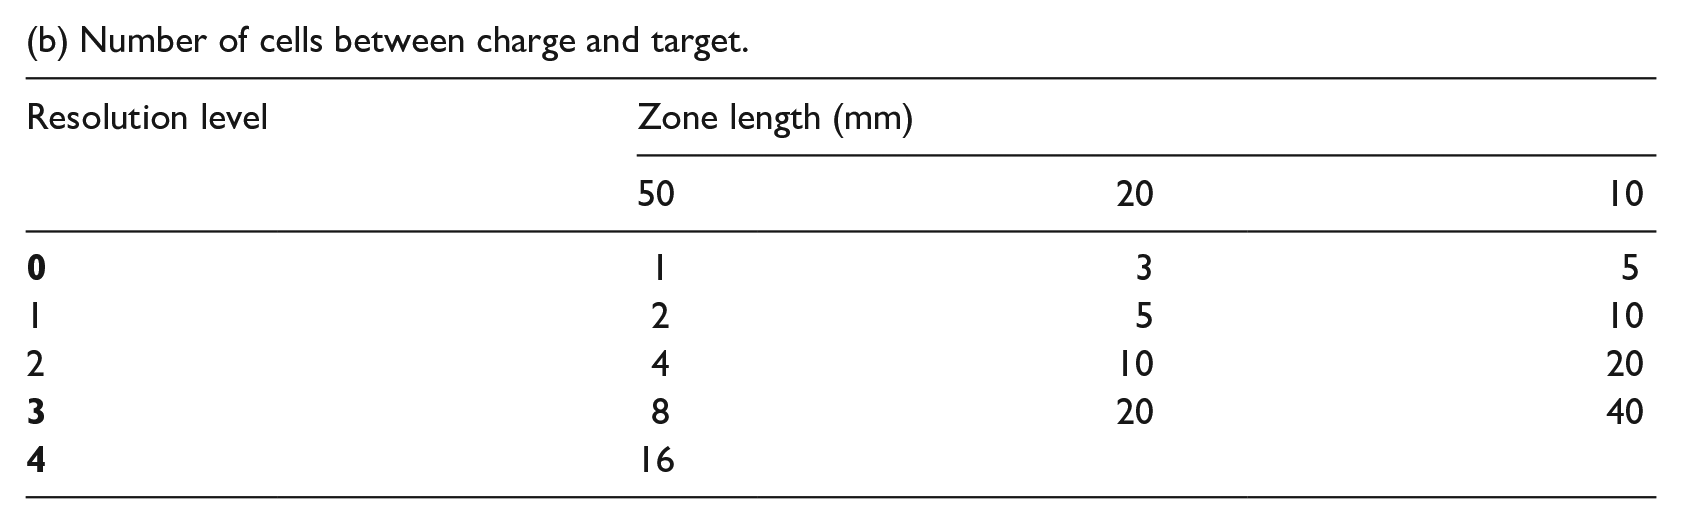
Ultimate cell length (element size at highest resolution level) and number of elements (between charge centre and normal gauge location) for initial mesh sensitivity study, Z = 0.108
(a) Ultimate cell length (mm).
(b) Number of cells between charge and target.
Results from the mesh sensitivity analysis are shown in Figure 2, where each sub-figure shows: peak specific impulse for the normal gauge; area-integrated impulse out to a radius of 0.28 m from the normal gauge; and total analysis time (termed ‘wall time’ in Apollo), all plotted against the ratio of stand-off distance to ultimate cell length. The results suggest that an ultimate cell length of
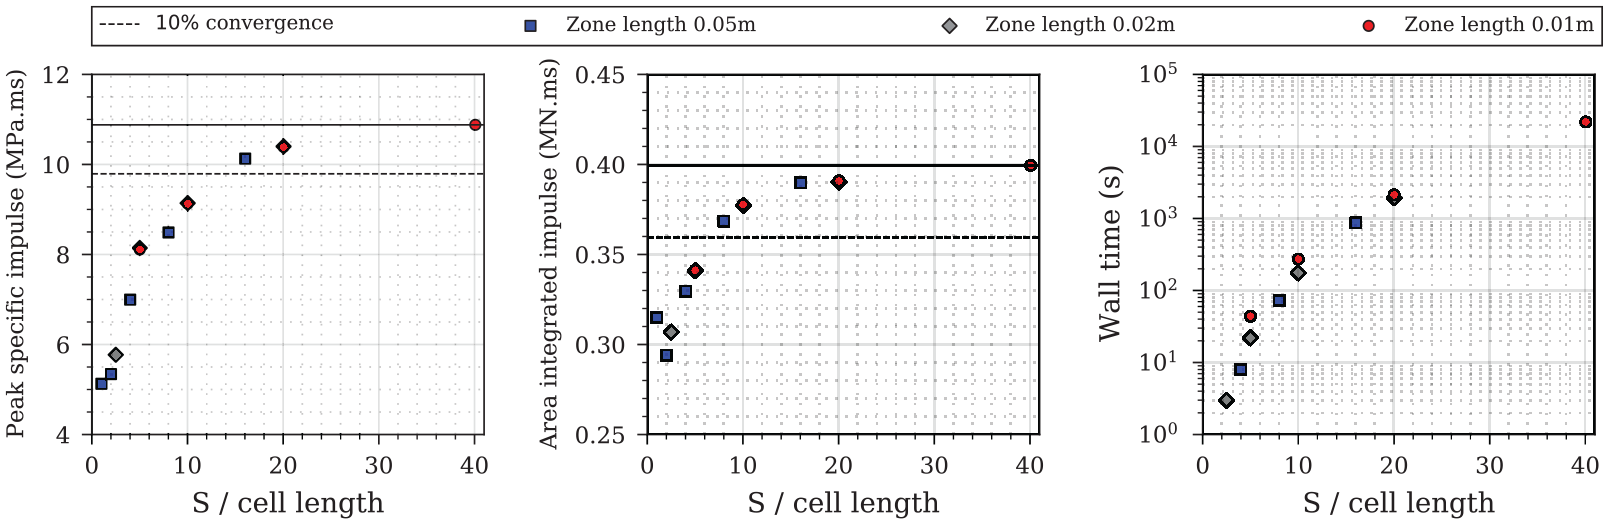
Mesh convergence study for
Experimental validation
The Characterisation of Blast Loading apparatus (Clarke et al., 2015) was designed to measure spatial and temporal distribution of loading from buried (Rigby et al., 2016) and free air explosions (Rigby et al., 2015a). The apparatus utilises two perpendicular arrays of Hopkinson (1914) pressure bars (HPBs), mounted such that their faces lie flush with the underside of a large (100 mm thick, 1400 mm diameter) steel plate, which acts as a nominally rigid reflecting surface under which the explosive charges are detonated. 17 HPBs are used in total: one bar is located directly above the charge (which itself is aligned with the centre of the target plate); and four bars are located at each distance of 25 mm, 50 mm, 75 mm and 100 mm from the centre. Numerical integration of the recorded pressure signals enables peak specific impulse distributions over the central 200 mm diameter region of the target to be generated. Two different configurations were used to validate Apollo: 100 g PE4 spheres were used throughout, with three tests at 80 mm stand-off (Rigby et al., 2019a) and three tests at 380 mm stand-off (Rigby et al., 2020), corresponding to scaled distances of 0.172
Apollo models were run with 50 mm zone length and resolution level of 4 as informed by findings from the mesh sensitivity analysis. The reflecting surface was modelled as a rigid wall and quarter symmetry was used as before. The domain was extended to
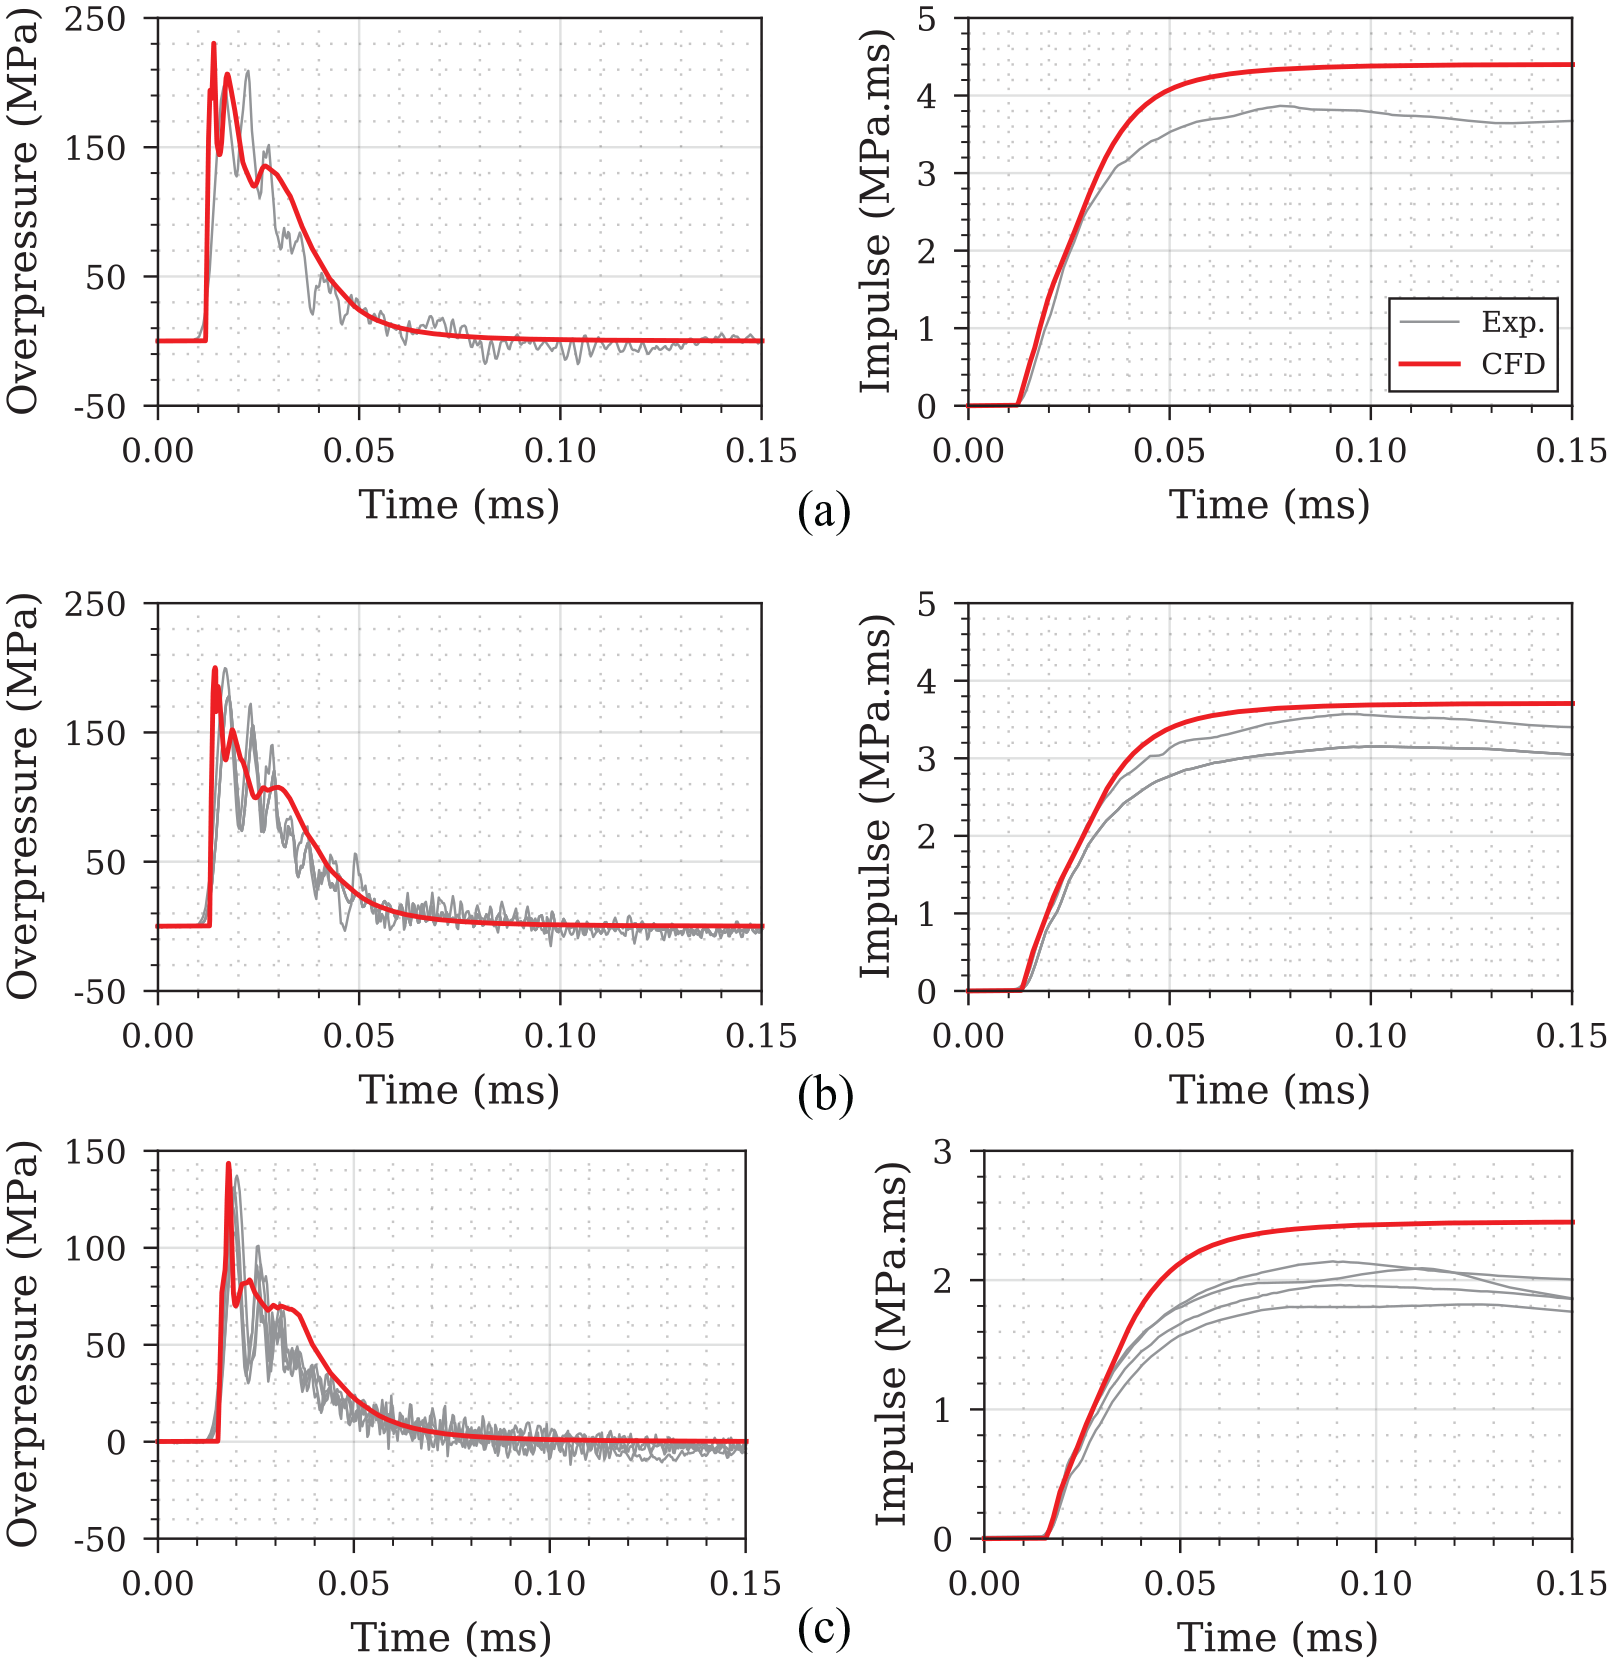
Experimental validation of numerical overpressure and specific impulse histories for
Additionally, Figure 4 shows compiled peak specific impulse distributions for the 80 mm stand-off and 380 mm stand-off tests with the CFD data evaluated at 0.4° increments of angle of incidence. Also shown are the mean experimental recordings at each measurement location for ease of comparison (three data points at the target centre and 12 data points at each other distance from the centre). Again, the numerical results closely match the experimental data, in both form and magnitude, although the results appear to be in better agreement with the upper bound of the experimental results. Deriving a model based on Apollo CFD results will therefore have a slight inbuilt conservatism, however this is still representative of the typical variations seen in blast loading from close-in detonations, as exhibited here.
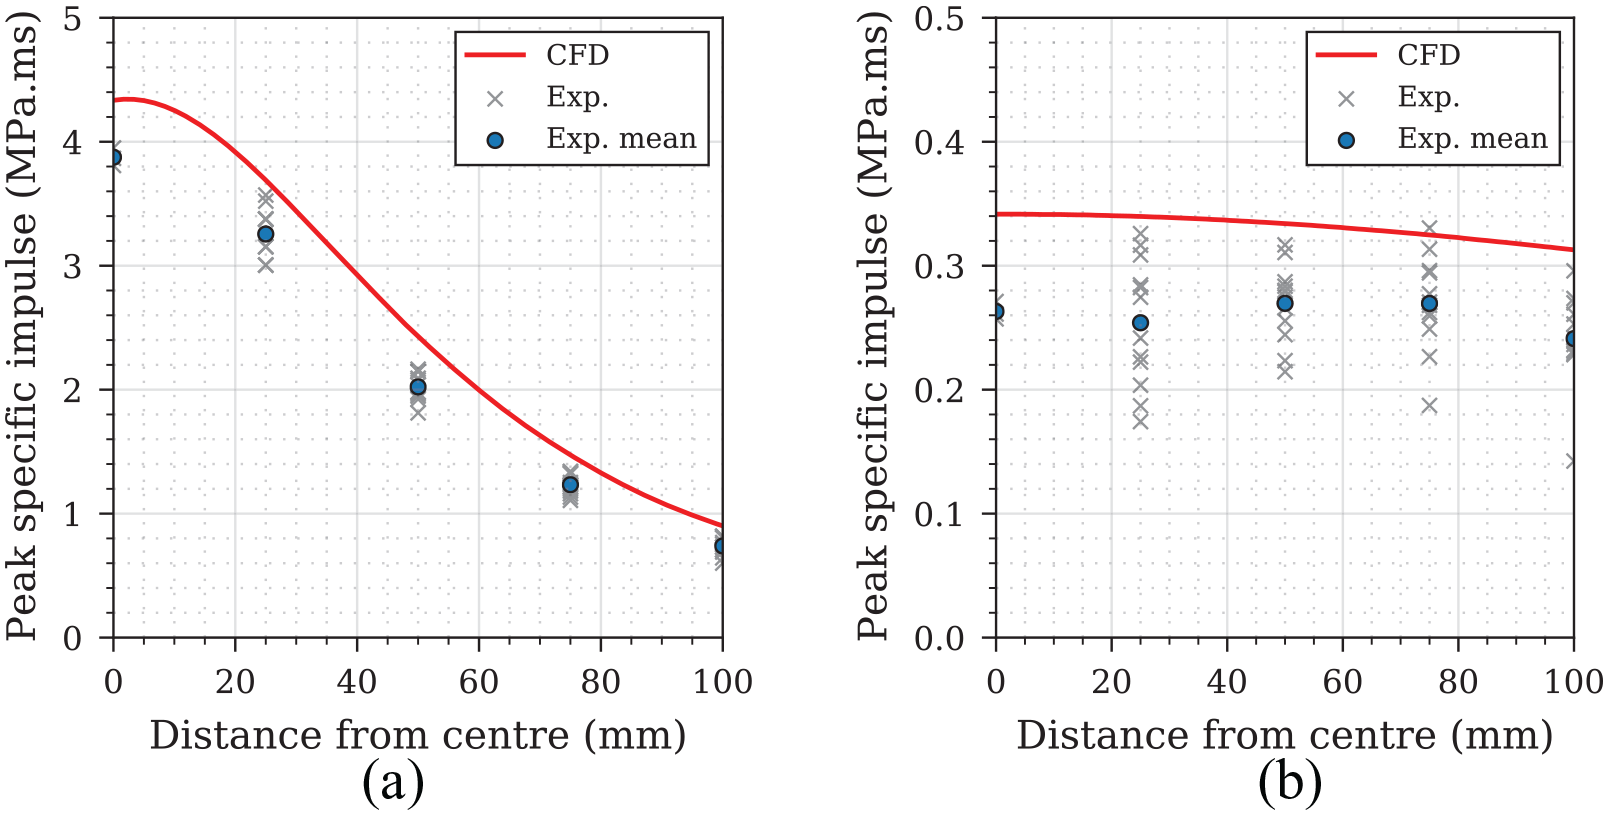
Experimental validation of numerical specific impulse distributions at 0–100 mm distance from the target centre: (a) 80 mm stand-off,
Generation of dataset
Apollo was used to generate specific impulse distributions along a rigid reflecting surface, at angles of incidence between 0–80°, with 200 numerical gauges placed at regular increments of angle of incidence as per the validation exercise. The analyses were formed into two groupings. Firstly, an initial dataset was generated for extreme near-field conditions, 0.11–0.21
The dataset was then expanded to incorporate intermediate near-field conditions, with analyses run between 0.24–0.55
CFD results are shown in detail in Figure 5 for the reduced and full datasets. Here, a Savitzky-Golay filter (Savitzky and Golay, 1964) has been applied to the specific impulse distributions to remove small spurious oscillations induced by DMA, which were more apparent in the analyses at larger scaled distances. The Savitzky-Golay filter is a low-pass data-smoothing method based on local least-squares polynomial approximation, and is particularly suited for removing high frequency noise with the advantage of preserving the original shape and features of the signal (Acharya et al., 2016).
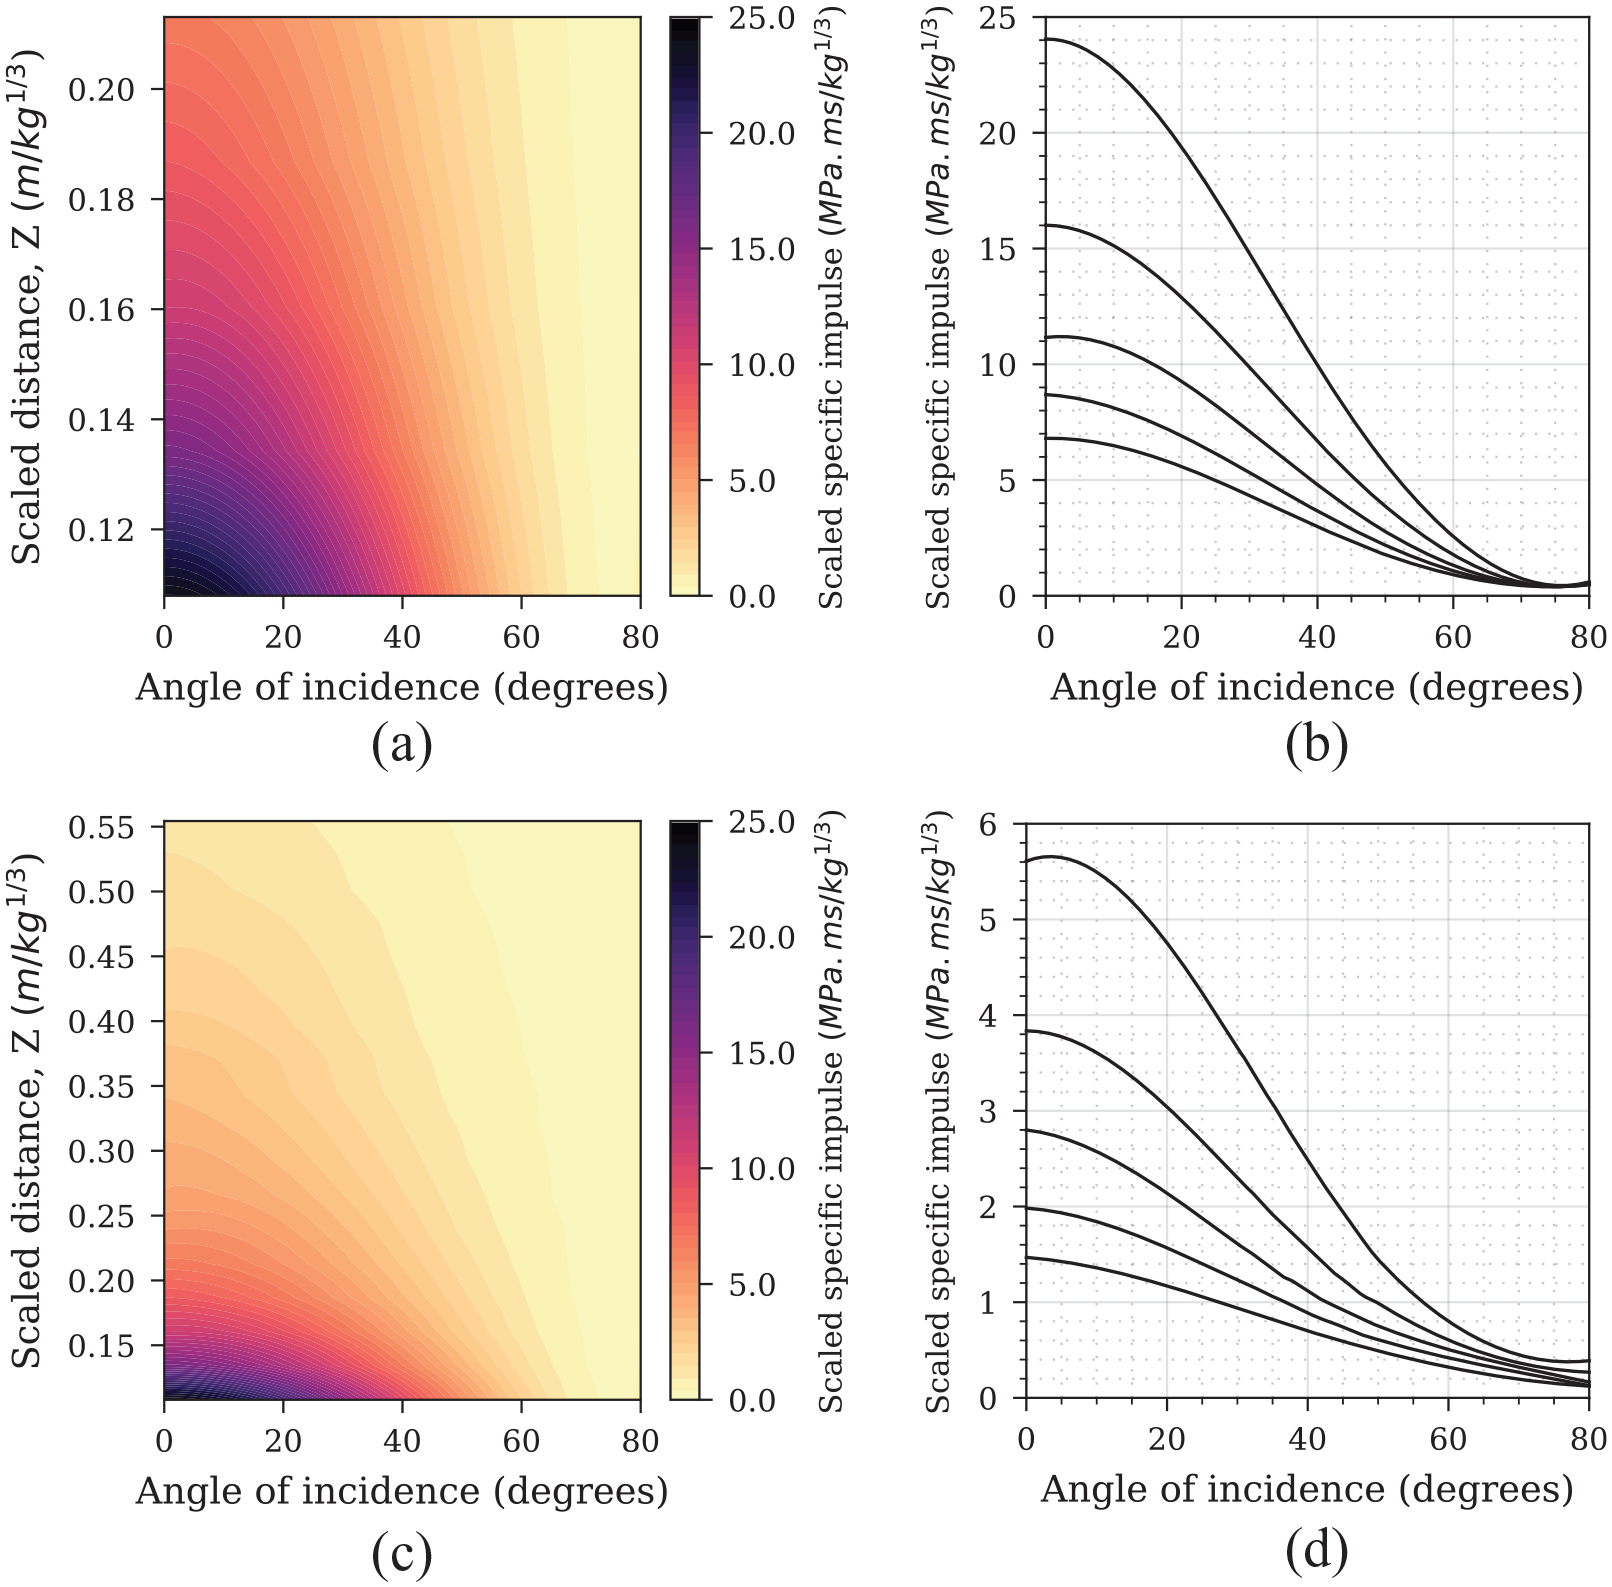
CFD results: (a) filled contours of scaled peak specific impulse for reduced dataset, 0.11–0.21
Development of a data-driven predictive approach
Overview
This section details the development of a data-driven predictive approach for computing near-field specific impulse distributions from spherical PE4 charges. Firstly, the relationship between peak specific impulse and angle of incidence is examined, and three different curve types are trialled to establish the most suitable candidate for representing the spatial variation of loading. Secondly, the relationship between scaled distance and peak specific impulse is considered and a power law fit is determined. The proposed predictive method is given as the product of these two relationships: spatial variation, and variation with scaled distance.
It was noted by Wilson et al. (2018) that ‘further research into analysis scenarios at varying angles of incidence are required . . . at a scaled distance less than 0.16
Spatial variation of normalised impulse
From examination of Figure 5(b) and (d), it appears as though that the relationship between peak specific impulse and angle of incidence is similar for all scaled distances considered in this article. Dividing each through by the respective peak specific impulse at
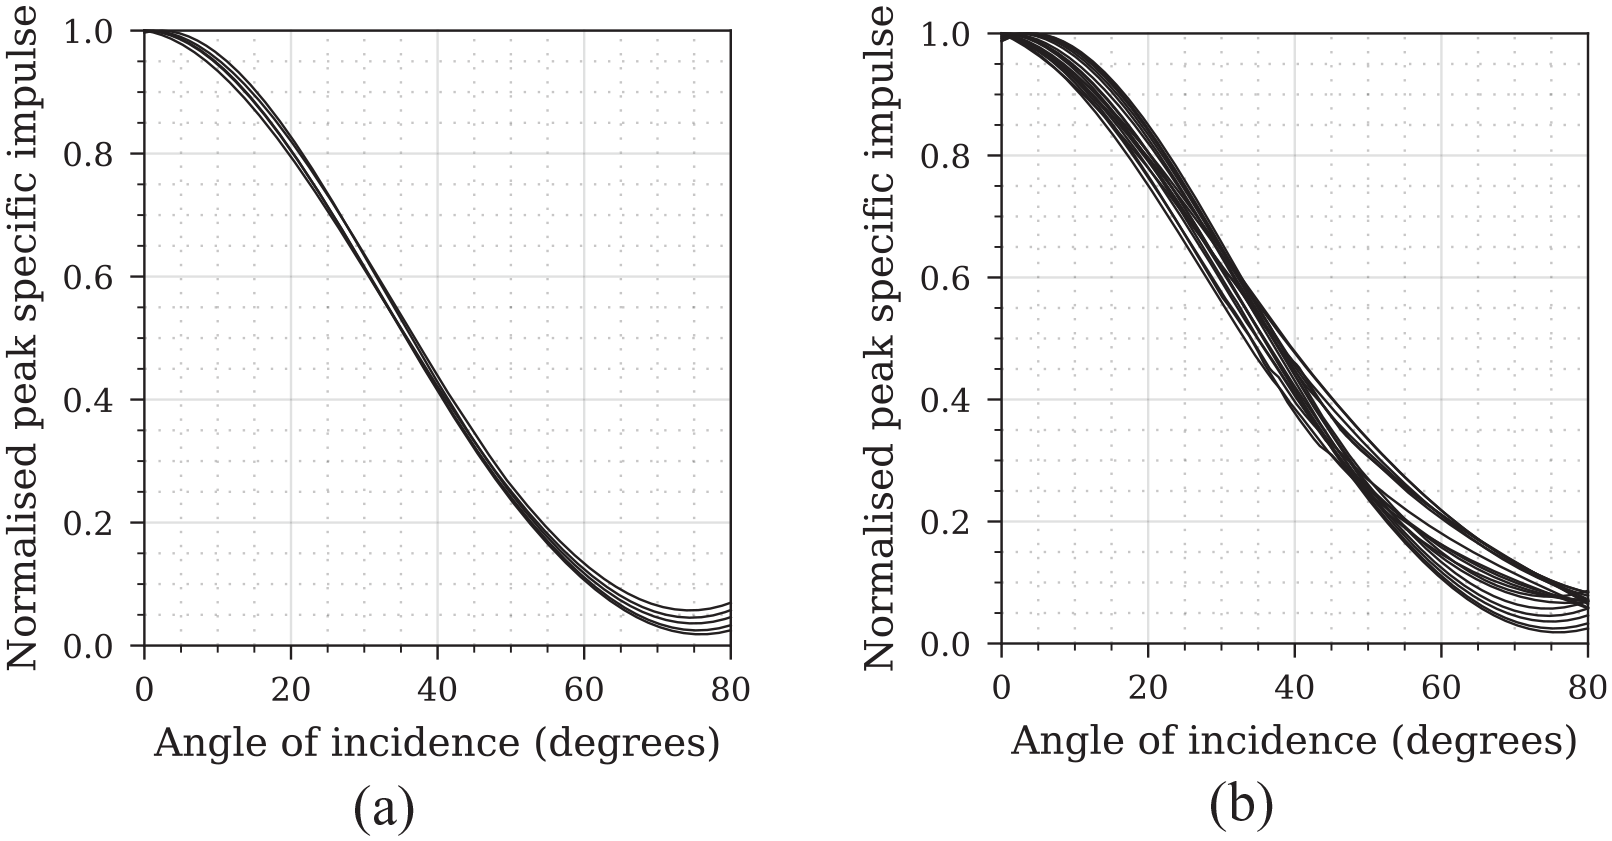
Normalised peak specific impulse distributions: (a) reduced dataset, 0.11–0.21
The semi-analytical work of Henrych (1979), later developed by Remennikov et al. (2017), is based on the model of instantaneous detonation of a spherical explosive and subsequent expansion of the gaseous detonation products into a vacuum. Here the loading is assumed to develop entirely from momentum transferred by the detonation products as they impact the loaded face. With some cancelling of constants, the Henrych (1979) equations can be expressed in normalised form:

where
Randers-Pehrson and Bannister (1997) present a trigonometric expression to account for angle of incidence effects, which after some manipulation can be presented as a function of normalised specific impulse and angle of incidence:

Here,
Finally, Pannell et al. (2019) presented work on using machine learning to fit Gaussian probability density functions to near-field specific impulse distributions. Here, a modified version of the equations as a function of angle of incidence is presented:
where
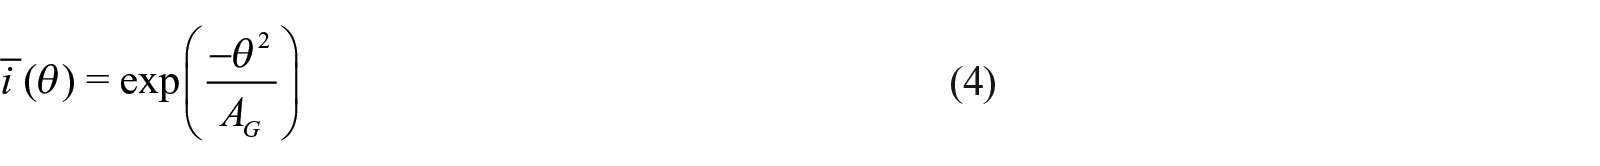
Figure 7 shows an assessment of the quality of fit for each of the normalised predictions compared against the reduced CFD dataset. For the Randers-Pehrson and Bannister (1997) model,
Normalised specific impulse distributions for reduced dataset (0.11–0.21
For the Pannell et al. (2019) Gaussian model,
Also shown in Figure 7 are the model residuals (CFD value minus model prediction), with mean absolute error (MAE) and RMSE provided for each fit against the mean CFD distribution. The Henrych (1979) and Randers-Pehrson and Bannister (1997) trigonometric identities generally under-predict specific impulse for intermediate angles of incidence (which would result in a degree of unconservatism when considering total impulse) whereas the Gaussian function (Figure 7(c)) can be seen to closely match the CFD data for all angles of incidence. The Gaussian model also exhibits the best quantitative agreement when considering both MAE and RMSE and therefore has been selected to represent the spatial distribution of specific impulse in the predictive methodology proposed in this article.
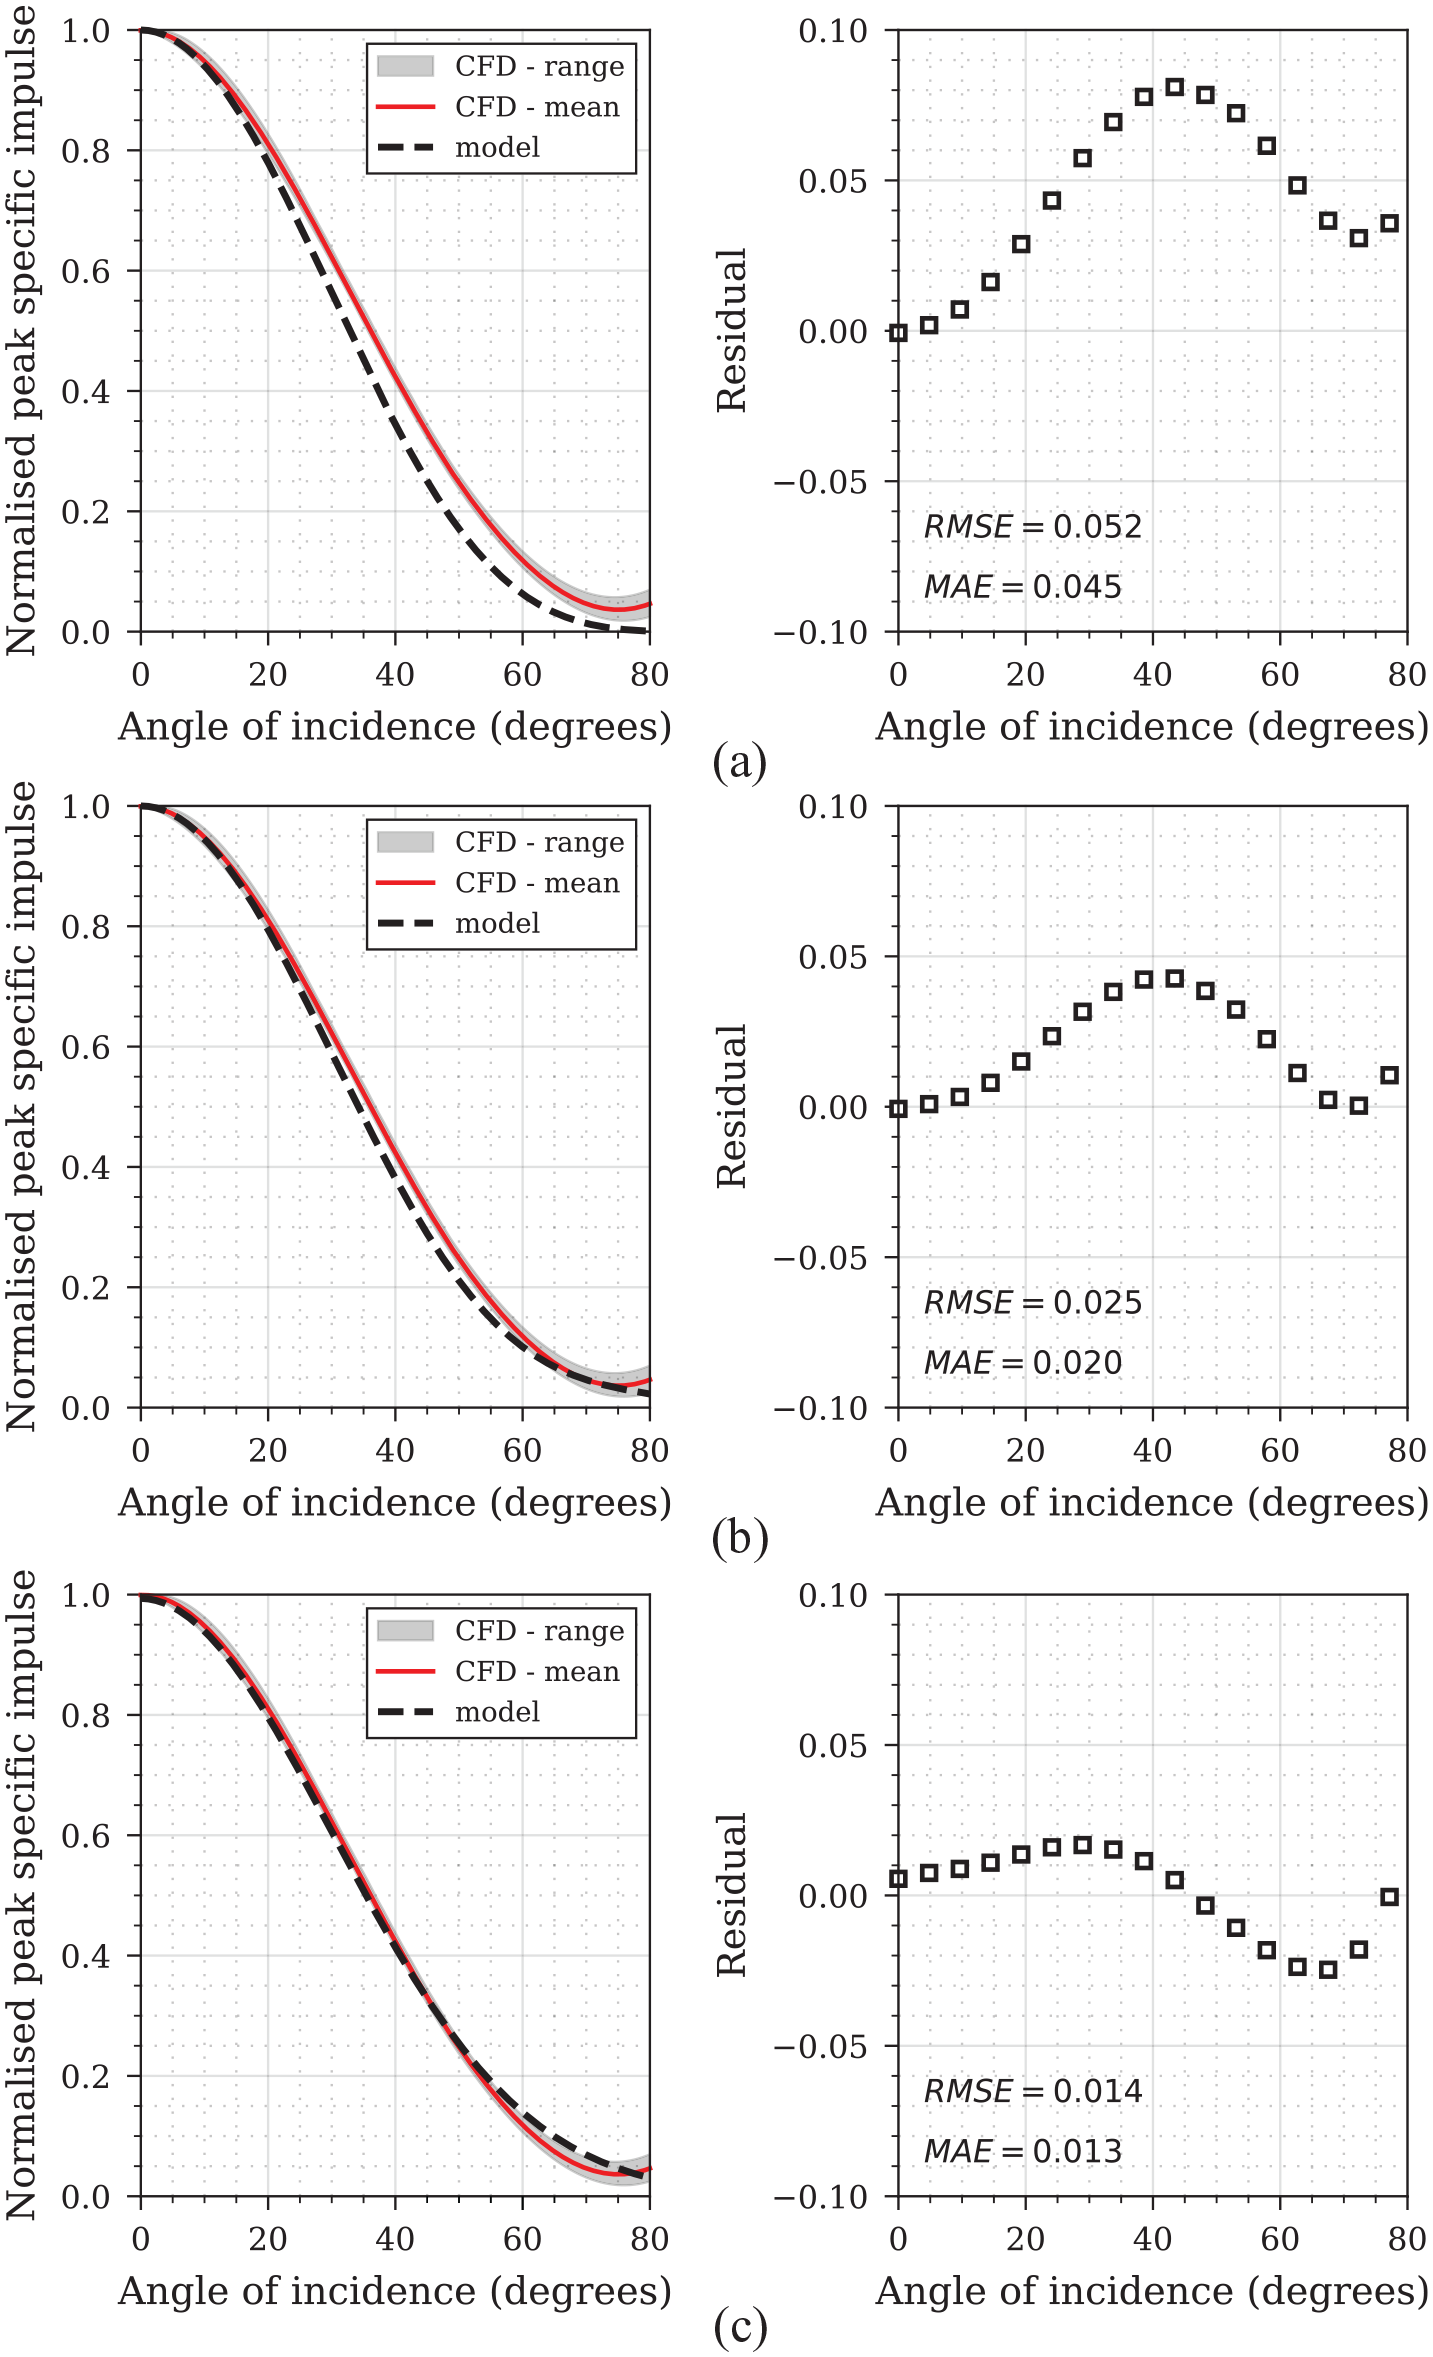
The Gaussian function was subsequently assessed against the full dataset, Figure 8, again with
Normalised specific impulse distributions for full dataset (0.11–0.55
Variation with scaled distance and final models
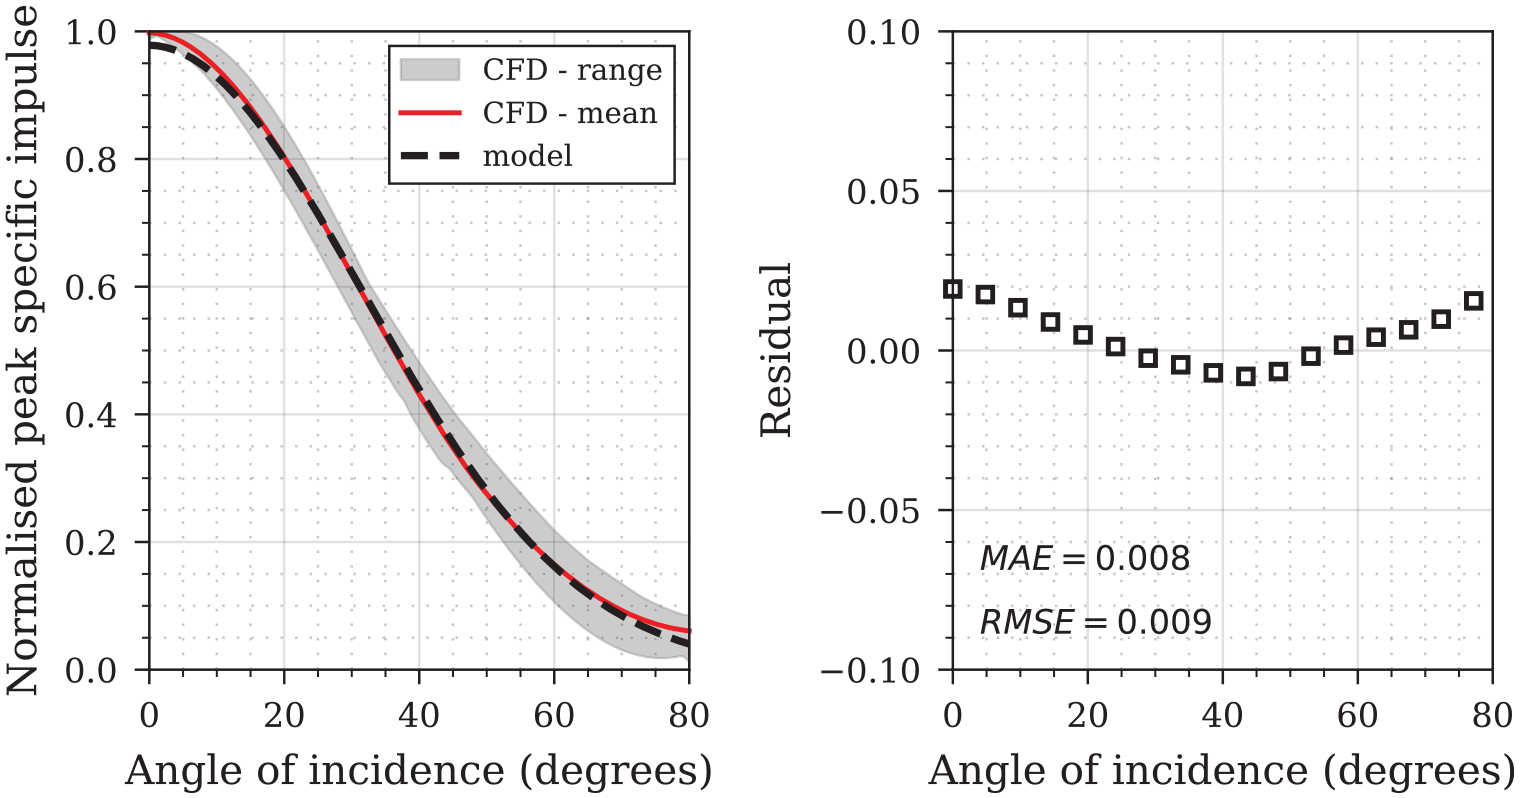
With a method for predicting distribution of normalised peak specific established, it still remains to quantify the variation of peak normally reflected specific impulse with scaled distance. Rather than making use of the existing higher order polynomial expressions of Kingery and Bulmash (1984), Swisdak (1994), or Shin et al. (2014b), the aim here is to develop a simple equation with a small number of coefficients over a more focussed range of scaled distances. Accordingly, the relationship between scaled distance and peak normally reflected specific impulse (i.e. the peak specific impulse at
Relationship between peak normally reflected specific impulse and scaled distance, residuals and proposed fit: (a) reduced dataset, 0.11–0.21
Accordingly, the derived relationship for specific impulse, scaled using Hopkinson (1915) and Cranz (1926) scaling to express the relations as a function of charge mass,
for 0.11 ≤ Z ≤ 0.21 m/kg1/3, and:
for 0.11 ≤ Z ≤ 0.55 m/kg1/3, where both expressions return specific impulse in units of MPa.ms.
Assessment of proposed method
Evaluation against numerical dataset
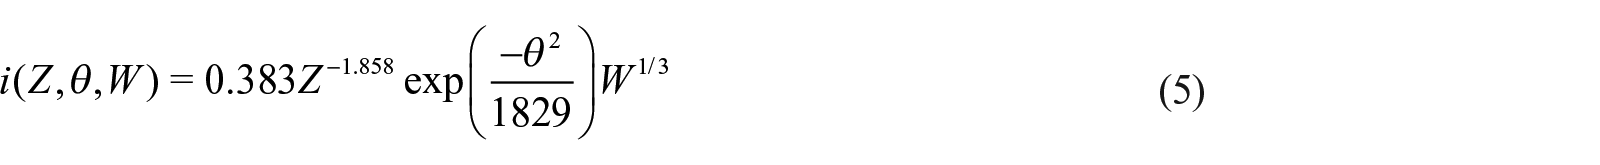
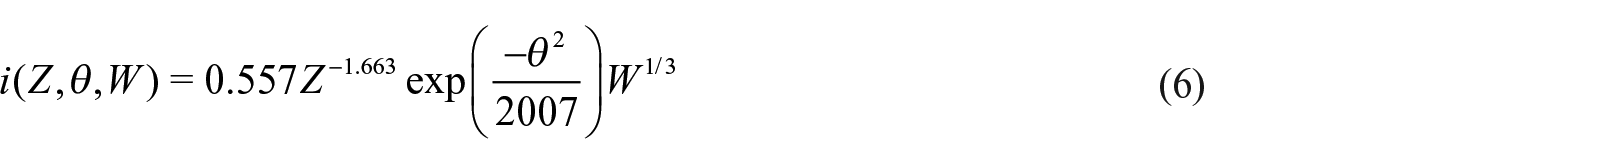
This section presents a rigorous assessment of the quality of the proposed predictive method by comparing the results against the full CFD dataset. Equations (5) and (6) were solved for
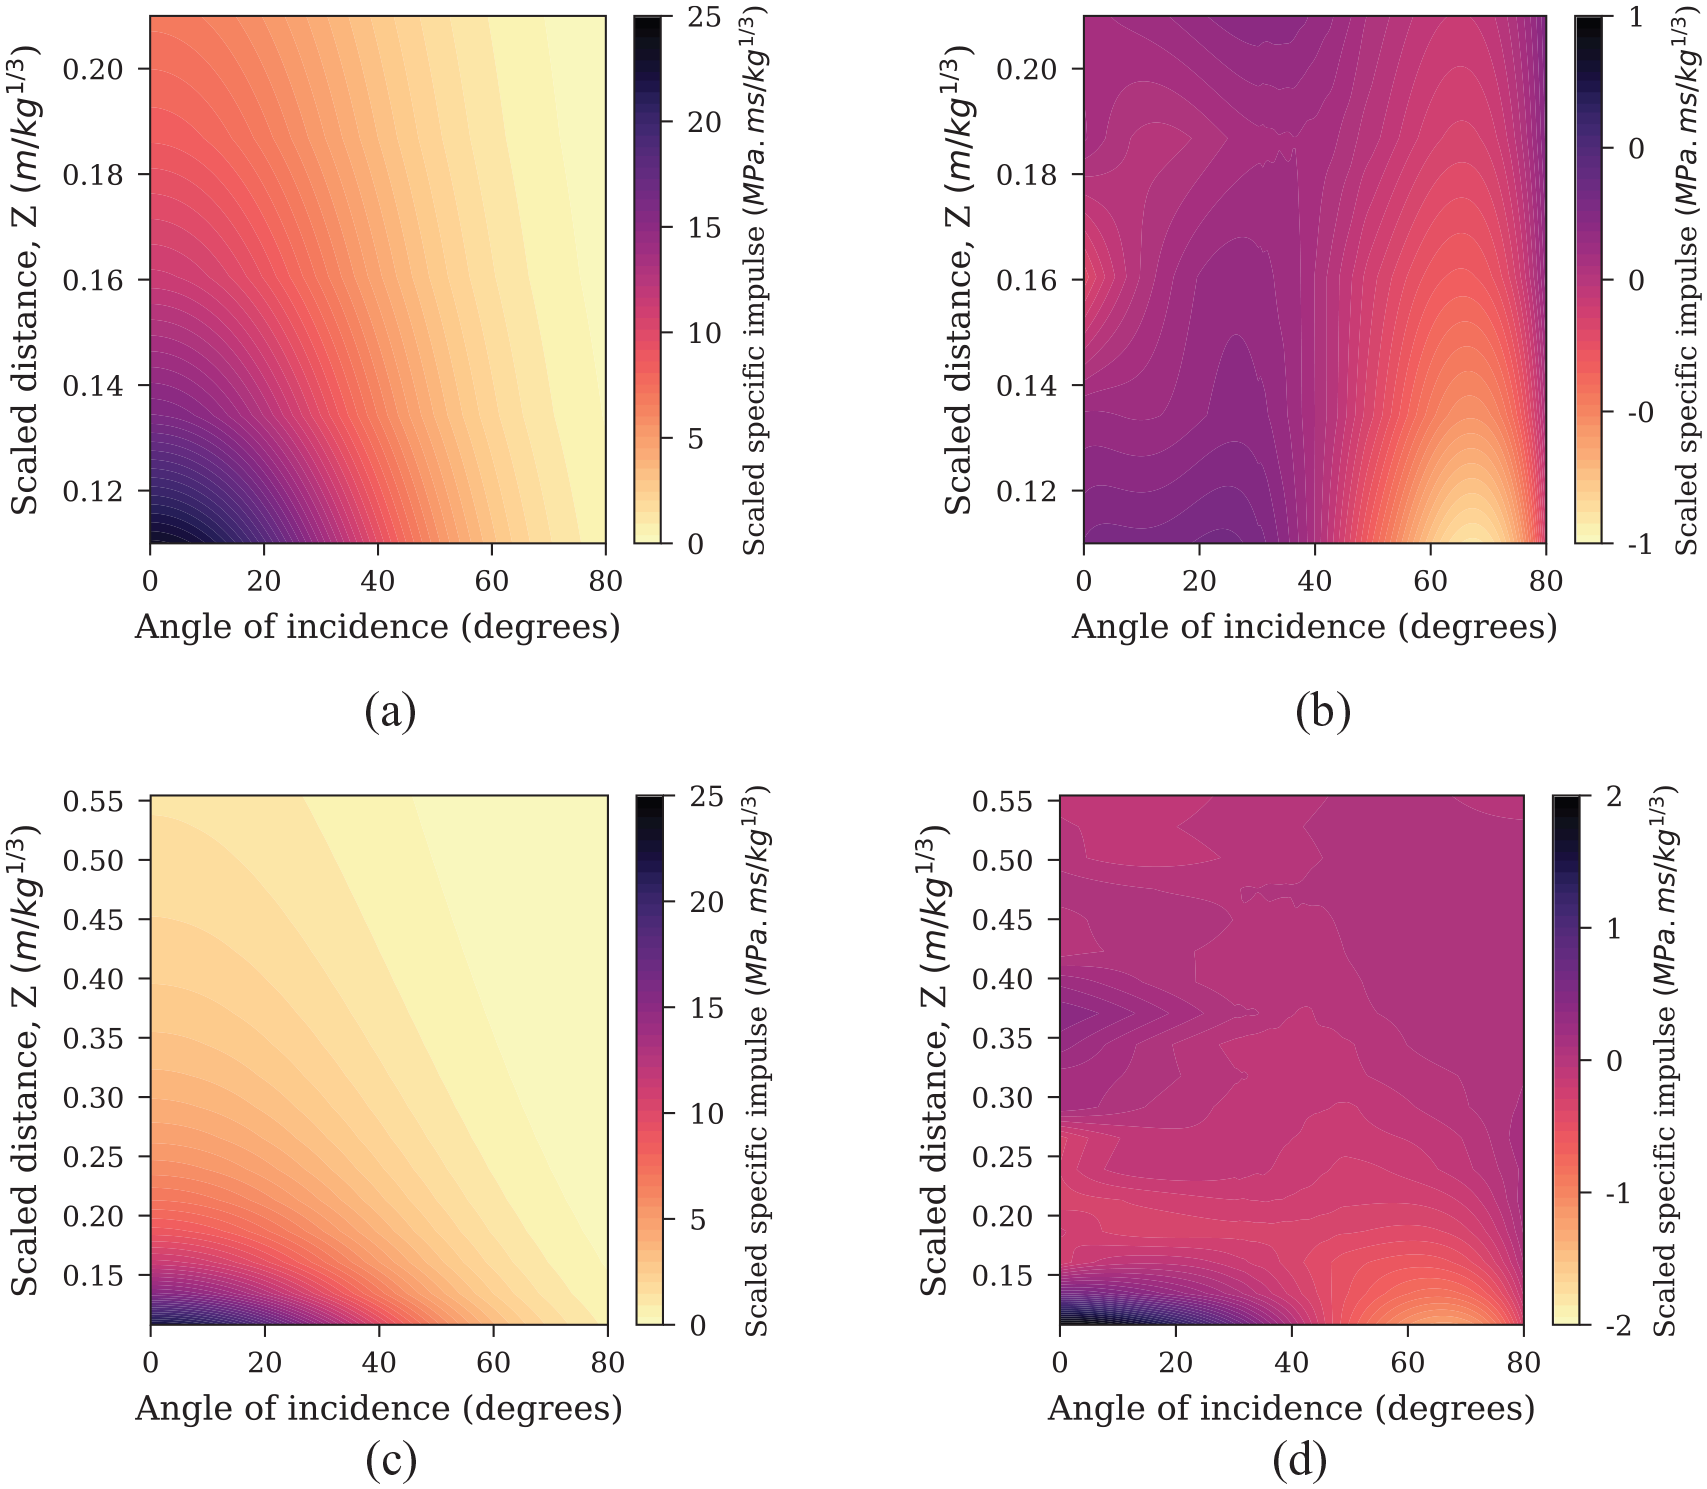
Predicted specific impulse distributions: (a) filled contours of scaled peak specific impulse for reduced dataset, 0.11–0.21
It can be seen that the residuals are generally positive, particularly for the reduced dataset. This is acceptable given the slight conservatism shown in the CFD data itself (see Figure 4). The predictions for the full dataset show slight under-predictions for small scaled distances and
Whilst knowledge of the distributed specific impulse is a key requirement for determining structural response (Rigby et al., 2019b), total impulse (integral of specific impulse with respect to area, often termed ‘area-integrated’ impulse) is a useful metric particularly when considering global momentum transfer. Equations (5) and (6) were numerically integrated with respect to area for scaled target radii of 0.10, 0.25, 0.50 and 1.00
Comparison of total area-integrated impulse from numerical integration of CFD data and predicted peak specific impulse distributions for various scaled target radii.
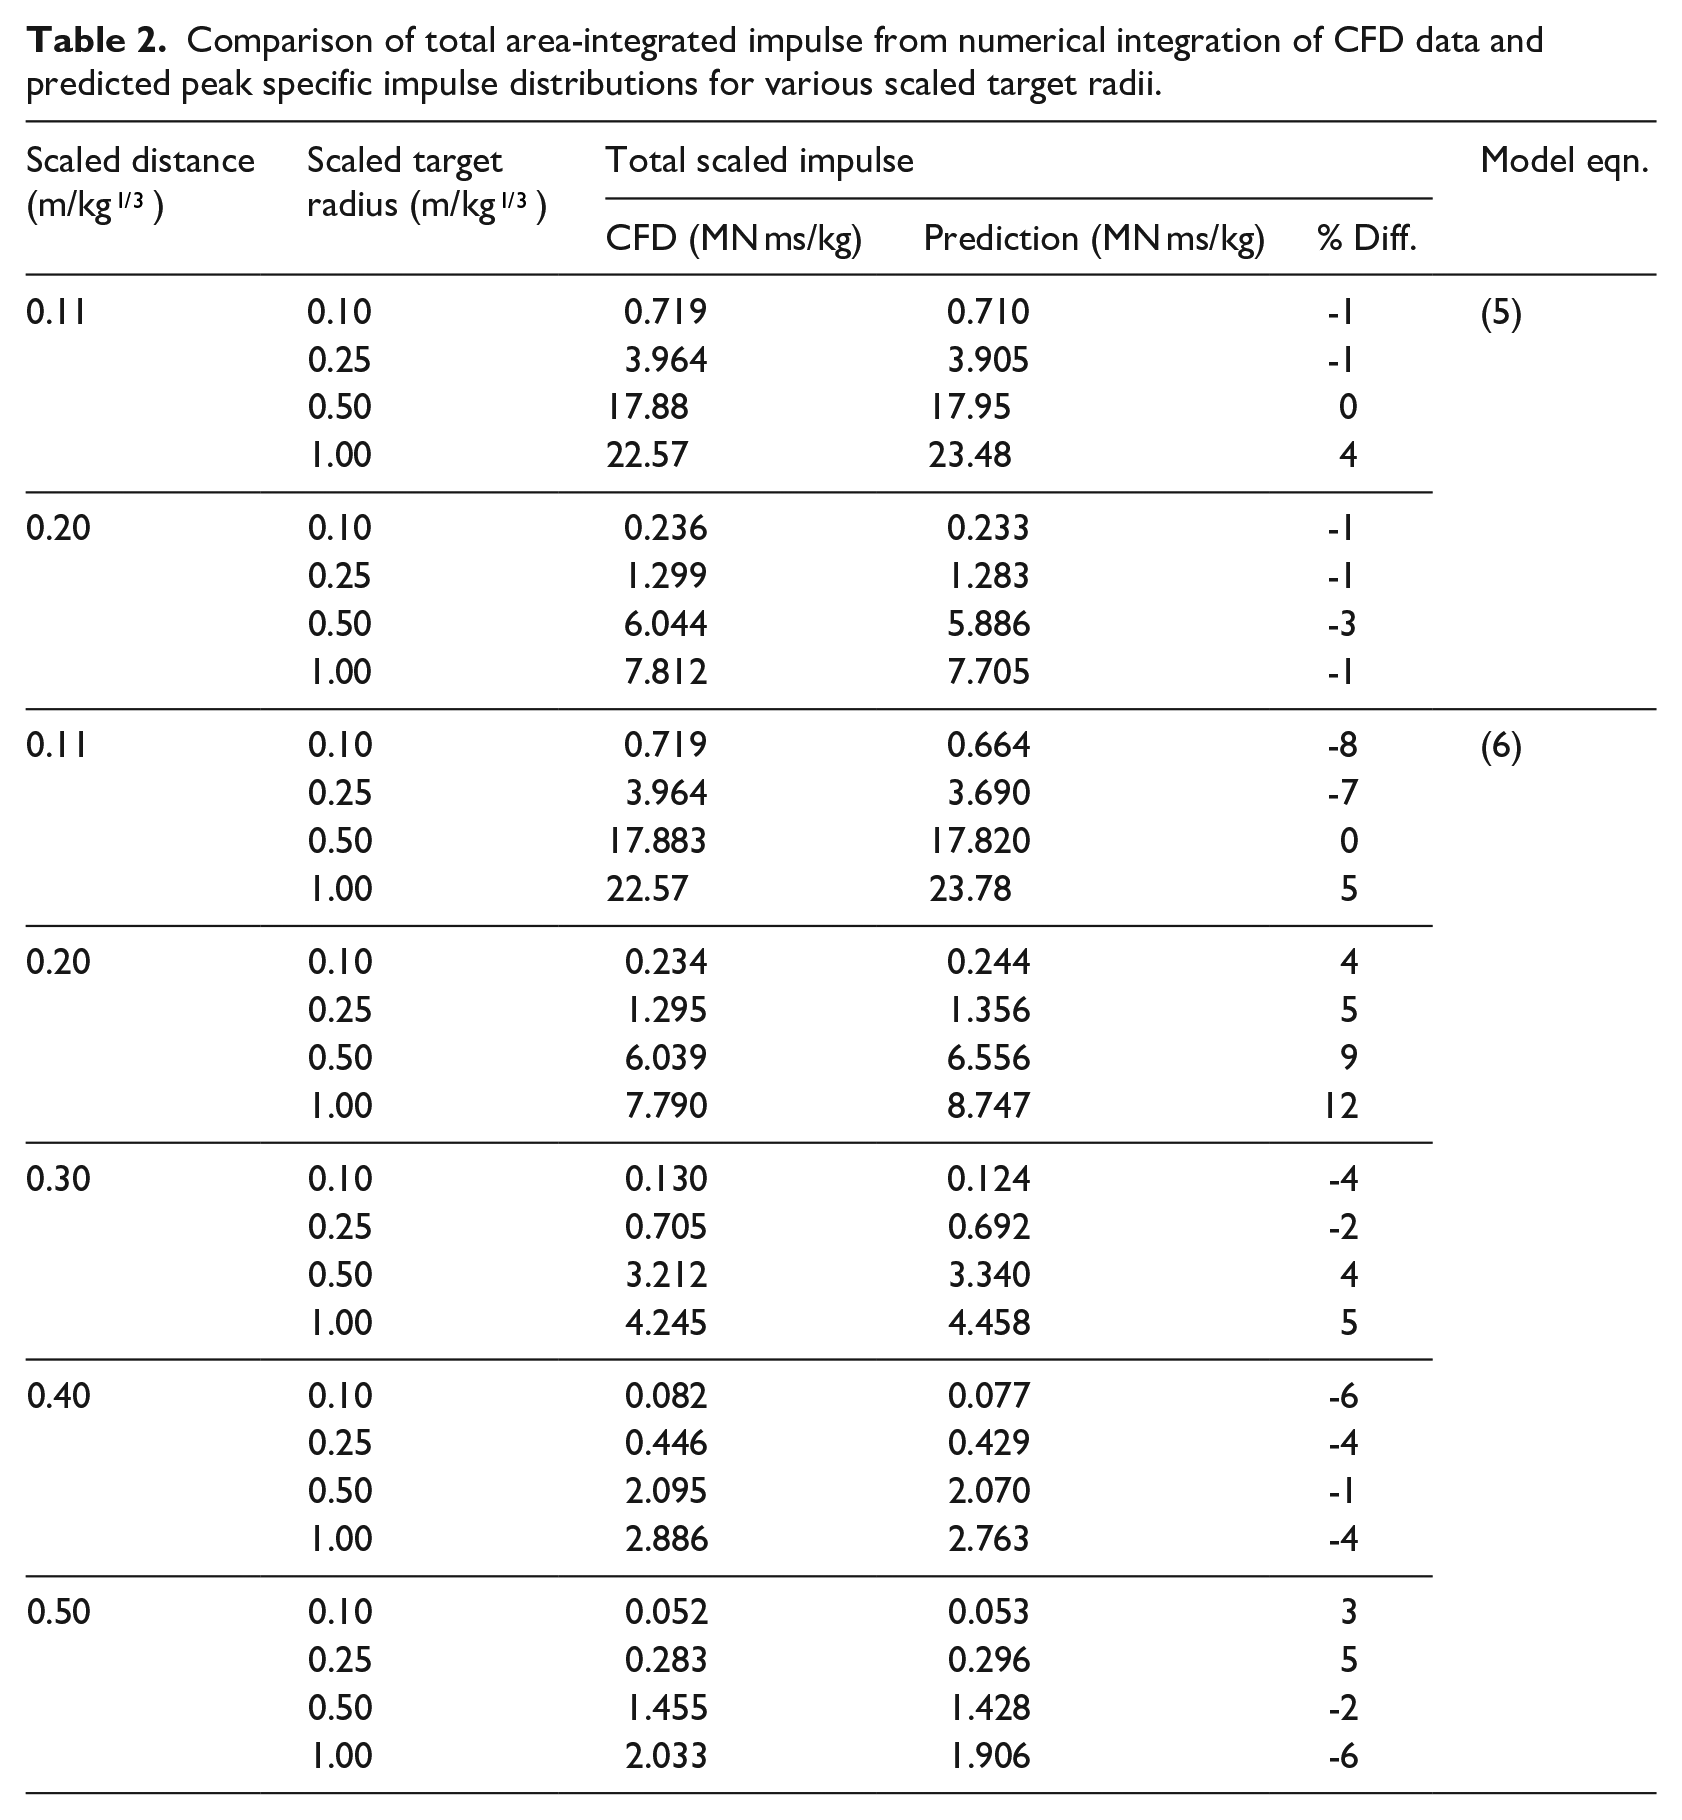
Generally the predictions are in excellent agreement with the CFD results, particularly for Z ≤ 0.20 m/kg1/3 when using equation (5), where the maximum deviation is 4% from the CFD data and the typical deviation is ± 1%. When the relationship in equation (6) is used to calculate total impulse for Z ≤ 0.20 m/kg1/3 the results are less accurate, with a maximum deviation of 12% from the CFD data. However, when equation (6) is used to make predictions for
Comparison against unseen CFD data
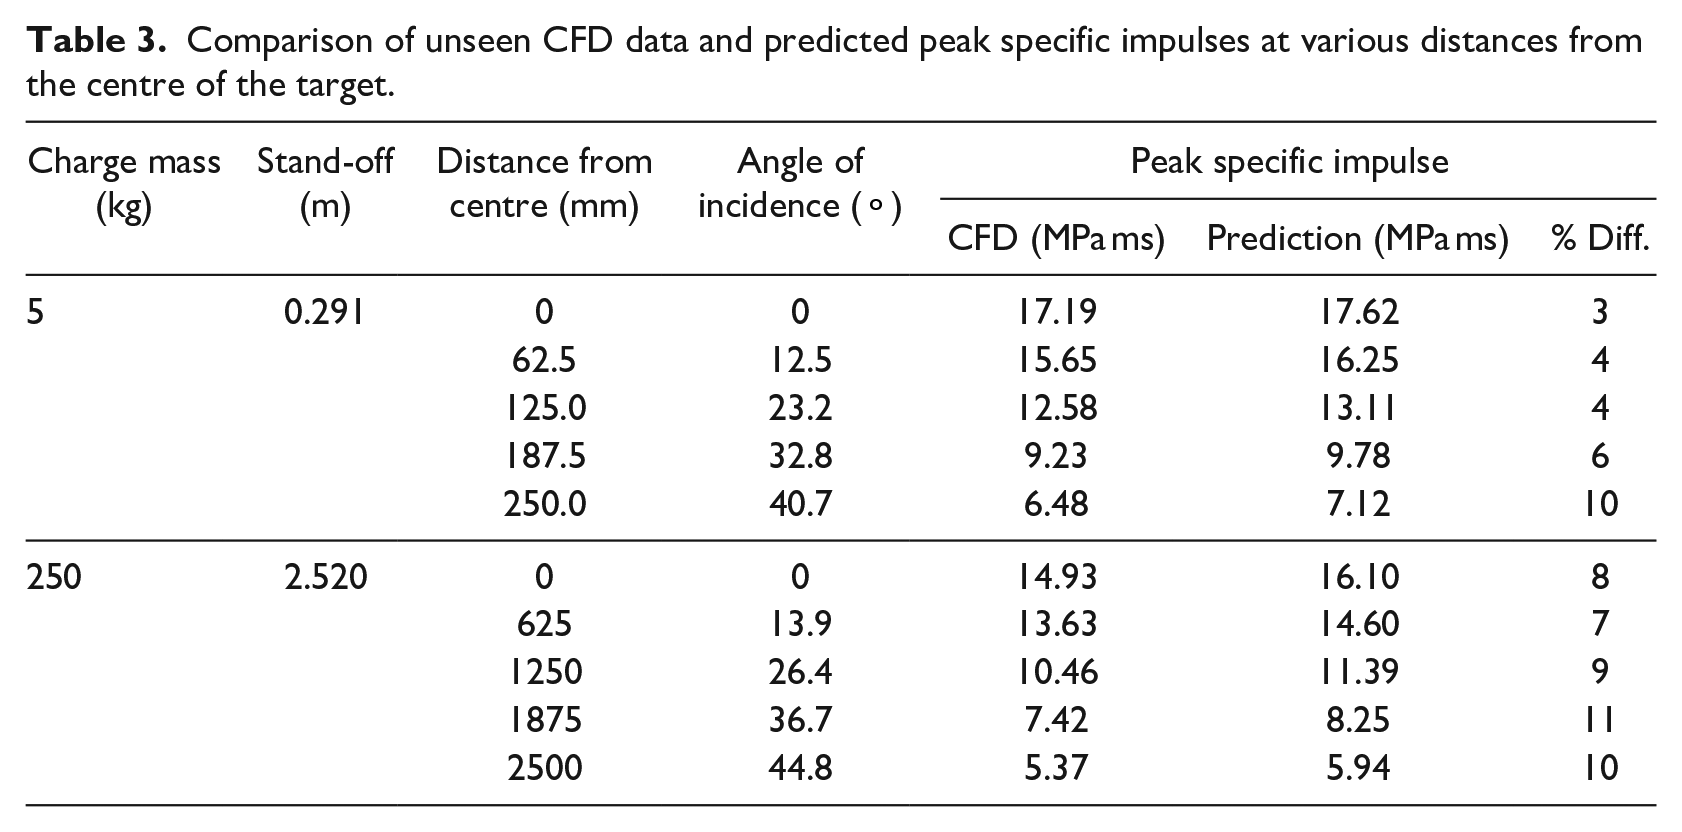
The predictive model was compared against two sets of unseen CFD data (i.e. data not used in the development of the predictive model). The first set comprises two models: a 5 kg spherical PE4 charge detonated at 0.291 m normal stand-off distance (to charge centre) from a rigid surface (
Figure 11 shows a comparison of the CFD and predicted specific impulse distributions out to 0.25 m and 2.50 m from the target centre, with select values presented in Table 3 alongside percentage differences between CFD and predicted values. Here, predictions for the
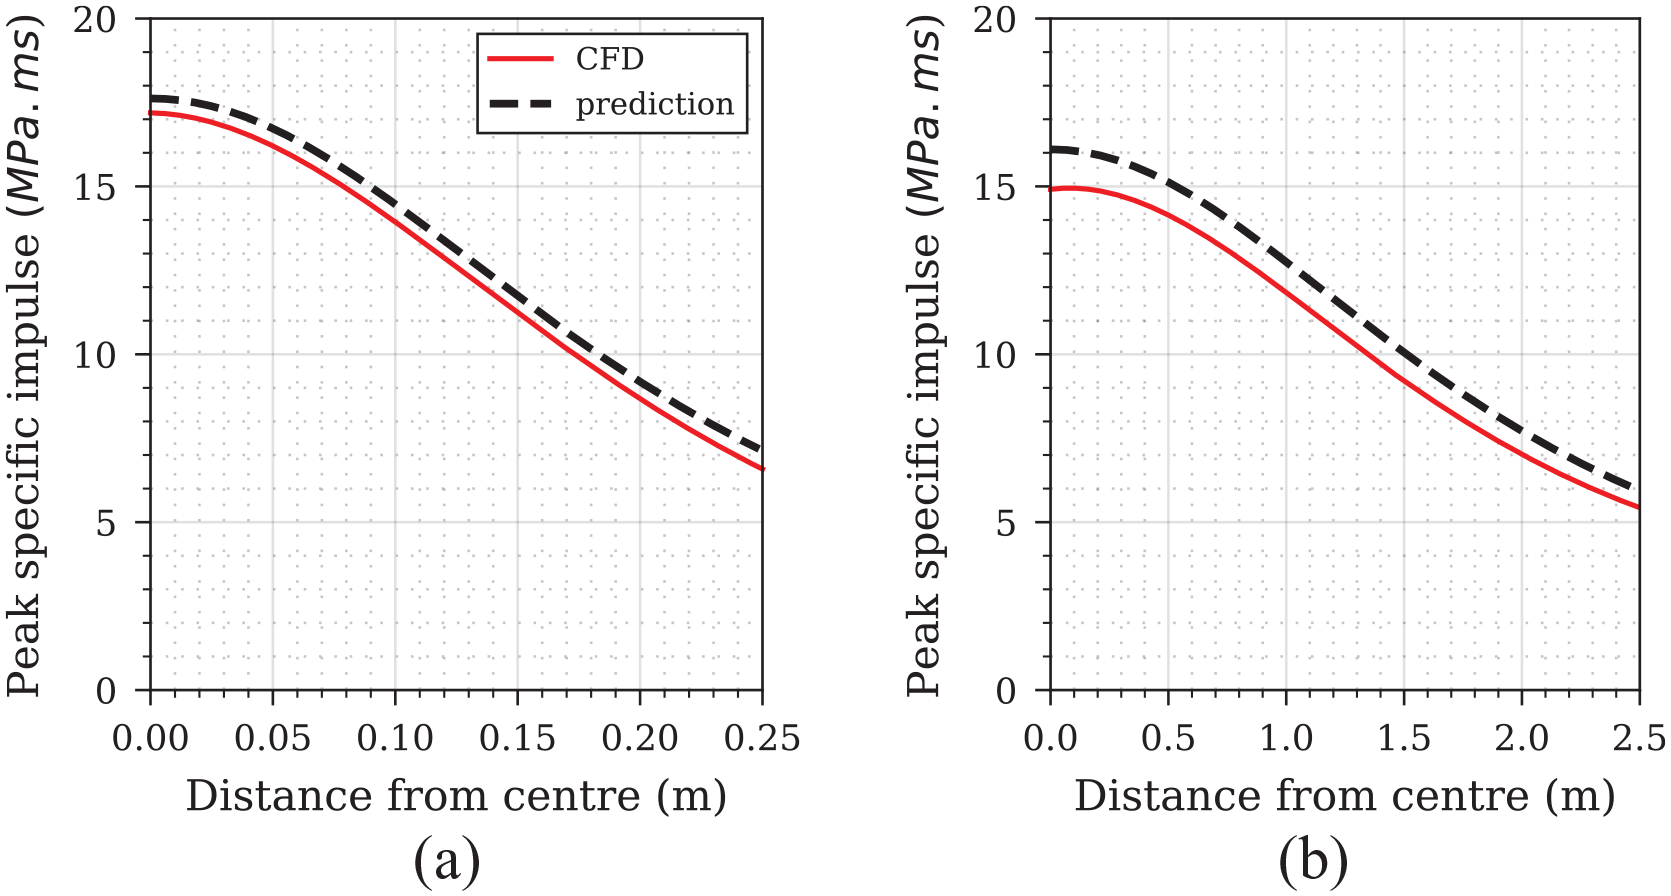
CFD and predicted peak specific impulse distributions: (a) 5 kg at 0.291 m stand-off,
Comparison of unseen CFD data and predicted peak specific impulses at various distances from the centre of the target.
Detonation of explosive charges aligned with the centre of a target plate presents the worst-case scenario in terms of imparted loading and resulting plate deformation/failure (Chung Kim Yuen & Nurick 2005; Chung Kim Yuen et al., 2016). However, there may be situations where an off-centre detonation is of interest to the analyst, and therefore the purpose of the following exercise is to demonstrate generality of the predictive model in terms of charge placement.
According to the terminology in Figure 12(a), angle of incidence at any point on the target plate can be calculated knowing the lateral distance from the point of interest to the normal impingement point,

Where, in the previous examples described in this article, the normal impingement point was coincident with the plate centre, thus
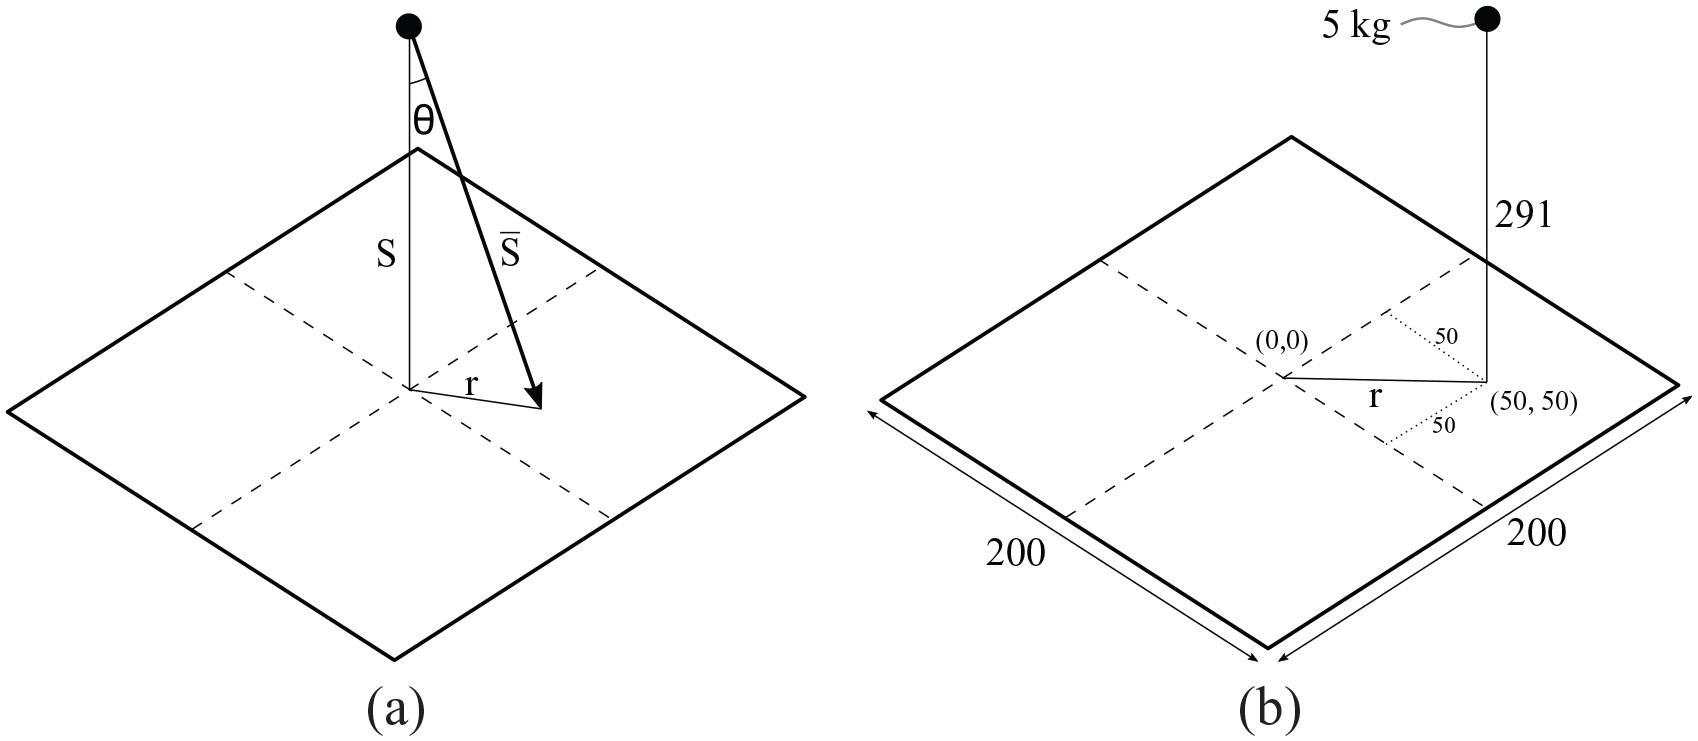
Experimental schematics for a spherical charge detonating above a square target: (a) general case of a centrally located charge; (b) example off-centre case of 5 kg PE4 at 291 mm normal stand-off distance, offset by 50 mm in both in-plane directions from the centre of a 200 mm square plate. Note: dimensions in mm.
The second set of unseen CFD comprises one model: a 5 kg spherical PE4 charge detonated at 291 mm normal stand-off distance (normal scaled distance,
Figure 13 shows a comparison between the CFD results and Gaussian model predictions using the Gaussian model for the off-centre charge example, evaluated on a grid of
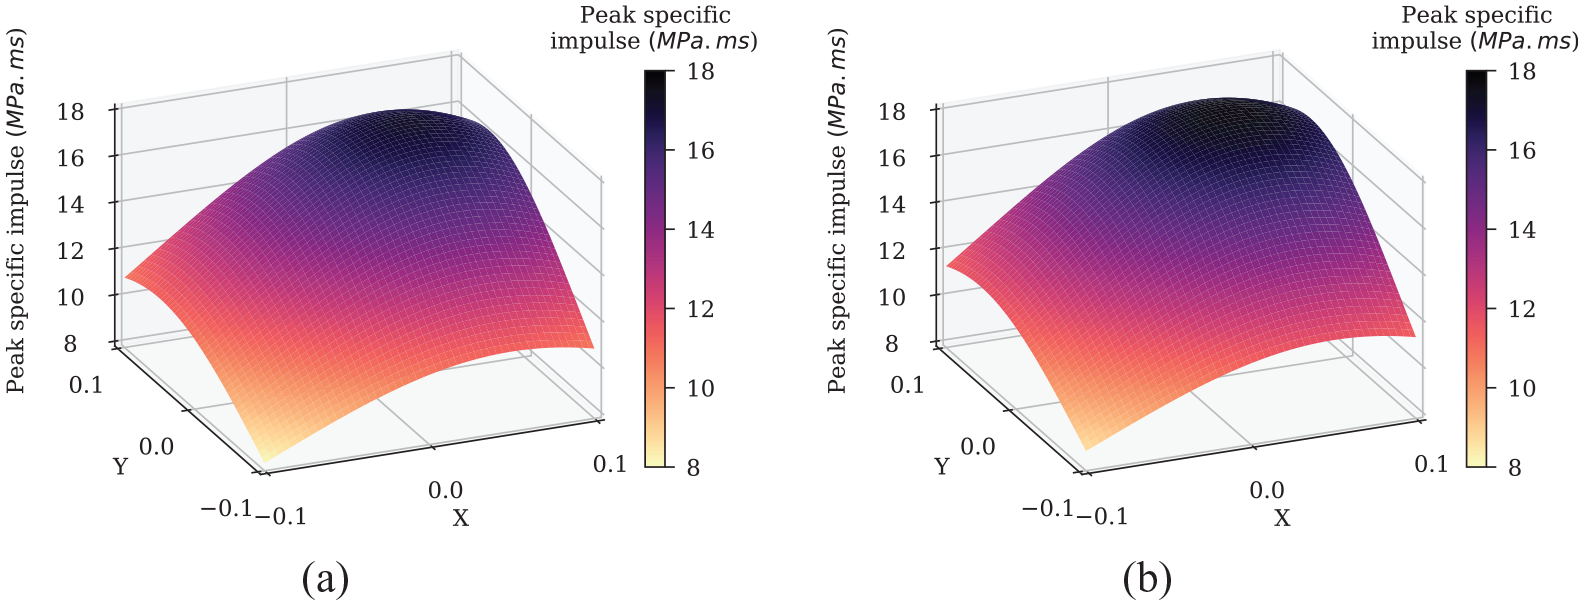
Peak specific impulse distributions for 5 kg spherical PE4 charge at 291 mm normal stand-off distance, offset by 50 mm in both in-plane directions (‘
Comparison against unseen experimental data
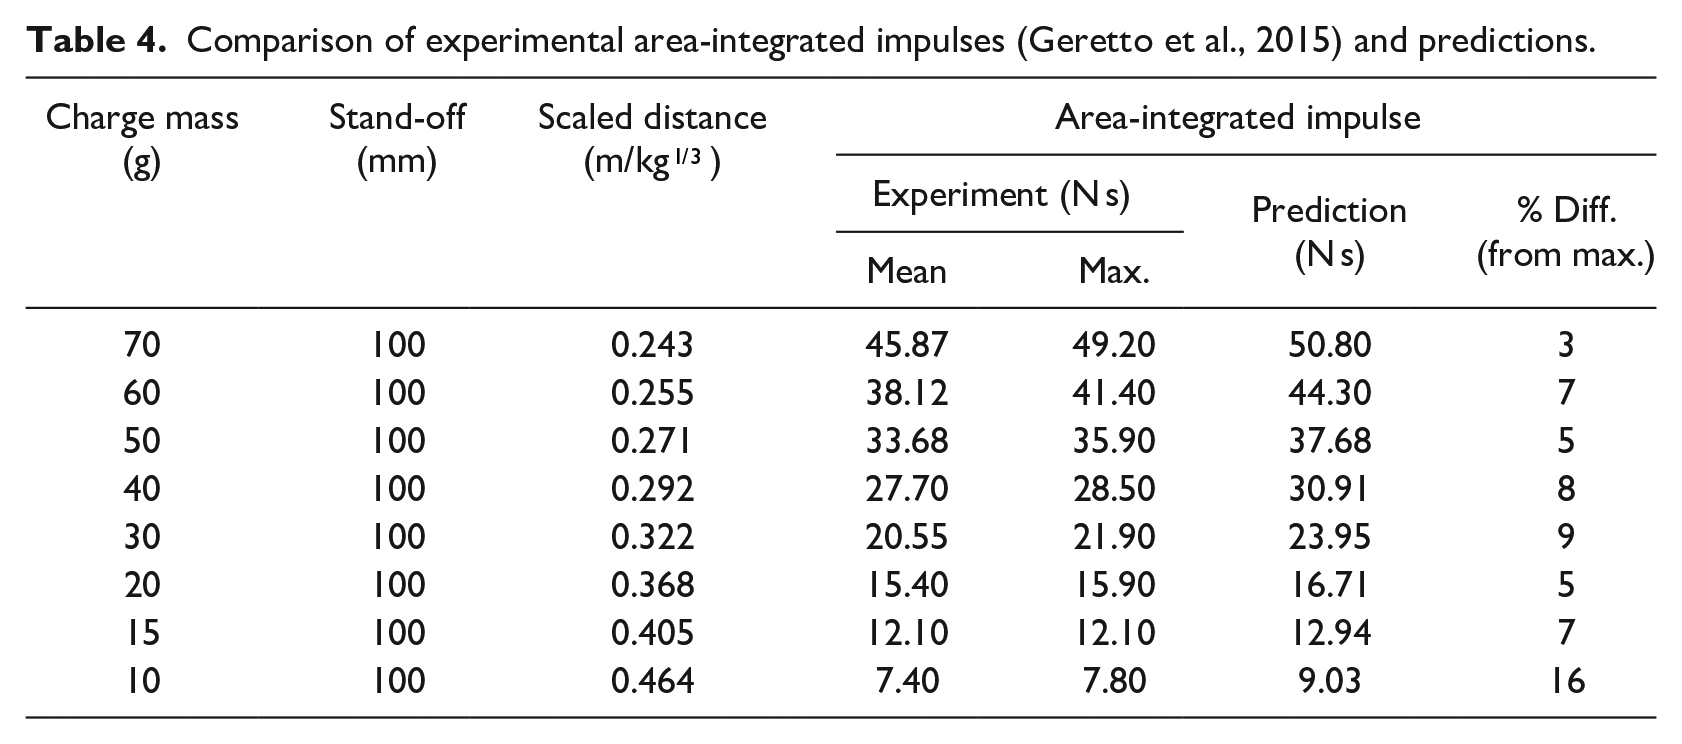
Finally, the experimental data presented in Table 2 of Geretto et al. (2015) is used to assess the accuracy of the method in calculating total impulse. Here spheres of PE4 explosive with masses ranging from 10 to 70 g were detonated at a constant stand-off distance of 100 mm (to charge centre, 0.243 ≤ Z ≤ 0.464 m/kg1/3) from a target plate with exposed area of
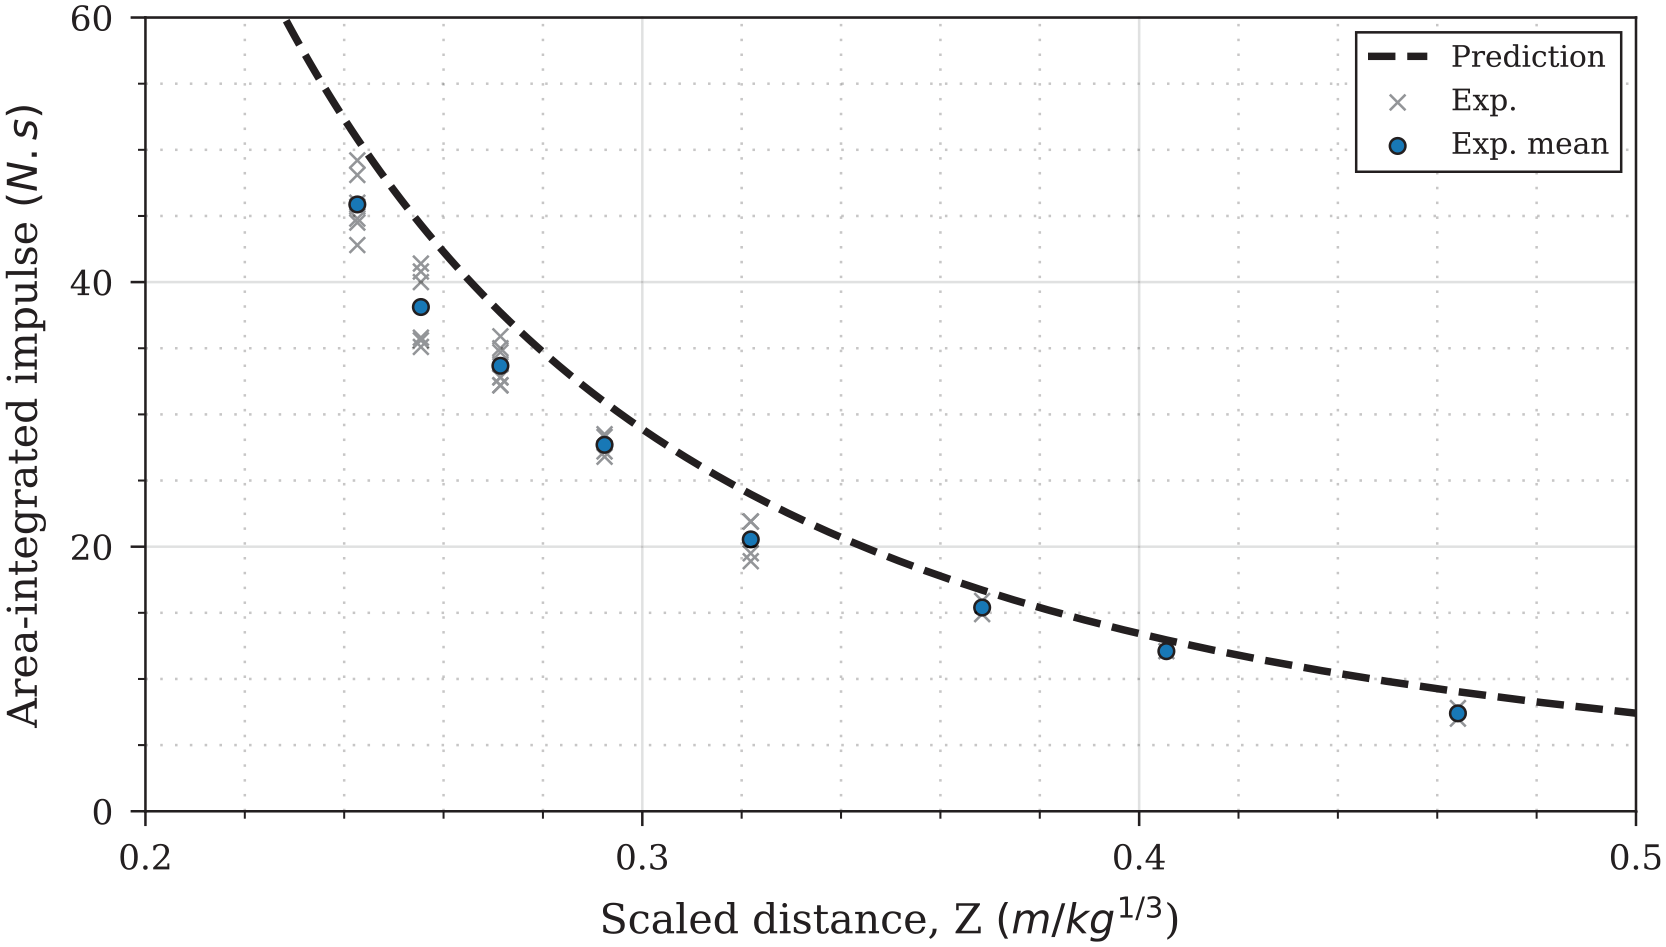
Comparison of predicted area-integrated impulse and experimental data from Geretto et al. (2015).
A direct comparison is provided in Table 4. It can be seen that, with the exception of the furthest scaled distance (16% difference), the predictions are all within 9% of the maximum recorded experimental area-integrated impulse. In all instances, the predictions are greater than the experimental values, confirming the slight conservatism of the method presented in this article. It is tentatively suggested that, in cases where a conservative model is not required, a factor of 0.9 may be applied to predicted specific impulses. Applying this factor here would shift the predictions from closely matching the maximum experimental values to closely matching the experimental mean.
Comparison of experimental area-integrated impulses (Geretto et al., 2015) and predictions.
Summary and conclusions
Peak specific impulse is the primary parameter that governs structural deformation under short-duration loading (Rigby et al., 2019b). Predicting the distribution of specific impulse acting on a reflecting surface following detonation of a high explosive charge remains a key challenge to engineers involved in transport security, infrastructure assessment and defence. This is a particular requirement in regions extremely close to the charge, where a historic lack of experimental data has precluded both the development of accurate semi-empirical predictive approaches and validation of high fidelity, physics-based numerical schemes. In this article, a new data-driven predictive model is developed to address a key issue facing the blast protection engineering community: the lack of an accurate and fast-running engineering tool for blast load prediction in the extreme near-field.
Newly-available experimental near-field specific impulse data is used to validate APOLLO Blastsimulator, an explicit CFD software specialising in problems involving blast wave propagation. A CFD dataset is populated with Apollo analyses, and the results are used to derive the novel data-driven surrogate model presented in this article. The approach is formed of two aspects: firstly, a Gaussian function is used to describe the relationship between normalised specific impulse and angle of incidence (shown in this article to form a consistent grouping for the range of scaled distances considered). Secondly, a power law is fit to values of peak normally reflected specific impulse, and Hopkinson-Cranz scaling (Cranz, 1926; Hopkinson, 1915) is used to express the predictions in scaled form. Separate equations are derived for the full dataset (0.11 ≤ Z ≤ 0.55 m/kg1/3) and a reduced dataset ( 0.11 ≤ Z ≤ 0.21 m/kg1/3) offering the analyst improved accuracy for extreme close-in detonations.
Finally, accuracy of the approach is rigorously assessed against: the full CFD dataset; two new CFD analyses using 5 kg and 250 kg explosives (which also demonstrates the applicability of the implemented scaling laws and the generality of the approach for off-centre charge placement); and experimentally-recorded impulse acting on a
The simple equations presented herein (three coefficients and three input variables: scaled distance, angle of incidence and charge mass) enable the fast and accurate prediction of near-field blast loads in situations where previous methods are known to be unsuitable or inaccurate. This paper has demonstrated the applicability of data-driven predictive approaches for blast load prediction. The methodology outlined in this article has the potential to be supplemented with more advanced, machine learning-assisted approaches to model a more complex suite of scenarios and input parameters, such as explosive type (TNT equivalence), charge shape effects and blast wave clearing.
Footnotes
Declaration of conflicting interests
The author(s) declared no potential conflicts of interest with respect to the research, authorship and/or publication of this article.
Funding
The author(s) disclosed receipt of the following financial support for the research, authorship, and/or publication of this article: Jordan J Pannell gratefully acknowledges the financial support from the Engineering and Physical Sciences Research Council (EPSRC) Doctoral Training Partnership.