
Abstract
Background:
Patients with primary aldosteronism (PA) exhibit a high prevalence of diabetes mellitus (DM). However, the relationship between visceral adipose tissue (VAT) and new-onset diabetes mellitus (NODM) in PA patients remains unclear.
Objectives:
To explore the association between VAT and the risk of NODM in PA patients.
Design:
This is a prospective cohort study spanning 10 years (2010–2020).
Methods:
A total of 342 PA patients were enrolled prospectively. Abdominal adiposity indexes, including VAT area, VAT ratio, subcutaneous adipose tissue (SAT) area, and SAT ratio, were measured using a computed tomography-based software at diagnosis.
Results:
Of 342 PA patients (46.2% male, mean age 50.8 ± 11.2 years), 35 (10.2%) developed NODM over a mean follow-up of 7.4 years. A positive nonlinear association between NODM risk and Log (VAT ratio) ⩾ −0.72 was observed (high-VAT group). High VAT (odds ratio (OR), 6.09; p = 0.005), older age (OR, 1.09; p < 0.001), higher body mass index (OR, 1.24; p < 0.001), higher waist-to-hip ratio (OR, 1.11, p < 0.001), lower baseline aldosterone (OR, 0.99, p = 0.011), higher diastolic blood pressure (OR, 1.05, p = 0.012), and lower systolic blood pressure (OR, 0.98, p = 0.045) as risk factors for high VAT. Adrenalectomy did not significantly associate with reduced NODM risk (OR, 0.49; p = 0.292).
Conclusion:
Our findings highlight that 10.2% of PA patients develop NODM over a mean follow-up of 7.4 years, with high VAT increasing the risk. Baseline VAT is a key determinant of NODM development in PA patients, regardless of targeted treatments.
Keywords
Introduction
Primary aldosteronism (PA) accounts for 5%–10% of hypertension cases. 1 Patients with PA are at higher risk for cardiovascular events and metabolic comorbidities than those with essential hypertension (EH).2,3 Previous studies report a 17.2% prevalence of type 2 diabetes mellitus (T2DM) in PA patients, 4 significantly higher than in EH patients5,6 and the general population. 7
Visceral adiposity is a well-established risk factor for T2DM in the general population.8–10 Excess visceral fat, rather than overall adiposity, has been independently associated with T2DM in obese adults. 9
The role of baseline visceral adiposity in predicting new-onset diabetes mellitus (NODM) risk in PA patients, despite targeted treatments, remains crucial. However, this association has not been specifically investigated in PA patients.
Objectives
This study aims to assess the association between baseline visceral adiposity and the development of NODM in PA patients undergoing targeted treatments, including adrenalectomy or mineralocorticoid receptor antagonist (MRA) therapy.
Design
PA patients were prospectively enrolled from the Taiwan Primary Aldosteronism Investigation (TAIPAI) database from 2010 to 2020. The reliability and validity of the TAIPAI database were confirmed using a longitudinal database from the National Health Research Institutes. This comprehensive database incorporates the original Taiwan National Health Insurance (NHI) program records, which encompass a population of 23.12 million insured individuals in 2015. 11 The National Health Insurance Administration (NHIA) regularly audits data from healthcare institutions and physicians to ensure NHI program integrity. 12 It is noteworthy that physicians in Taiwan are required to adhere to the clinical guidelines and policies endorsed by the NHIA, which serves as the sole nationwide healthcare insurance program in the country. This study followed the Strengthening the Reporting of Observational Studies in Epidemiology reporting guideline for cohort studies (Supplemental File).
PA diagnosis in hypertensive patients was based on renin-independent aldosterone hypersecretion, following standard criteria. 13 T2DM diagnosis followed the American Diabetes Association criteria. 14 Patients without a history of DM were diagnosed if they had either ⩾3 consecutive outpatient visits with antidiabetic prescriptions or a hemoglobin A1c (HbA1c) level ⩾6.5% (48 mmol/mol).
NODM occurrence and follow-up duration were obtained from the electronic medical database, including adrenalectomy and MRA therapy data. Patients were followed from the index date until February 31, 2020, or until diabetes diagnosis or death, whichever occurred first.
Methods
This prospective cohort study included abdominal computed tomography (CT) scans and collection of demographic and clinical data at diagnosis. Collected data included age, sex, body mass index (BMI), waist-to-hip ratio (WHR), systolic blood pressure (SBP), diastolic blood pressure (DBP), serum potassium, estimated glomerular filtration rate (eGFR), plasma aldosterone concentration (PAC), plasma renin activity (PRA), aldosterone renin ratio (ARR), 24-h urine aldosterone, fasting glucose, homeostatic model assessment of insulin resistance (HOMA-IR), cholesterol, triglycerides, adrenocorticotropic hormone (ACTH), and 08:00 am cortisol. Stepwise variable selection (forward and backward) was performed using the My.stepwise package in R. 15 Smoking history, hypertension duration, hyperlipidemia, and antihypertensive medications were also recorded. Cortisol levels after a 1 mg dexamethasone suppression test (DST) were collected.
Assessment of abdominal adipose tissue by using CT
Visceral adipose tissue (VAT) and subcutaneous adipose tissue (SAT) volumes were measured using CT with MATLAB-based software for accurate quantification. Waist circumference was assessed at the umbilical level, with VAT, muscular layer, and SAT delineated at the L4 transverse process to determine the total abdominal area. Threshold segmentation was used for VAT and SAT quantification, as detailed in previous studies. 16 To standardize VAT and SAT ratios, areas were divided by total abdominal area.
Statistical analysis
Continuous variables were reported as mean ± standard deviation, and categorical variables as percentages. Independent t-tests were used to compare demographic and clinical characteristics between groups. Statistical analysis was conducted using R software, version 4.1.1. (R Foundation for Statistical Computing, Vienna, Austria). A two-sided p-value of less than 0.05 was considered statistically significant. Relative risk and odds ratios (ORs) were adjusted for unilateral PA (uPA), sex, age, blood pressure, serum potassium, PAC, PRA, adrenalectomy, high VAT, smoking, and hyperlipidemia. Collinearity was assessed using the Variance Inflation Factor and Akaike information criterion (AIC). A Cox regression model with time-varying covariates was used to assess NODM risk factors. Sensitivity analysis with the E-value was performed to assess the impact of unmeasured confounders. 17 A generalized additive model (GAM) with splines was employed to evaluate the effects of VAT on NODM risk. 18 The model was adjusted for age, sex, serum potassium, SBP, PAC, PRA, diabetes follow-up duration, and diabetes medications. This approach adjusted for nonlinear effects of continuous variables, identifying the ideal cutoff where log odds equaled zero. Further details on the methodology can be found in the Supplemental Methods.
Results
A total of 342 newly diagnosed PA patients without concomitant diabetes (46.2% men; mean age 50.8 years) were included. Among these patients, 35 (10.2%) developed NODM during an average follow-up of 7.41 years.
Cutoff value of visceral adiposity at diagnosis for predicting NODM
A GAM revealed a positive nonlinear relationship between the risk of NODM (hazard ratio (HR) of NODM after treatment) and the logarithm of the baseline VAT ratio. This relationship was adjusted for age, sex, serum potassium, SBP, PAC, PRA, years of diabetes follow-up, and hypertensive medications (Figure 1). The GAM identified a cutoff value of −0.72 for the logarithm of VAT ratio (Log (VAT Ratio)). Patients with Log (VAT Ratio) ⩾ −0.72, referred to as the high VAT group, exhibited a higher likelihood of developing NODM. Furthermore, the low VAT group had a higher ratio of uPA compared to the high VAT group (56.3% (n = 72) vs 34.1% (n = 73), p < 0.001). The crude incidence rate of diabetes was also higher among PA patients in the high VAT group (Log (VAT Ratio) < −0.72) compared with the low VAT group (20.00 vs 3.21 per 1000 person-years) (Supplemental Table S1). A stepwise model selection using AIC was performed, and the Log (VAT Ratio) ⩾ 0.72 group showed an OR of 5.94 (95% confidence interval (CI), 2.0–25.5, p = 0.04).

GAM: the association between the VAT at diagnosis against hazard ratio of NODM.
Clinical characteristics of PA patients according to baseline Log VAT ratio
Among the 342 enrolled PA patients, the high VAT group was identified in 62.6% (n = 214) of individuals, and this group had a higher proportion of males and smokers. Moreover, the high VAT group exhibited significantly greater age, BMI, WHR, number of antihypertensive categories, and duration of hypertension, hyperlipidemia, triglycerides, glucose, and HOMA-IR at diagnosis. On the other hand, PA patients in the high VAT group had significantly lower pretreatment PAC, 24-h urine aldosterone levels, and eGFR. No significant differences were found between the groups in terms of PRA, basal 08:00 am cortisol and ACTH levels after 1 mg DST, potassium levels, blood pressure, cholesterol levels, heart rate, basal 08:00 am cortisol and ACTH levels, and urine microalbumin. Furthermore, PA patients in the low VAT group had a significantly higher rate of undergoing adrenalectomy compared to those in the high VAT group (46.7% (n = 100) vs. 68.8% (n = 88), p < 0.001). NODM was diagnosed in 15.9% (n = 32) of the high VAT group, whereas only 2.3% (n = 3) of the low VAT group developed NODM (p < 0.001) (Table 1).
Baseline demographic and clinical characteristics of PA patients according to Log (VAT ratio).

Continuous variables are presented as the mean ± standard deviation for normally distributed data and median (interquartile range) for nonnormally distributed data. Categorical variables are presented as frequency (percentage). Statistically significant (p < 0.05) (note: to convert potassium from mmol/L to mEq/L, multiply by 1; PAC from ng/dL to nmol/L, multiply by 0.02774; PRA from ng/mL/h to ng/L/s, multiply by 0.2778). HOMA-IR is calculated by fasting insulin (μU/mL) × glucose (mg/dL)/405.
ACEi/ARB, angiotensin converting enzyme inhibitor/angiotensin receptor blocker; ACTH, adrenocorticotropic hormone; BMI, body mass index; CCB, calcium channel blocker; DBP, diastolic blood pressure; DM, diabetes mellitus; DST, dexamethasone suppression test; eGFR, estimated glomerular filtration rate; HOMA-IR, homeostasis model assessment-insulin resistance; K, potassium; NODM, new onset diabetes mellitus; PA, primary aldosteronism; PAC, plasma aldosterone concentration; PRA, plasma renin activation; SAT, subcutaneous adipose tissue; SBP, systolic blood pressure; uPA, unilateral primary aldosteronism; VAT, visceral adipose tissue; WHR, waistline/buttocks ratio.
Clinical characteristics of PA patients stratified by new onset diabetes
In 342 patients with PA in our study cohort, NODM was diagnosed in 10.2% (n = 35). PA patients with NODM had a significantly higher BMI (26.5 ± 3.4 vs 24.7 ± 3.8, p = 0.006), smoking history (28.6% (n = 10) vs 12.7% (n = 39), p = 0.011), fasting glucose level (103.4 ± 14.8 vs 94.0 ± 11.2, p < 0.01), HOMA-IR (5.6 ± 6.3 vs 2.2 ± 2.8, p < 0.01), cholesterol (208.3 ± 36.6 vs 187.9 ± 35.3, p = 0.001), triglyceride (194.5 ± 96.4 vs 124.4 ± 76.2, p < 0.001) in comparison with those without diabetes. However, patients with NODM had a significantly lower 08:00 am cortisol after 1 mg DST (1.3 ± 0.7 vs 2.0 ± 2.1, p = 0.022), 24-h urine aldosterone level (11.9 ± 8.4 vs 17.2 ± 15.7, p = 0.007), and lower rate of undergone adrenalectomy (37.14% (n = 13) vs 57% (n = 175), p = 0.025). Additionally, PA patients with NODM showed a significantly greater VAT area (187.8 ± 73.5 vs 128.4 ± 70.6, p < 0.01), VAT Ratio (0.3 ± 0.1 vs 0.2 ± 0.1, p < 0.01), log (VAT Ratio) (−0.6 ± 0.1 vs −0.7 ± 0.2, p < 0.01) and log (VAT Ratio) ⩾ −0.72 (91.43% (n = 32) vs 59.28% (n = 182), p < 0.001), and total abdominal area (642.4 ± 162.1 vs 566.6 ± 138.4, p = 0.003) (Table 2).
Baseline characteristics of PA patients stratified by NODM.

Continuous variables are presented as the mean ± standard deviation for normally distributed data and median (interquartile range) for non-normally distributed data. Categorical variables are presented as frequency (percentage). Statistically significant (p < 0.05) (note: to convert potassium from mmol/L to mEq/L, multiply by 1; PAC from ng/dL to nmol/L, multiply by 0.02774; PRA from ng/mL/h to ng/L/s, multiply by 0.2778). HOMA-IR is calculated by fasting insulin (μU/mL) × glucose (mg/dL)/405.
ACEi/ARB, angiotensin converting enzyme inhibitor/angiotensin receptor blocker; ACTH, adrenocorticotropic hormone; BMI, body mass index; CCB, calcium channel blocker; DBP, diastolic blood pressure; DST, dexamethasone suppression test; eGFR, estimated glomerular filtration rate; HOMA-IR, homeostasis model assessment-insulin resistance; K, potassium; NODM, new onset diabetes mellitus; PA, primary aldosteronism; PAC, plasma aldosterone concentration; PRA, plasma renin activation; SAT, subcutaneous adipose tissue; SBP, systolic blood pressure; uPA, unilateral primary aldosteronism; VAT, visceral adipose tissue; WHR, waist–hip ratio.
Factors predicts the development of NODM in PA patients after targeted treatment
To investigate the factors associated with the HR for the development of NODM in PA patients after targeted treatment, we conducted an analysis using the Cox proportional hazard model and taking adrenalectomy as a time-varying factor (Supplemental Table S2). The ORs for PA patients with concomitant NODM after targeted treatment revealed that only a baseline log (VAT Ratio) ⩾ −0.72 was significantly associated with an increased OR for NODM among PA patients (OR, 6.09, p = 0.005) (Table 3), while other risk factors for DM, such as smoking (OR, 6.298, p = 0.082), hyperlipidemia (OR, 1.491, p = 0.346), or undergoing adrenalectomy (OR, 0.492, p = 0.292), showed no significant difference.
Clinical parameters at diagnosis associated with the risk of NODM in PA patients after targeted treatments.

CI, confidence interval; DBP, diastolic blood pressure; K, potassium; NODM, new onset diabetes mellitus; PA, primary aldosteronism; PAC, plasma aldosterone concentration; PRA, plasma renin activation; SBP, systolic blood pressure; uPA, unilateral primary aldosteronism; VAT, visceral adipose tissue.
The E-value, which evaluates the potential impact of unmeasured confounders, for the effect of baseline log (VAT Ratio) ⩾ −0.72 on NODM in PA patients with targeted treatment was 10.09, surpassing the HRs for the estimated NODM among PA patients (Supplemental Table S2). This analysis suggests that there is limited substantial unmeasured confounding affecting the observed association. 19
Factors correlated to visceral adiposity in PA patients
Older age (OR, 1.09, p < 0.001), higher BMI (OR, 1.24, p < 0.001), higher waist–hip ratio (OR, 1.11, p < 0.001), lower PAC (OR, 0.99, p = 0.011), higher DBP, and lower SBP (OR, 0.98, p = 0.045) were risk for high VAT by logistic regression (Table 4). A chord diagram displays inter-relationships between age, BMI, serum potassium, SBP, DBP, PAC, PRA, eGFR, Cre, VAT Ratio, SAT Ratio radially around a circle (Figure 2). The figure shows positive correlations in blue and negative correlations in red, with varying intensities. Notably, VAT exhibits a strong positive correlation with BMI, indicated by a deep blue color and a larger arc. Conversely, VAT shows a negative correlation with PAC, represented by a light red color and a smaller arc. Additionally, SBP demonstrates a strong positive correlation with DBP, displayed as a deep blue color with a larger arc.
Clinical parameters at diagnosis associated with Log (VAT Ratio) ⩾ −0.72 group in PA patients.
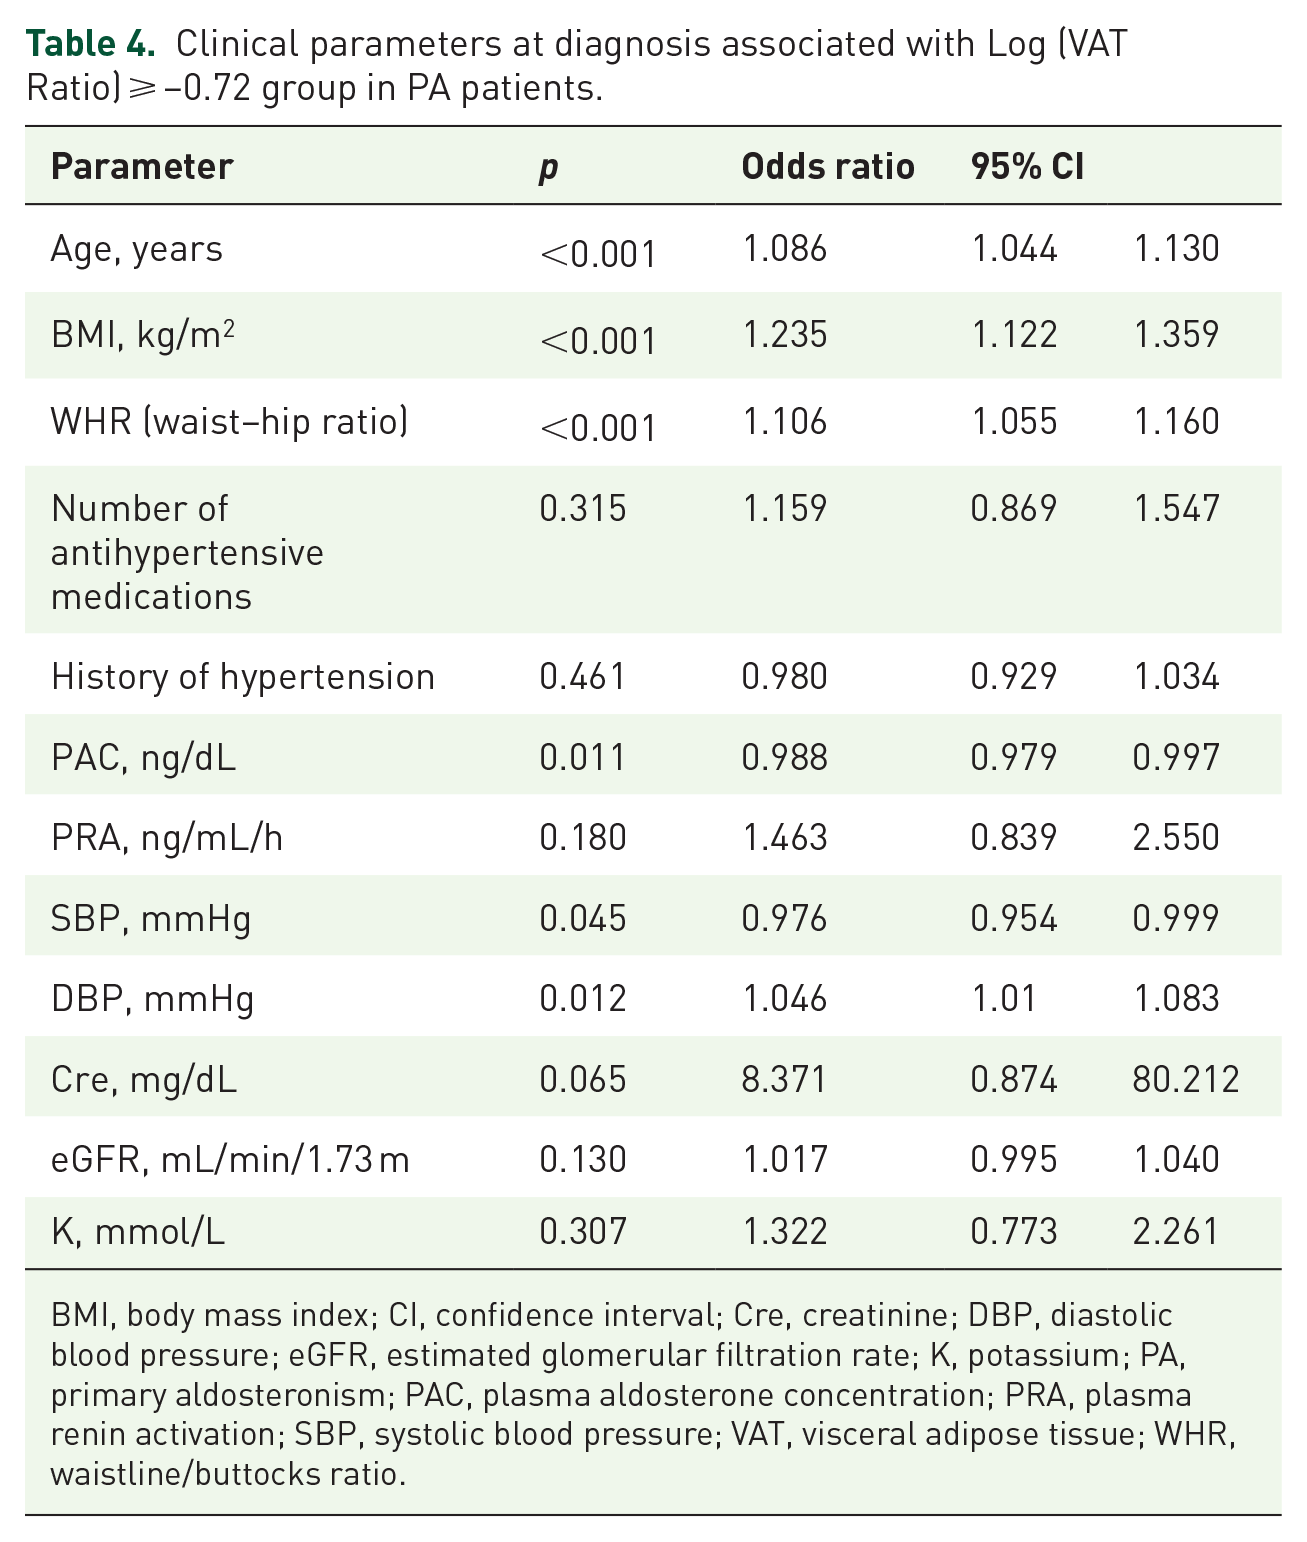
BMI, body mass index; CI, confidence interval; Cre, creatinine; DBP, diastolic blood pressure; eGFR, estimated glomerular filtration rate; K, potassium; PA, primary aldosteronism; PAC, plasma aldosterone concentration; PRA, plasma renin activation; SBP, systolic blood pressure; VAT, visceral adipose tissue; WHR, waistline/buttocks ratio.

Chord diagram: the interrelationships among clinical parameters.
Discussion
In this longitudinal cohort study, over 10% of patients with PA treated with adrenalectomy or MRA therapy developed NODM during a mean follow-up of 7.4 years. A strong association was observed between NODM risk and elevated baseline VAT, quantified by the logarithmic VAT ratio (more than or equal to −0.72). Additionally, advanced age, higher BMI, increased WHR, lower baseline aldosterone, elevated diastolic BP, and lower systolic BP were identified as significant predictors of elevated VAT levels.
NODM in PA
The pathogenesis of type 2 diabetes involves impaired insulin secretion by pancreatic β-cells and reduced insulin sensitivity in peripheral tissues. 20 In patients with PA, excessive aldosterone has been associated with both impaired insulin secretion21,22 and reduced insulin sensitivity.23,24 Elevated aldosterone levels have been shown to predict insulin resistance in the general population.25,26 The increased prevalence of type 2 diabetes in PA patients4,5 suggests a potential role of aldosterone in the development of insulin resistance and type 2 diabetes. However, the precise mechanisms by which aldosterone affects insulin secretion and sensitivity in PA remain unclear.
Several mechanisms may explain the development of type 2 DM in patients with PA. One mechanism involves aldosterone-induced activation of mineralocorticoid receptors (MRs), which impairs insulin sensitivity in skeletal muscle and adipocytes, contributing to insulin resistance. 27 Aldosterone also promotes the accumulation of proinflammatory cytokines and reduces beneficial adipokines, such as adiponectin, further compromising insulin sensitivity. 27 In peripheral tissues, including adipose tissue, skeletal muscle, and liver, aldosterone inhibit insulin signaling and decreases glucose uptake. 28 Additionally, aldosterone promotes reactive oxygen species generation, leading to endothelial dysfunction and impaired glucose diffusion. 29 Hypokalemia, commonly seen in PA, may also contribute to diabetes by impairing insulin secretion from pancreatic β-cells. 30
Adipocyte in PA
Aldosterone is key in regulating fluid balance and electrolytes by acting through the MR, which is also expressed in extra-renal tissues, including adipose tissue. This interaction contributes to obesity, insulin resistance, and metabolic syndrome. 31 In individuals without PA, studies have shown a correlation between elevated aldosterone levels and obesity 32 as well as increased MR expression in the adipose tissue of obese individuals.31,33
Interestingly, we found no association between cortisol levels after the 1 mg DST and baseline visceral adiposity in our cohort study. This suggests a possible dissociation between central obesity and cortisol activity in patients with PA.
PA subtype and NODM after target treatment
In our study, although uPA had a lower percentage of NODM than bilateral PA (BiPA), the PA subtype (uPA or BiPA) did not significantly increase the risk of NODM after long-term therapy. Previous studies have shown that patients with BiPA have significantly higher BMI compared to those with uPA,7,34,35 and BMI is a strong risk factor for diabetes. 36 However, research on the correlation between PA subtypes and NODM after targeted treatment remains limited.
The effect of treatment modalities and NODM in PA after target therapy
In short-term follow-up after surgical treatment for PA, several studies have shown that impaired insulin secretion improves within or up to 1 year following the removal of an aldosterone-producing adenoma by adrenalectomy.22,35,37,38 Insulin sensitivity also improved after adrenalectomy in some studies.4,23 However, other studies reported inconsistent improvements in insulin sensitivity postsurgery.22,37–39 These mixed results may be due to the short follow-up periods in many of the studies.
Preclinical studies suggest that MRAs reduce adiposity and inflammation in high-fat diet-fed mice, 40 indicating a protective effect on adipocyte function and glucose metabolism. Several studies have demonstrated that MRAs improve insulin sensitivity and glucose metabolism in obese mice.40,41 However, these beneficial effects of MRAs on adipose tissue and glucose homeostasis, observed in preclinical models, still require confirmation in human studies.
Catena et al. 42 reported that while insulin sensitivity rapidly normalized within the first 6 months after treatment with either adrenalectomy or MRA, long-term follow-up (averaging 7.4 years) showed no significant changes in glucose metabolism parameters. In our cohort, there was no significant difference in the risk of NODM between surgically and medically treated PA patients after long-term follow-up.
Limitation and strength
This study has several limitations. First, the number of patients who developed NODM was relatively small, which may have introduced a type I error due to the limited sample size. Nevertheless, this is the most comprehensive and regularly updated clinical follow-up to date. Second, we did not record why some uPA patients opted for treatment with MRAs instead of adrenalectomy. Additionally, the treatment modalities, including the time-varying effect of adrenalectomy, were not considered in the Cox model. Third, while we aimed to explore the relationship between visceral adiposity and NODM in patients treated for PA, we did not draw a definitive conclusion regarding a direct causal effect. NODM may still be influenced by the underlying pathophysiology of PA. To address this potential bias, we included patients undergoing targeted treatments, such as MRA therapy or adrenalectomy, and applied a time-varying model for adrenalectomy patients to mitigate immortal time bias, ensuring a more accurate evaluation of DM risk. Fourth, all participants were ethnically Taiwanese, limiting the generalizability of our findings to other populations.
However, this study has several strengths. We used CT to measure visceral adiposity, which has been suggested as a better predictor of type 2 diabetes than BMI. 43 Additionally, this is a longitudinal study with comprehensive follow-up, including different PA phenotypes. The data were derived from a prospective cohort with extensive health insurance coverage, representing over 99% of the Taiwanese population. Furthermore, we adjusted for multiple confounding factors in our multivariate analysis to enhance the validity of our results.
One limitation of our study is the potential risk of overfitting due to the number of adjusting factors relative to the number of events in the model. Although we employed AIC in a stepwise selection process to mitigate this, there may still be overlap among PA-specific variables, such as serum potassium, PAC, PRA, uPA, and adrenalectomy, which could introduce collinearity. Future, studies should focus on classical DM risk factors and reduce potential redundancy among PA-specific variables.
To check for overfitting, we performed stepwise model selection using AIC, which indicated limited overfitting with a VAT ratio threshold of more than or equal to −0.72. A QQ plot showed that most points aligned closely with the diagonal, indicating that the data followed a normal distribution. Moreover, we conducted a sensitivity analysis using E-value calculations to assess the robustness of our findings concerning unmeasured or uncontrolled confounders. This analysis suggested limited substantial unmeasured confounding in the study. 19
Conclusion
This longitudinal cohort study identified key predictors of NODM following adrenalectomy or MRA therapy, with a follow-up period of 7.4 years. Our findings indicate that baseline visceral adiposity, measured by the CT-derived logarithm of the VAT ratio (more than or equal to −0.72), is significantly associated with an increased risk of NODM, even after targeted treatments. Additionally, older age, higher BMI, increased WHR, lower baseline aldosterone levels, elevated DBP, and reduced SBP were also strongly associated with a higher risk of visceral adiposity.
Supplemental Material
sj-docx-1-taj-10.1177_20406223241301892 – Supplemental material for Visceral adiposity as a predictor of new-onset diabetes in patients with primary aldosteronism: a cohort study
Supplemental material, sj-docx-1-taj-10.1177_20406223241301892 for Visceral adiposity as a predictor of new-onset diabetes in patients with primary aldosteronism: a cohort study by Wen-Kai Chu, Leay Kiaw Er, Chin-Chen Chang, Jin-Ying Lu, Wan-Chen Wu, Yao-Chou Tsai, Yen-Hung Lin and Vin-Cent Wu in Therapeutic Advances in Chronic Disease
Supplemental Material
sj-docx-2-taj-10.1177_20406223241301892 – Supplemental material for Visceral adiposity as a predictor of new-onset diabetes in patients with primary aldosteronism: a cohort study
Supplemental material, sj-docx-2-taj-10.1177_20406223241301892 for Visceral adiposity as a predictor of new-onset diabetes in patients with primary aldosteronism: a cohort study by Wen-Kai Chu, Leay Kiaw Er, Chin-Chen Chang, Jin-Ying Lu, Wan-Chen Wu, Yao-Chou Tsai, Yen-Hung Lin and Vin-Cent Wu in Therapeutic Advances in Chronic Disease
Supplemental Material
sj-docx-3-taj-10.1177_20406223241301892 – Supplemental material for Visceral adiposity as a predictor of new-onset diabetes in patients with primary aldosteronism: a cohort study
Supplemental material, sj-docx-3-taj-10.1177_20406223241301892 for Visceral adiposity as a predictor of new-onset diabetes in patients with primary aldosteronism: a cohort study by Wen-Kai Chu, Leay Kiaw Er, Chin-Chen Chang, Jin-Ying Lu, Wan-Chen Wu, Yao-Chou Tsai, Yen-Hung Lin and Vin-Cent Wu in Therapeutic Advances in Chronic Disease
Footnotes
Acknowledgements
Membership of the Taiwan Primary Aldosteronism Investigation (TAIPAI) Study Group: Tai-Shuan Lai, Shao-Yu Yang, Chun-Fu Lai, Kao-Lang Liu, Chin-Chen Chang, Bo-Chiag Lee, Shuo-Meng Wang, Kuo-How Huang, Jeff S. Chueh, Po-Chih Lin, Yen-Hung Lin, Lian-Yu Lin, Shih-Cheng Liao, Ruoh-Fang Yen, Ching-Chu Lu, Vin-Cent Wu (National Taiwan University Hospital, Taipei City, Taiwan), Chieh-Kai Chan (National Taiwan University Hospital Hsin-Chu Branch, Hsinchu City, Taiwan), Leay-Kiaw Er, Ya-Hui Hu, Chia-Hui Chang, Che-Hsiung Wu, Yao-Chou Tsai (Taipei Tzu Chi Hospital, New Taipei City, Taiwan), Chen-Hsun Ho (Taipei Medical University-Shuang Ho Hospital, New Taipei City, Taiwan), Wei-Chieh Huang (New Taipei City Hospital), Ying-Ying Chen (MacKay Memorial Hospital) (http://doi.org/10.6084/m9.figshare.21669929).
Declarations
Supplemental material
Supplemental material for this article is available online.
References
Supplementary Material
Please find the following supplemental material available below.
For Open Access articles published under a Creative Commons License, all supplemental material carries the same license as the article it is associated with.
For non-Open Access articles published, all supplemental material carries a non-exclusive license, and permission requests for re-use of supplemental material or any part of supplemental material shall be sent directly to the copyright owner as specified in the copyright notice associated with the article.