
Abstract
Background:
Lumbar intervertebral disc and paravertebral muscle degeneration are common causes of chronic low back pain (CLBP). However, the exact etiology of CLBP in young patients remains unclear. Identifying the risk factors for CLBP in young patients could expedite the development of effective preventive recommendations.
Objectives:
To identify the factors influencing the presence and severity of CLBP in young patients by analyzing the associations between the fat content of the paravertebral muscles, T2 value of the lumbar intervertebral disc (LIVD), and visual analog scale (VAS) score.
Design:
Data for 23 patients diagnosed with CLBP were compared to those of 20 healthy young individuals.
Methods:
The T2 values of the LIVD and fat content of the psoas major (PM), multifidus (MF), and erector spinae (ES) muscles for 23 young patients with CLBP and 20 healthy individuals were measured and compared using synthetic magnetic resonance imaging and proton density fat fraction analyses. Moreover, the factors (T2 values and fat content) associated with severe CLBP (assessed using the VAS score) were analyzed.
Results:
The fat content of the right MF and ES was higher in patients with CLBP than in healthy individuals (p < 0.05). The T2 values of each LIVD in the CLBP and control groups were not significantly different (p > 0.05). Moreover, the VAS scores did not correlate with the T2 values of the patients (p > 0.05). The fat content of the bilateral MF and ES muscles was positively associated with the VAS score in young patients with CLBP (left MF: r = 0.506, p = 0.01; right MF: r = 0.532, p = 0.01; left ES: r = 0.636, p < 0.01; and right ES: r = 0.716, p < 0.01).
Conclusion:
Degeneration of the MF and ES may contribute to CLBP in young patients. In addition, the severity of CLBP is positively correlated with the degree of fat infiltration in the MF and ES.
Introduction
In clinical practice, chronic low back pain (CLBP) is a commonly diagnosed disease with a high incidence and recurrence rate that significantly affects the quality of life of patients. CLBP is a leading cause of global productivity loss and disability. 1 Owing to the lifestyles and nature of work in modern society, the number of young people with CLBP is rapidly increasing. 2 Spinal stability results from the combined contributions of the vertebral body, intervertebral disc, and paravertebral muscles. According to the literature, the vertebral body, intervertebral disc, facet joint, nerves, and paravertebral muscles are common contributors to CLBP. 3 Moreover, lumbar intervertebral disc (LIVD) degeneration commonly leads to CLBP.4,5 Magnetic resonance imaging (MRI) techniques, such as T2-weighted imaging, can be used for the grading of intervertebral disc degeneration.6,7 through morphological information and signal-change monitoring. T2 mapping can be used to evaluate the degree of intervertebral disc degeneration more quantitatively than conventional MRI sequences. 8 In addition, paravertebral muscle degeneration, which significantly influences spinal stability and movement, is closely related to the occurrence of CLBP, 9 especially in the psoas major (PM), multifidus (MF), and erector spinae (ES) muscles. Paravertebral muscle degeneration in patients with CLBP is commonly associated with increased muscle fat infiltration. 10 However, the exact etiology of CLBP in young patients, including an analysis of the factors associated with severe CLBP, has not been comprehensively elucidated to date.11,12 Identifying the factors associated with CLBP in young patients is essential for proposing effective preventive recommendations for the condition.
Proton density fat fraction (PDFF) data on the iterative decomposition of water and fat acquired through echo asymmetry and least-squares estimation (IDEAL-IQ) are considered reliable for accurately quantifying fat infiltration in muscles 13 and the fat content of the paravertebral muscle,14,15 comparable to MR spectroscopy data (the gold standard in vivo method for analysis). Synthetic MRI (SyMRI), a new quantitative MR technology, enables the automatic generation of the tissue longitudinal relaxation time (T1 map), transverse relaxation time (T2 map), and proton density distribution (PD map) with one MRI scan through MRI compilation (MAGiC). 16 Several papers report the use of this rapid, feasible, 17 and repeatable 18 method in different tissues, such as nerves, 19 the brain, 20 joints, 21 and spine. 17 In addition, T2 values from the MAGiC sequence enable the reliable quantitative measurement of LIVD degeneration. 22
This study aims to clarify the risk factors for CLBP in young people using PDFF and SyMRI. Factors associated with CLBP severity in young patients have not been extensively investigated to date, making the results of this study particularly significant. In this study, the factors influencing pain severity were analyzed using a visual analog scale (VAS).
Methods
Study population
In all, 32 young patients with CLBP and 23 healthy young adults were recruited from the hospital between February and August 2022. After applying inclusion and exclusion criteria, the data of 23 young patients clinically diagnosed with CLBP and 20 healthy young individuals were prospectively collected and analyzed. An a priori analysis was used to calculate the sample size using the G-Power program (effect size: 0.8, α error: 0.05, power (1−β) error: 0.8, allocation ratio N2/N1:1). The total sample size was 42. All patients underwent lumbar MRI.
An outpatient orthopedic doctor diagnosed patients with CLBP using the following diagnostic criteria: pain or discomfort of musculoskeletal origin occurring below the lowest rib on the back and above the gluteal fold for more than 3 months, with or without radiating pain in the lower extremities. 23 A VAS with anchor points at 0 mm (no pain) and 100 mm (worst possible pain) was used to assess the pain level of the patient. 24 Except for the absence of any current or past low back pain, all inclusion and exclusion criteria were the same for participants in the normal and CLBP groups. The inclusion criteria were as follows: (1) age 18–35 years and (2) lack of MR contraindications, such as a pacemaker, early pregnancy (reduced paravertebral muscle degeneration caused by pregnancy), and claustrophobia. The exclusion criteria (MRI scans and clinical history) were as follows: history of neuromuscular disease, such as sarcopenia; inflammatory or metabolic conditions; lumbar dysplasia, such as butterfly vertebra; history of spinal trauma, lumbar fracture, spondylolysis, or lumbar spondylolisthesis; history of spinal tumors or spinal tuberculosis; history of ankylosing spondylitis; or history of paravertebral surgery, radiotherapy, or chemotherapy (Figure 1).

Flowchart of the patient selection process.
MRI equipment and imaging methods
All participants were scanned using a 3.0-T MR scanner (SIGNA Architect, GE Healthcare, Milwaukee, WI, USA) with a 40-channel spine posterior coil and a 30-channel body anterior AIR coil. In the hospital, MAGiC and IDEAL-IQ sequences were acquired as clinically indicated. Identical coronal quantitative 2D MAGiC and IDEAL-IQ MRI scan protocols were used for young patients with CLBP and healthy individuals. All patients were placed in a supine position during the examination. The parameters of the coronal MAGiC sequence were as follows: repetition time = 4000 ms; echo time (TE) = 12.4 ms; Eff. TE2 = 92.7 ms; inversion time = 28 ms; field of view = 36 × 36 cm; acquisition matrix = 192 × 192; slice thickness = 4 mm; interslice gap = 0.5 mm; number of slices = 22; flip angle = 90; bandwidth = 50.00 kHz; number of excitations = 1; echo train length = 16; and acquisition time = 3 min 28 s. The parameters of the coronal IDEAL IQ sequence were as follows: repetition time = 7.4 ms; field of view = 36 cm × 36 cm; acquisition matrix = 128 × 128; slice thickness = 4 mm; interslice gap = 0.5 mm; number of slices = 22; flip angle = 3; bandwidth = 111.11 kHz; excitations = 0.5; echo train length = 3; and acquisition time = 24 s.
Image analysis and measurement
Multiple-delay multiple-echo data were reconstructed and analyzed using the MAGiC software on a 64-bit Advantage Workstation (GE Healthcare). The software automatically generated T1, T2, and PD maps of the coronal positions from the MAGiC sequence. Two radiologists with extensive diagnostic experience (more than 10 years of work experience) were blinded to the clinical information of the group; they independently analyzed the images and measured data. The T2 value was estimated by delineating regions of interest (ROIs) on the T2WI map using the software operation interface. The fat content in the bilateral PM, MF, and ES muscles was quantified in all participants based on the fat fraction map generated from the IDEAL-IQ sequence on positioning the coronal T2WI map.
The paravertebral muscles were distributed in a longitudinal pattern. To include maximum muscle information and minimize measurement errors, the ROIs of the paraspinal muscles were positioned on the central slice of the long axis of the paraspinal muscles at the L3–4 level. The ROIs were delineated along the muscle contour, carefully avoiding the surrounding fat tissue (Figure 2). The ROIs were measured three times, and the average of the three measurements was considered the fat percentage of the paravertebral muscles. The unit fat content was calculated as a percentage.

The fat content of the psoas major, multifidus, and erector spinae muscles in a young patient with CLBP (male, 31 years of age) was measured by delineating/positioning the ROIs on a T2WI map (a). The fat fraction map shows that the fat content of the right multifidus and erector spinae muscles is higher than that of their left counterparts (yellow boxes). The T2 values of the lumbar intervertebral disc are measured by delineating/positioning the ROIs on a T2WI map (b).
ROIs were used to measure the T2 values of the LIVD. The software automatically calculated the T2 values of each LIVD from ROIs generated by delineating every nucleus pulposus of the LIVD from lumbar 1/2 (L1/2) to lumbar 5/sacral 1 (L5/S1) at the center of the coronal vertebral body (Figure 2).
The fat content of the paravertebral muscles and T2 values of the LIVD for young patients with CLBP and healthy individuals were quantified and compared. In addition, relationships between the fat content of the bilateral paravertebral muscles, the T2 value of the LIVD, and the VAS score were analyzed.
Statistical analysis
The Prism 9 software (GraphPad Software Inc., San Diego, CA, USA) was used for statistical analyses; p < 0.05 was considered to indicate statistical significance. All groups were subjected to a normal distribution test. Normally distributed data are expressed as the mean ± standard deviation, whereas non-normally distributed data are expressed as the median (interquartile range). To compare the fat content between the bilateral paravertebral muscles, the fat content and T2 values of the CLBP groups and normal individuals were compared using the Student’s t-test or Mann–Whitney U test. Spearman correlations were also calculated between the fat content of the bilateral paravertebral muscles and VAS scores and between the T2 values of the LIVD and VAS scores in young patients with CLBP. Bland–Altman analysis was used to assess the consistency of measurements (T2 values of the L1/2 and L5/S1 intervertebral discs and fat contents of the PM, MF, and ES) between the two observers. 24
Results
A total of 55 individuals were screened at the hospital between February 2022 and August 2022. The data of seven patients with CLBP were excluded because they were previously diagnosed with other basic diseases related to the lumbar spine. The data of two patients with CLBP and three healthy individuals were excluded because of poor image quality (owing to the presence of image issues such as motion artifacts and scanning range defects). Finally, the data of 23 young patients clinically diagnosed with CLBP and 20 healthy individuals with an average age of 31.0 (26.00, 33.00) years were used for analysis. Both groups showed comparable age, sex, and BMI (p > 0.05; Table l).
Demographic data of 23 young patients with low back pain and 20 normal individuals.

p < 0.05 represents statistical significance.
Data are presented as “mean ± SD” or “median (quartile range).”
Paravertebral muscle analysis in young patients with CLBP and normal individuals
All data and images of patients and healthy individuals were available. The fat content of the paravertebral muscles of patients with CLBP and young normal individuals is listed in Table 2. The fat content of the right MF and ES was higher in patients with CLBP than in healthy individuals (p < 0.05; Figure 3(a)); however, the fat content of the PM was similar in both groups (p > 0.05). In addition, in young people with CLBP, the fat content in the right MF and ES was significantly higher than that in the left MF and ES (p = 0.01 and p < 0.01, respectively) (Figure 3(b)). The fat content of the bilateral paravertebral muscles did not differ significantly among healthy individuals (all p > 0.05).
The fat contents of paravertebral muscle groups in 23 young patients with low back pain and 20 normal individuals.

p < 0.05 represents statistical significance, bold values show statistical significance.
ES, erector spinae muscles; MF, multifidus; PM, psoas major.
Data are presented as “mean ± SD” or “median (quartile range).”
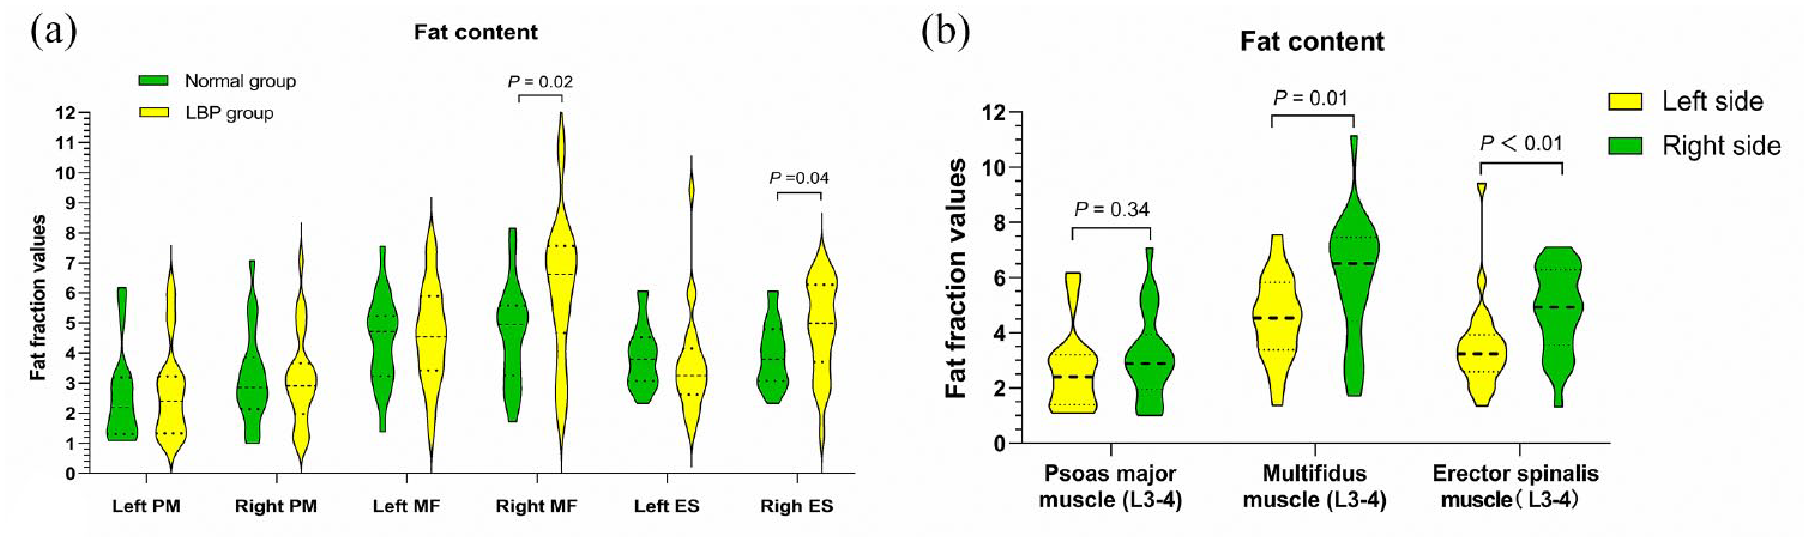
Quantitative fat content measurements of the bilateral PM, MF, and ES muscles in young patients with CLBP and healthy individuals. The fat content of the right MF and ES muscles is higher in patients with CLBP than in healthy individuals (p = 0.02, p = 0.04) (a). The fat content in the right MF and ES muscles is higher than that in their left counterparts (p = 0.01, p < 0.01) (b).
Measurement of LIVD in young patients with chronic CLBP and normal individuals
A total of 215 disks were delineated and measured for analysis. The T2 values of the LIVDs in patients with CLBP and healthy individuals are shown in Table 3. Significant differences were not observed between the T2 values of the CLBP and normal groups at any LIVD (all p > 0.05), indicating an equivalent degree of intervertebral disc degeneration in both groups.
The T2 values of lumbar intervertebral discs in 23 young patients with low back pain and 20 normal individuals.

p < 0.05 represents statistical significance.
Data are presented as “mean ± SD” or “median (quartile range).”
LBP, low back pain.
Inter-rater reliability
The consistency of the T2 values of the L1/2 and L5/S1 intervertebral discs and the fat content in the PM, MF, and ES reported by both observers were estimated with a confidence interval (CI) of 95%. The 95% limits of agreement for content were as follows: left psoas major, −0.000595 to 0.0005994; right psoas major, −0.0003275 to 0.0003318; left multifidus, −0.05765 to 0.05626; right multifidus, −0.05986 to 0.06037; left ES, −0.07060 to 0.06434; and right ES, −0.05923 to 0.05240. The T2 relaxation times of the L1/2 and L5/S1 intervertebral discs ranged from −1.34 to 1.427 and −1.294 to 1.207, respectively. The Bland–Altman analysis indicated good consistency between the results reported by the two radiologists (Figure 4).

Bland–Altman analysis of the consistency of the measurements of the fat content of the psoas major (a, b), multifidus (c, d), and erector spinae (e, f) and the T2 relaxation time values of the L1/2 and L5/S1 intervertebral discs (g, h). The results reported by two radiologists are consistent.
Correlations between VAS scores and the fat content of the paravertebral muscles in young patients with CLBP
The fat content of the bilateral MF and ES was positively associated with the VAS score in young patients with CLBP (left MF, r = 0.506, p = 0.01; right MF, r = 0.532, p = 0.01; left ES, r = 0.636, p < 0.01; right ES, r = 0.716, p < 0.01); the right-hand-side muscle showed a slightly greater correlation with the VAS score. The VAS scores tended to increase with increasing fat content in the bilateral MF and ES. However, the fat content of the bilateral PM was not associated with the VAS score in young patients with chronic CLBP (left PM, r = 0.349, p = 0.10; right PM, r = 0.281, p = 0.19).
Correlation between VAS scores and the T2 values of LIVDs in young patients with CLBP
The T2 values of each LIVD were not associated with the VAS scores in young patients with CLBP (L1/2: r = −0.055, p = 0.80; L2/3: r = −0.104, p = 0.64; L3/4: r = 0.018, p = 0.94; L4/5: r = 0.036, p = 0.87; L5/S1: r = −0.107, p = 0.63), indicating that the degree of intervertebral disc degeneration was not associated with the severity of CLBP.
Discussion
In this study, the fat content of the paravertebral muscles was higher in patients with CLBP than in healthy individuals, indicating that paravertebral muscle fat infiltration may contribute to CLBP in young patients. The fat content of the right MF and ES muscles was higher in patients with CLBP than in healthy individuals, while the fat content of the PS muscle was similar; this observation may be closely related to the physiological function of these muscles. According to Lee et al., 26 stress loading is closely related to muscle degeneration. Paravertebral muscles, especially the MF and ES, are essential for maintaining spinal stability and controlling lumbar motion. 27 , 28 The MS and ES are important components of the posterior extensor muscles of the spine and provide support, contributing to lumbar spine stability. Paravertebral muscle degeneration is mainly observed as an increase in fat infiltration and reduction in cross-sectional area. The MF and ES show two characteristic anatomical differences: they differ in orientation and length. The MF shows a large cross-sectional area, short fiber length, and two fiber orientations, the first is perpendicular to the spinal axis, while the second is horizontal to the spinal axis. With a large mass in a single volume unit, the MF muscles can rapidly generate a strong force to adjust the stability of the spine and prevent rotation and sliding, thereby maintaining the physiological curvature and structure of the lumbar spine. 29 When the human body is in motion, more than two-thirds of its spinal strength is provided by the MF. 30 The ES muscles are mainly perpendicular to the spinal axis. According to the cantilever beam mechanism, the lever length is positively correlated with an increase in the lever force or stress. 31 Therefore, the longer ES muscle from the sacrum to the second rib is routinely subjected to high-stress loading. By contrast, among the major muscles that maintain the movement and stability of the lumbar spine, the PS muscle, which functions mainly during hip flexion and external rotation, is routinely subjected to less tension than the MF and ES muscles. In this study, the degree of fat degeneration in the MF and ES muscles was significant, whereas that in the PS muscle was small and not significantly different from that in the normal muscle, consistent with the results of previous studies.26,32 These results indicate that MF and ES degeneration is common in young patients with CLBP and may contribute to pain.
The T2 values estimated through MAGiC reflected the degree of LIVD degeneration accurately, 22 possibly because the decrease in proteoglycans and water content in the nucleus pulposus during LIVD degeneration manifests mainly as a decrease in the T2 relaxation time. 33 T2 mapping is a feasible method for detecting changes in the intervertebral disc component (water content), regardless of the extent of morphology changes. 34 No significant differences were observed between the T2 values of the CLBP and normal groups at any LIVD, indicating an equivalent degree of intervertebral disc degeneration (if present) in both groups. Unlike previous studies, which indicate a strong association between lower back pain and disc degeneration in older populations, LIVD was not associated with CLBP in the study population used here. Future studies should work with a larger age range to enable the use of older versus younger individuals as a comparison group for pain and no pain.
Furthermore, the fat content of the bilateral MF and ES was positively associated with the severity of CLBP in this study. Previous studies 35 indicate that muscle mass critically influences CLBP; however, the direct relationship between paraspinal muscles and pain requires further exploration. In this study, the VAS scores tended to increase with increasing bilateral MF and ES muscle fat content; however, these associations were not observed between the T2 values of the LIVDs and VAS scores. Fat infiltration in the lumbar MF and ES leads to a reduction in muscle strength and contractility, thereby diminishing the ability of the lumbar vertebrae to maintain tension. Consequently, the spinal tension is reduced and the spinal burden is increased, ultimately leading to CLBP. Pain limits lumbar spine movement, exacerbating fat infiltration in the paravertebral muscles further. 36 Notably, the fat content of the left-side MF was similar to that of normal participants; however, the VAS score increased with the fat content of the left-sided MF in the CLBP group, whereas it did not increase in the normal group, possibly owing to the higher fat content in patients with CLBP than in those with MF. The MF fat content in patients with CLBP was higher than that in the normal group; the difference, which was not significant, can be attributed to the small sample size used in this study. An expansion of the sample size may yield more significant results. Investigating factors associated with the presence and severity of CLBP can aid in the development of effective interventions. In this study, CLBP in young individuals was associated with fat infiltration into the paravertebral muscles. Previously published randomized controlled trials indicate that exercise can reduce future pain intensity during short-term follow-up among patients with CLBP.37,38 In young individuals, activities directed at reversing or avoiding paraspinal muscle fat infiltration may help prevent and relieve low back pain.
Interestingly, in this study, the fat content of the MF and ES on the right side was significantly greater than that of the left side in patients with CLBP. By contrast, the bilateral paravertebral muscles of healthy individuals were similar and mostly symmetrical. An asymmetry of >10% between the left and right paravertebral muscles is considered an indicator of dysfunction or pathology. 39 According to a previous publication, handedness and familial aggregation contribute to the asymmetry of fat infiltration in the MF and ES muscles. 40 In this study, greater fat infiltration was observed in the right MF and ES than in the left muscles of young individuals with CLBP, possibly because young patients with CLBP experience uneven forces on the left and right sides of the lumbar vertebrae. Moreover, all participants in this study were right-handed; the long-term holding or lifting of heavy objects with the right hand can lead to a lateral shift in the center of gravity. The contralateral MF and ES muscles contract to avoid collapse and lateral bending of the spine. Therefore, in this study, the muscles on the left underwent enlargement and relatively less fat infiltration than those on the right. 40
Limitations
The small sample size used for analysis is a limitation of this study. For more precise analysis leading to comprehensive results, future studies should focus on a larger sample size. The 2D nature of the collected MAGiC sequences comprises another limitation of this study. Quantitative 3D MAGiC sequences were unavailable; therefore, despite greater signal impairment than 3D sequences, 2D MAGiC sequences were used in this study. Future studies should use the 3D MAGiC sequences.
Conclusion
In conclusion, the results of this study indicate that MF and ES muscle degeneration occur in young patients with CLBP and may be a factor that contributes to CLBP. Moreover, the severity of CLBP positively correlates with the degree of fat infiltration in the MF and ES; this result may be particularly significant for future research on CLBP. Future studies on CLBP should include older participants to enable age and pain comparisons in patients with paraspinal muscle degeneration. Therefore, this study indicates that activities directed at reversing or avoiding paraspinal muscle fat infiltration may help prevent and alleviate lower back pain. The results of this study could facilitate future research on the prognosis and alleviation of CLBP.